Trellix ePO On-Prem Integration for Elastic
| Version | 0.1.0
|
| Managed integration release status |
|
| Subscription level What's this? |
Basic |
| Developed by What's this? |
Elastic |
| Ingestion method(s) | API, Network Protocol |
| Minimum Kibana version(s) | 9.1.0 8.19.0 |
You can use this integration as an Elastic Managed integration on Elastic Cloud Hosted deployments running this version or later.
To use pre-release integrations, go to the Integrations page in Kibana, scroll down, and toggle on the Display beta integrations option.
Trellix ePolicy Orchestrator (ePO) On-Prem is a centralized security management platform for managing endpoint policies, products, systems, and security events across an organization.
The Trellix ePO On-Prem integration for Elastic collects logs using the Trellix ePO REST / Web API and events forwarded over syslog, and lets you visualize that data in Kibana.
This integration collects data from the Trellix ePO On-Prem REST / Web API and from events forwarded over syslog. It has been tested against the Trellix ePO On-Prem Web API. To collect the event data stream, Trellix ePO must be configured to forward RFC 5424 syslog messages containing XML EPOEvent payloads.
For the API-based data streams, this integration periodically queries the Trellix ePO REST / Web API to retrieve records for each enabled data stream. For the event data stream, Elastic Agent listens for events that Trellix ePO forwards over TCP syslog. Each record is mapped to the Elastic Common Schema (ECS) and enriched by the integration's ingest pipeline.
The Trellix ePO On-Prem integration collects the following types of data:
| Data stream | Description | Source |
|---|---|---|
audit |
Audit log records covering system administration, policy changes, user activity, and other security-related actions. | /remote/core.executeQuery API |
web_control |
Web control events, including browsed URLs, the acting user, and the content/category ratings and actions Web Control applied. | /remote/core.executeQuery API |
compliance_history |
Point-in-time compliance snapshots, including evaluated computer counts and compliant/noncompliant counts and percentages per reporting task. | /remote/core.executeQuery API |
system |
Managed system (endpoint) records from the System Tree, including agent identity and version, managed and communication state, node placement, and tag assignment. | /remote/core.executeQuery API |
product_event |
Product operation events on managed endpoints, including the operation type and initiator, the affected product, the acting user, and the event outcome. | /remote/core.executeQuery API |
device_event |
Removable-media device control events, including device backup, protection, and initialization status and the associated agent and user. | /remote/core.executeQuery API |
dlp_incident |
Data Loss Prevention incidents, including violation time, severity, status, evidence counts, classifications, and matched rules and actions. | /remote/core.executeQuery API |
threat_event |
Endpoint threat events with matching extended details, including detections, rules, actions, severity, network activity, files, processes, and related entities. | /remote/core.executeQuery API |
event |
Endpoint security events forwarded by Trellix ePO over syslog, including threat, web control, data loss prevention, product, authentication, and reputation events. | TCP syslog |
Integrating Trellix ePO On-Prem with Elastic provides centralized visibility into endpoint security and administrative activity across your ePO deployment. Dashboards give insight into audit trails, web usage, endpoint inventory and compliance, product and device activity, and threat and DLP detections, helping SOC teams monitor policy compliance, investigate incidents, and correlate activity across hosts, users, and files within Kibana.
To collect data via the REST / Web API, you need the following:
A Trellix ePO On-Prem server with the REST API / Web API enabled.
A Trellix ePO user account with query permissions to the tables that back the data streams you enable, and sufficient role permissions to run queries through the Web API:
Data stream Table(s) auditOrionAuditLog(orOrionAuditLogMTfor multitenant deployments)web_controlWP_EventInfocompliance_historyEpoComplianceHistorysystemEPOLeafNodeproduct_eventEPOProductEventsdevice_eventEEFFDeviceAllEventsViewdlp_incidentUDLP_EPD_Incidentsthreat_eventEPOEventsandEPExtendedEventUsername and password for basic authentication.
The base URL of the Trellix ePO server (default port: 8443, for example
https://epo.example.com:8443).Outbound HTTPS access from the Elastic Agent to the ePO server.
To collect the compliance_history data stream, the Trellix ePO compliance history reporting task must be configured and producing records.
For more information on configuring REST API access in Trellix ePO, refer to the Trellix ePO Web API Scripting Reference Guide.
To collect the event data stream over syslog, you need the following:
- A Trellix ePO On-Prem deployment configured to forward events over syslog.
- A registered syslog server in Trellix ePO that points at the Elastic Agent host and port. To set this up, refer to Register syslog servers in the Trellix ePO documentation.
- Network access from the Trellix ePO server (and any Agent Handlers) to the Elastic Agent over the configured port.
- An Elastic Agent enrolled in Fleet and installed on a host that can receive the forwarded syslog traffic.
The API-based data streams support both Elastic Managed (Agentless) and Agent-based installations. The event data stream is collected over syslog and therefore supports Agent-based installation only.
Elastic Managed integrations allow you to collect data without having to manage Elastic Agent in your cloud. They make manual agent deployment unnecessary, so you can focus on your data instead of the agent that collects it. For more information, refer to Elastic Managed integrations and the Elastic Managed integrations FAQ.
When using this integration as an Elastic Managed integration, only the following data streams are available: Audit Logs, Compliance History, Device Event Logs, DLP Incident Events, Product Event Logs, System Logs, Threat Events, and Web Control Logs. These data streams use inputs compatible with the Elastic Managed deployment mode. Other data streams (Trellix ePO On-Prem event logs) require the TCP input, which is not supported in the Elastic Managed deployment mode. To collect data from these data streams, use Elastic Agent.
Elastic Managed deployments are only supported in Elastic Serverless and Elastic Cloud environments. This functionality is in beta and is subject to change. Beta features are not subject to the support SLA of official GA features.
Elastic Agent must be installed. For more details, check the Elastic Agent installation instructions. You can install only one Elastic Agent per host.
In the top search bar in Kibana, search for Integrations.
In the search bar, type Trellix ePO On-Prem.
Select the Trellix ePO On-Prem integration from the search results.
Select Add Trellix ePO On-Prem to add the integration.
Enable and configure only the collection methods you will use.
- To collect logs over the REST / Web API, set the Trellix ePO URL, Username, and Password, then enable the data streams you need and adjust their parameters (such as interval, initial cursor, and page size) if required.
- To collect the
eventdata stream over syslog, enable the TCP input, set the Listen Address and Listen Port that Trellix ePO will forward to, configure the TLS certificate and key, then configure Trellix ePO to forward events to that host and port. Trellix ePO forwards syslog only over TCP with TLS.
Select Save and continue to save the integration.
- Authentication failures: Ensure the username and password are correct and the user account has not been locked or disabled in Trellix ePO. Verify the account has sufficient permissions to access the required tables.
- Incomplete or missing fields: Confirm that the ePO user account has sufficient permissions to access all fields configured in the integration (the select clause in the CEL template).
- XML payload is not decoded: Confirm that forwarded messages contain an XML
EPOEventpayload and that the complete event is delivered as a single syslog message. - Missing expected threat events: The
threat_eventquery usesEPExtendedEventas its target and collects only events that have matching extended details. - Pagination issues: If a data stream stops advancing beyond the initial set of records, verify that its cursor field is present and increasing in the source table and that the persisted cursor is being updated between polls.
- Missing historical data: If older records are missing after the first collection, lower the initial cursor or increase the initial lookback (for example, Initial Event Auto ID, Initial Auto ID, or Initial Interval) so the first request starts from an earlier point.
For help with Elastic ingest tools, check Common problems.
- In the top search bar in Kibana, search for Dashboards.
- In the search bar, type Trellix ePO On-Prem, and verify the dashboard information is populated.
For more information on architectures that can be used for scaling this integration, check the Ingest Architectures documentation.
- Trellix ePO Web API Scripting Reference Guide
- Trellix ePO Web API Query Language
- Register syslog servers
- Trellix ePO 5.10.0 Product Guide
This is the audit data stream.
Example
{
    "@timestamp": "2026-07-16T08:15:04.000Z",
    "agent": {
        "ephemeral_id": "aa45b205-9fbf-4307-9e33-88620b8dc991",
        "id": "b87ad57f-6cad-4627-9f38-0ad698413315",
        "name": "elastic-agent-99491",
        "type": "filebeat",
        "version": "8.19.0"
    },
    "data_stream": {
        "dataset": "trellix_epo_on_prem.audit",
        "namespace": "87952",
        "type": "logs"
    },
    "ecs": {
        "version": "9.4.0"
    },
    "elastic_agent": {
        "id": "b87ad57f-6cad-4627-9f38-0ad698413315",
        "snapshot": false,
        "version": "8.19.0"
    },
    "event": {
        "action": "delete-user",
        "agent_id_status": "verified",
        "category": [
            "iam"
        ],
        "dataset": "trellix_epo_on_prem.audit",
        "end": "2026-07-16T08:15:05.000Z",
        "id": "1943",
        "ingested": "2026-09-19T04:07:01Z",
        "kind": "event",
        "original": "{\"OrionAuditLog.AutoId\":1943,\"OrionAuditLog.CmdName\":\"Delete user\",\"OrionAuditLog.EndTime\":\"2026-07-16T13:45:05+05:30\",\"OrionAuditLog.Message\":\"User \\\"tempuser\\\" deleted from system\",\"OrionAuditLog.Priority\":3,\"OrionAuditLog.StartTime\":\"2026-07-16T13:45:04+05:30\",\"OrionAuditLog.Success\":true,\"OrionAuditLog.UserId\":1,\"OrionAuditLog.UserName\":\"admin\"}",
        "outcome": "success",
        "start": "2026-07-16T08:15:04.000Z",
        "type": [
            "user",
            "deletion"
        ]
    },
    "input": {
        "type": "cel"
    },
    "message": "User \"tempuser\" deleted from system",
    "related": {
        "user": [
            "1",
            "admin"
        ]
    },
    "tags": [
        "preserve_original_event",
        "forwarded",
        "trellix_epo_on_prem-audit"
    ],
    "trellix_epo_on_prem": {
        "audit": {
            "orion_audit_log": {
                "priority": 3
            }
        }
    },
    "user": {
        "id": "1",
        "name": "admin"
    }
}
Exported fields
| Field | Description | Type |
|---|---|---|
| @timestamp | Date/time when the event originated. This is the date/time extracted from the event, typically representing when the event was generated by the source. If the event source has no original timestamp, this value is typically populated by the first time the event was received by the pipeline. Required field for all events. | date |
| data_stream.dataset | The field can contain anything that makes sense to signify the source of the data. Examples include nginx.access, prometheus, endpoint etc. For data streams that otherwise fit, but that do not have dataset set we use the value "generic" for the dataset value. event.dataset should have the same value as data_stream.dataset. Beyond the Elasticsearch data stream naming criteria noted above, the dataset value has additional restrictions: * Must not contain - * No longer than 100 characters |
constant_keyword |
| data_stream.namespace | A user defined namespace. Namespaces are useful to allow grouping of data. Many users already organize their indices this way, and the data stream naming scheme now provides this best practice as a default. Many users will populate this field with default. If no value is used, it falls back to default. Beyond the Elasticsearch index naming criteria noted above, namespace value has the additional restrictions: * Must not contain - * No longer than 100 characters |
constant_keyword |
| data_stream.type | An overarching type for the data stream. Currently allowed values are "logs" and "metrics". We expect to also add "traces" and "synthetics" in the near future. | constant_keyword |
| event.dataset | Name of the dataset. If an event source publishes more than one type of log or events (e.g. access log, error log), the dataset is used to specify which one the event comes from. It's recommended but not required to start the dataset name with the module name, followed by a dot, then the dataset name. | constant_keyword |
| event.module | Name of the module this data is coming from. If your monitoring agent supports the concept of modules or plugins to process events of a given source (e.g. Apache logs), event.module should contain the name of this module. |
constant_keyword |
| input.type | Type of filebeat input. | keyword |
| observer.product | The product name of the observer. | constant_keyword |
| observer.vendor | Vendor name of the observer. | constant_keyword |
| trellix_epo_on_prem.audit.orion_audit_log.priority | Priority/level assigned to the audit entry (enum, observed values 1, 2, 3). | long |
This is the web_control data stream.
Example
{
    "@timestamp": "2026-09-09T10:49:52.516Z",
    "agent": {
        "ephemeral_id": "f02689c2-5756-4863-b193-3b2b4dc40243",
        "id": "5496bd89-5e42-4d5d-bf54-dbbd19b76ef9",
        "name": "elastic-agent-19132",
        "type": "filebeat",
        "version": "8.19.0"
    },
    "data_stream": {
        "dataset": "trellix_epo_on_prem.web_control",
        "namespace": "18521",
        "type": "logs"
    },
    "ecs": {
        "version": "9.4.0"
    },
    "elastic_agent": {
        "id": "5496bd89-5e42-4d5d-bf54-dbbd19b76ef9",
        "snapshot": false,
        "version": "8.19.0"
    },
    "event": {
        "agent_id_status": "verified",
        "category": [
            "web"
        ],
        "dataset": "trellix_epo_on_prem.web_control",
        "id": "494",
        "ingested": "2026-09-09T10:49:55Z",
        "kind": "event",
        "original": "{\"WP_EventInfo.BadLinkRatingID\":4,\"WP_EventInfo.ContentID\":0,\"WP_EventInfo.Count\":1,\"WP_EventInfo.DomainName\":\"reports.blockedSiteDSSError\",\"WP_EventInfo.DownloadRatingID\":4,\"WP_EventInfo.EventAutoID\":494,\"WP_EventInfo.ExploitRatingID\":4,\"WP_EventInfo.ListID\":1,\"WP_EventInfo.ObserverMode\":true,\"WP_EventInfo.PhishingRatingID\":4,\"WP_EventInfo.PopupRatingID\":4,\"WP_EventInfo.RatingID\":6,\"WP_EventInfo.ReasonID\":7,\"WP_EventInfo.SpamRatingID\":4,\"WP_EventInfo.URL\":\"reports.blockedSiteDSSError\",\"WP_EventInfo.UserName\":null}",
        "type": [
            "access"
        ]
    },
    "input": {
        "type": "cel"
    },
    "tags": [
        "preserve_original_event",
        "forwarded",
        "trellix_epo_on_prem-web_control"
    ],
    "trellix_epo_on_prem": {
        "web_control": {
            "wp_event_info": {
                "bad_link_rating_id": 4,
                "content_id": 0,
                "count": 1,
                "download_rating_id": 4,
                "exploit_rating_id": 4,
                "list_id": 1,
                "observer_mode": true,
                "phishing_rating_id": 4,
                "popup_rating_id": 4,
                "rating_id": 6,
                "reason_id": 7,
                "spam_rating_id": 4
            }
        }
    },
    "url": {
        "domain": "reports.blockedSiteDSSError",
        "original": "reports.blockedSiteDSSError"
    }
}
Exported fields
| Field | Description | Type |
|---|---|---|
| @timestamp | Date/time when the event originated. This is the date/time extracted from the event, typically representing when the event was generated by the source. If the event source has no original timestamp, this value is typically populated by the first time the event was received by the pipeline. Required field for all events. | date |
| data_stream.dataset | The field can contain anything that makes sense to signify the source of the data. Examples include nginx.access, prometheus, endpoint etc. For data streams that otherwise fit, but that do not have dataset set we use the value "generic" for the dataset value. event.dataset should have the same value as data_stream.dataset. Beyond the Elasticsearch data stream naming criteria noted above, the dataset value has additional restrictions: * Must not contain - * No longer than 100 characters |
constant_keyword |
| data_stream.namespace | A user defined namespace. Namespaces are useful to allow grouping of data. Many users already organize their indices this way, and the data stream naming scheme now provides this best practice as a default. Many users will populate this field with default. If no value is used, it falls back to default. Beyond the Elasticsearch index naming criteria noted above, namespace value has the additional restrictions: * Must not contain - * No longer than 100 characters |
constant_keyword |
| data_stream.type | An overarching type for the data stream. Currently allowed values are "logs" and "metrics". We expect to also add "traces" and "synthetics" in the near future. | constant_keyword |
| event.dataset | Name of the dataset. If an event source publishes more than one type of log or events (e.g. access log, error log), the dataset is used to specify which one the event comes from. It's recommended but not required to start the dataset name with the module name, followed by a dot, then the dataset name. | constant_keyword |
| event.module | Name of the module this data is coming from. If your monitoring agent supports the concept of modules or plugins to process events of a given source (e.g. Apache logs), event.module should contain the name of this module. |
constant_keyword |
| input.type | Type of filebeat input. | keyword |
| observer.product | The product name of the observer. | constant_keyword |
| observer.vendor | Vendor name of the observer. | constant_keyword |
| trellix_epo_on_prem.web_control.wp_event_info.action_id | Numeric action identifier associated with the web-control event. | long |
| trellix_epo_on_prem.web_control.wp_event_info.bad_link_rating_id | Numeric identifier for the bad-link rating associated with the event. | long |
| trellix_epo_on_prem.web_control.wp_event_info.content_id | Numeric content identifier associated with the web-control event. | long |
| trellix_epo_on_prem.web_control.wp_event_info.count | Count recorded for the web-control event. | long |
| trellix_epo_on_prem.web_control.wp_event_info.download_rating_id | Numeric identifier for the download rating associated with the event. | long |
| trellix_epo_on_prem.web_control.wp_event_info.exploit_rating_id | Numeric identifier for the exploit rating associated with the event. | long |
| trellix_epo_on_prem.web_control.wp_event_info.list_id | Numeric identifier of a list associated with the web-control event. | long |
| trellix_epo_on_prem.web_control.wp_event_info.observer_mode | Boolean indicating whether observer mode was active for the web-control event. | boolean |
| trellix_epo_on_prem.web_control.wp_event_info.phishing_rating_id | Numeric identifier for the phishing rating associated with the event. | long |
| trellix_epo_on_prem.web_control.wp_event_info.popup_rating_id | Numeric identifier for the pop-up rating associated with the event. | long |
| trellix_epo_on_prem.web_control.wp_event_info.rating_id | Numeric identifier for the overall web-control rating associated with the event. | long |
| trellix_epo_on_prem.web_control.wp_event_info.reason_id | Numeric identifier for the reason associated with the web-control event. | long |
| trellix_epo_on_prem.web_control.wp_event_info.spam_rating_id | Numeric identifier for the spam rating associated with the event. | long |
This is the compliance_history data stream.
Example
{
    "@timestamp": "2026-08-01T19:30:20.000Z",
    "agent": {
        "ephemeral_id": "e09bf811-8402-4ee2-999d-a87b016d2bf6",
        "id": "306c2387-154d-4aff-863d-72ce95d848a5",
        "name": "elastic-agent-88122",
        "type": "filebeat",
        "version": "8.19.0"
    },
    "data_stream": {
        "dataset": "trellix_epo_on_prem.compliance_history",
        "namespace": "58056",
        "type": "logs"
    },
    "ecs": {
        "version": "9.4.0"
    },
    "elastic_agent": {
        "id": "306c2387-154d-4aff-863d-72ce95d848a5",
        "snapshot": false,
        "version": "8.19.0"
    },
    "event": {
        "agent_id_status": "verified",
        "category": [
            "configuration"
        ],
        "dataset": "trellix_epo_on_prem.compliance_history",
        "id": "4",
        "ingested": "2026-09-09T17:01:53Z",
        "kind": "state",
        "original": "{\"EpoComplianceHistory.AutoId\":4,\"EpoComplianceHistory.ChartName\":\"Trellix Agent Compliance Summary\",\"EpoComplianceHistory.CountCompliant\":4,\"EpoComplianceHistory.CountComputers\":5,\"EpoComplianceHistory.CountNonCompliant\":1,\"EpoComplianceHistory.PercentCompliant\":80,\"EpoComplianceHistory.PercentNonCompliant\":20,\"EpoComplianceHistory.TaskName\":\"Generate Records for Trellix Agent Compliance History Reporting\",\"EpoComplianceHistory.TenantId\":0,\"EpoComplianceHistory.TheTimestamp\":\"2026-08-02T01:00:20+05:30\"}",
        "type": [
            "info"
        ]
    },
    "input": {
        "type": "cel"
    },
    "tags": [
        "preserve_original_event",
        "forwarded",
        "trellix_epo_on_prem-compliance_history"
    ],
    "trellix_epo_on_prem": {
        "compliance_history": {
            "epo_compliance_history": {
                "chart_name": "Trellix Agent Compliance Summary",
                "count_compliant": 4,
                "count_computers": 5,
                "count_non_compliant": 1,
                "percent_compliant": 80,
                "percent_non_compliant": 20,
                "task_name": "Generate Records for Trellix Agent Compliance History Reporting",
                "tenant_id": "0"
            }
        }
    }
}
Exported fields
| Field | Description | Type |
|---|---|---|
| @timestamp | Date/time when the event originated. This is the date/time extracted from the event, typically representing when the event was generated by the source. If the event source has no original timestamp, this value is typically populated by the first time the event was received by the pipeline. Required field for all events. | date |
| data_stream.dataset | The field can contain anything that makes sense to signify the source of the data. Examples include nginx.access, prometheus, endpoint etc. For data streams that otherwise fit, but that do not have dataset set we use the value "generic" for the dataset value. event.dataset should have the same value as data_stream.dataset. Beyond the Elasticsearch data stream naming criteria noted above, the dataset value has additional restrictions: * Must not contain - * No longer than 100 characters |
constant_keyword |
| data_stream.namespace | A user defined namespace. Namespaces are useful to allow grouping of data. Many users already organize their indices this way, and the data stream naming scheme now provides this best practice as a default. Many users will populate this field with default. If no value is used, it falls back to default. Beyond the Elasticsearch index naming criteria noted above, namespace value has the additional restrictions: * Must not contain - * No longer than 100 characters |
constant_keyword |
| data_stream.type | An overarching type for the data stream. Currently allowed values are "logs" and "metrics". We expect to also add "traces" and "synthetics" in the near future. | constant_keyword |
| event.dataset | Name of the dataset. If an event source publishes more than one type of log or events (e.g. access log, error log), the dataset is used to specify which one the event comes from. It's recommended but not required to start the dataset name with the module name, followed by a dot, then the dataset name. | constant_keyword |
| event.module | Name of the module this data is coming from. If your monitoring agent supports the concept of modules or plugins to process events of a given source (e.g. Apache logs), event.module should contain the name of this module. |
constant_keyword |
| input.type | Type of Filebeat input. | keyword |
| observer.product | The product name of the observer. | constant_keyword |
| observer.vendor | Vendor name of the observer. | constant_keyword |
| trellix_epo_on_prem.compliance_history.epo_compliance_history.chart_name | Name of the chart that generated the compliance history record. | keyword |
| trellix_epo_on_prem.compliance_history.epo_compliance_history.count_compliant | Number of computers recorded as compliant. | long |
| trellix_epo_on_prem.compliance_history.epo_compliance_history.count_computers | Total number of computers evaluated by the compliance query. | long |
| trellix_epo_on_prem.compliance_history.epo_compliance_history.count_non_compliant | Number of computers recorded as noncompliant. | long |
| trellix_epo_on_prem.compliance_history.epo_compliance_history.percent_compliant | Percentage of evaluated computers recorded as compliant. | double |
| trellix_epo_on_prem.compliance_history.epo_compliance_history.percent_non_compliant | Percentage of evaluated computers recorded as noncompliant. | double |
| trellix_epo_on_prem.compliance_history.epo_compliance_history.task_name | Name of the server task that generated the compliance history record. | keyword |
| trellix_epo_on_prem.compliance_history.epo_compliance_history.tenant_id | Tenant identifier associated with the compliance history record. | keyword |
This is the system data stream.
Example
{
    "@timestamp": "2026-08-03T07:01:28.000Z",
    "agent": {
        "ephemeral_id": "7d640bc0-2497-4ebd-9f2f-1d5719e9d453",
        "id": "6511cef8-1ea9-46d8-9735-7ee6b7637519",
        "name": "elastic-agent-90634",
        "type": "filebeat",
        "version": "8.19.0"
    },
    "data_stream": {
        "dataset": "trellix_epo_on_prem.system",
        "namespace": "43491",
        "type": "logs"
    },
    "ecs": {
        "version": "9.4.0"
    },
    "elastic_agent": {
        "id": "6511cef8-1ea9-46d8-9735-7ee6b7637519",
        "snapshot": false,
        "version": "8.19.0"
    },
    "event": {
        "agent_id_status": "verified",
        "category": [
            "host"
        ],
        "dataset": "trellix_epo_on_prem.system",
        "id": "3",
        "ingested": "2026-09-19T04:10:32Z",
        "kind": "state",
        "original": "{\"EPOLeafNode.AgentGUID\":\"65E387D4-DD78-406F-9765-2A3AAC1DF958\",\"EPOLeafNode.AgentVersion\":\"5.8.6.185\",\"EPOLeafNode.AutoID\":3,\"EPOLeafNode.ExcludedTags\":\"\",\"EPOLeafNode.LastCommSecure\":\"1\",\"EPOLeafNode.LastUpdate\":\"2026-08-03T12:31:28+05:30\",\"EPOLeafNode.ManagedState\":1,\"EPOLeafNode.NodeName\":\"DESKTOP-B9TTHQE\",\"EPOLeafNode.NodePath\":null,\"EPOLeafNode.ParentID\":2,\"EPOLeafNode.SequenceErrorCount\":0,\"EPOLeafNode.SequenceErrorCountLastUpdate\":null,\"EPOLeafNode.ServerKeyHash\":\"zCpCbtDGJO5y9CB7kjIW+lY9lEPxhJhunES4S5Aayao=\",\"EPOLeafNode.Tags\":\"Escalated, Workstation\",\"EPOLeafNode.TenantId\":1,\"EPOLeafNode.TransferSiteListsID\":false,\"EPOLeafNode.Type\":1}",
        "type": [
            "info"
        ]
    },
    "host": {
        "hostname": "DESKTOP-B9TTHQE",
        "name": "desktop-b9tthqe"
    },
    "input": {
        "type": "cel"
    },
    "related": {
        "hosts": [
            "DESKTOP-B9TTHQE"
        ]
    },
    "tags": [
        "preserve_original_event",
        "forwarded",
        "trellix_epo_on_prem-system",
        "Escalated",
        "Workstation"
    ],
    "trellix_epo_on_prem": {
        "system": {
            "epo_leaf_node": {
                "agent_guid": "65E387D4-DD78-406F-9765-2A3AAC1DF958",
                "agent_version": "5.8.6.185",
                "last_comm_secure": "1",
                "managed_state": 1,
                "parent_id": "2",
                "sequence_error_count": 0,
                "server_key_hash": "zCpCbtDGJO5y9CB7kjIW+lY9lEPxhJhunES4S5Aayao=",
                "tenant_id": "1",
                "transfer_site_lists_id": false,
                "type": 1
            }
        }
    }
}
Exported fields
| Field | Description | Type |
|---|---|---|
| @timestamp | Date/time when the event originated. This is the date/time extracted from the event, typically representing when the event was generated by the source. If the event source has no original timestamp, this value is typically populated by the first time the event was received by the pipeline. Required field for all events. | date |
| data_stream.dataset | The field can contain anything that makes sense to signify the source of the data. Examples include nginx.access, prometheus, endpoint etc. For data streams that otherwise fit, but that do not have dataset set we use the value "generic" for the dataset value. event.dataset should have the same value as data_stream.dataset. Beyond the Elasticsearch data stream naming criteria noted above, the dataset value has additional restrictions: * Must not contain - * No longer than 100 characters |
constant_keyword |
| data_stream.namespace | A user defined namespace. Namespaces are useful to allow grouping of data. Many users already organize their indices this way, and the data stream naming scheme now provides this best practice as a default. Many users will populate this field with default. If no value is used, it falls back to default. Beyond the Elasticsearch index naming criteria noted above, namespace value has the additional restrictions: * Must not contain - * No longer than 100 characters |
constant_keyword |
| data_stream.type | An overarching type for the data stream. Currently allowed values are "logs" and "metrics". We expect to also add "traces" and "synthetics" in the near future. | constant_keyword |
| event.dataset | Name of the dataset. If an event source publishes more than one type of log or events (e.g. access log, error log), the dataset is used to specify which one the event comes from. It's recommended but not required to start the dataset name with the module name, followed by a dot, then the dataset name. | constant_keyword |
| event.module | Name of the module this data is coming from. If your monitoring agent supports the concept of modules or plugins to process events of a given source (e.g. Apache logs), event.module should contain the name of this module. |
constant_keyword |
| input.type | Type of filebeat input. | keyword |
| observer.product | The product name of the observer. | constant_keyword |
| observer.vendor | Vendor name of the observer. | constant_keyword |
| trellix_epo_on_prem.system.epo_leaf_node.agent_guid | Globally unique identifier of the Trellix agent installation on the managed system. | keyword |
| trellix_epo_on_prem.system.epo_leaf_node.agent_version | Version string of the managed Trellix agent installed on the system. | keyword |
| trellix_epo_on_prem.system.epo_leaf_node.excluded_tags | Comma-separated tags excluded from the managed system node. | keyword |
| trellix_epo_on_prem.system.epo_leaf_node.last_comm_secure | Code indicating whether the last communication from the system was secure. | keyword |
| trellix_epo_on_prem.system.epo_leaf_node.managed_state | Numeric managed-state code associated with the system node. | long |
| trellix_epo_on_prem.system.epo_leaf_node.node_path | Hierarchical path of the managed system node. | keyword |
| trellix_epo_on_prem.system.epo_leaf_node.parent_id | Identifier of the parent object in the ePO system hierarchy. | keyword |
| trellix_epo_on_prem.system.epo_leaf_node.sequence_error_count | Number of sequence errors recorded for the managed system node. | long |
| trellix_epo_on_prem.system.epo_leaf_node.sequence_error_count_last_update | Date and time when the sequence-error count was last updated. | date |
| trellix_epo_on_prem.system.epo_leaf_node.server_key_hash | Base64-encoded cryptographic hash associated with the ePO server key. | keyword |
| trellix_epo_on_prem.system.epo_leaf_node.tenant_id | Tenant identifier associated with the system node. | keyword |
| trellix_epo_on_prem.system.epo_leaf_node.transfer_site_lists_id | Boolean flag associated with transferring site-list identifiers for the system node. | boolean |
| trellix_epo_on_prem.system.epo_leaf_node.type | Numeric type code assigned to the managed system node. | long |
This is the product_event data stream.
Example
{
    "@timestamp": "2026-07-21T09:23:20.000Z",
    "agent": {
        "ephemeral_id": "d18a339e-9558-45c9-80bd-d4ada7e0a222",
        "id": "a2eaea29-29e9-402b-9b54-78b8b3a0afb5",
        "name": "elastic-agent-58014",
        "type": "filebeat",
        "version": "8.19.0"
    },
    "data_stream": {
        "dataset": "trellix_epo_on_prem.product_event",
        "namespace": "38010",
        "type": "logs"
    },
    "ecs": {
        "version": "9.4.0"
    },
    "elastic_agent": {
        "id": "a2eaea29-29e9-402b-9b54-78b8b3a0afb5",
        "snapshot": false,
        "version": "8.19.0"
    },
    "event": {
        "action": "deployment-successful",
        "agent_id_status": "verified",
        "category": [
            "package"
        ],
        "code": "2411",
        "created": "2026-07-21T09:23:47.000Z",
        "dataset": "trellix_epo_on_prem.product_event",
        "id": "1",
        "ingested": "2026-09-19T04:09:42Z",
        "kind": "event",
        "original": "{\"EPOProductEvents.AgentGUID\":\"89A1D5C1-2B3E-4F67-8A9B-0C1D2E3F4A5B\",\"EPOProductEvents.AutoID\":1,\"EPOProductEvents.DetectedUTC\":\"2026-07-21T14:53:20+05:30\",\"EPOProductEvents.Error\":0,\"EPOProductEvents.ExtraDATNames\":null,\"EPOProductEvents.HostName\":\"HOST-EXAMPLE-02\",\"EPOProductEvents.IPV6\":\"2001:DB8:85A3:0:8A2E:370:7334:1\",\"EPOProductEvents.InitiatorID\":null,\"EPOProductEvents.InitiatorType\":\"CommandLine\",\"EPOProductEvents.Locale\":1033,\"EPOProductEvents.NodeID\":1,\"EPOProductEvents.ProductCode\":\"EPOAGENT3000\",\"EPOProductEvents.ReceivedUTC\":\"2026-07-21T14:53:47+05:30\",\"EPOProductEvents.SPHotFix\":null,\"EPOProductEvents.SiteName\":null,\"EPOProductEvents.TVDEventID\":2411,\"EPOProductEvents.TVDSeverity\":0,\"EPOProductEvents.TenantId\":1,\"EPOProductEvents.Type\":\"Install\",\"EPOProductEvents.UserName\":\"SYSTEM\"}",
        "outcome": "success",
        "severity": 0,
        "type": [
            "installation"
        ]
    },
    "host": {
        "hostname": "HOST-EXAMPLE-02",
        "ip": [
            "2001:DB8:85A3:0:8A2E:370:7334:1"
        ],
        "name": "host-example-02"
    },
    "input": {
        "type": "cel"
    },
    "package": {
        "name": "EPOAGENT3000"
    },
    "related": {
        "hosts": [
            "HOST-EXAMPLE-02"
        ],
        "ip": [
            "2001:DB8:85A3:0:8A2E:370:7334:1"
        ],
        "user": [
            "SYSTEM"
        ]
    },
    "tags": [
        "preserve_original_event",
        "forwarded",
        "trellix_epo_on_prem-product_event"
    ],
    "trellix_epo_on_prem": {
        "product_event": {
            "epo_product_events": {
                "agent_guid": "89A1D5C1-2B3E-4F67-8A9B-0C1D2E3F4A5B",
                "initiator_type": "CommandLine",
                "locale": "1033",
                "node_id": "1",
                "tenant_id": "1",
                "type": "Install"
            }
        }
    },
    "user": {
        "name": "SYSTEM"
    }
}
Exported fields
| Field | Description | Type |
|---|---|---|
| @timestamp | Date/time when the event originated. This is the date/time extracted from the event, typically representing when the event was generated by the source. If the event source has no original timestamp, this value is typically populated by the first time the event was received by the pipeline. Required field for all events. | date |
| data_stream.dataset | The field can contain anything that makes sense to signify the source of the data. Examples include nginx.access, prometheus, endpoint etc. For data streams that otherwise fit, but that do not have dataset set we use the value "generic" for the dataset value. event.dataset should have the same value as data_stream.dataset. Beyond the Elasticsearch data stream naming criteria noted above, the dataset value has additional restrictions: * Must not contain - * No longer than 100 characters |
constant_keyword |
| data_stream.namespace | A user defined namespace. Namespaces are useful to allow grouping of data. Many users already organize their indices this way, and the data stream naming scheme now provides this best practice as a default. Many users will populate this field with default. If no value is used, it falls back to default. Beyond the Elasticsearch index naming criteria noted above, namespace value has the additional restrictions: * Must not contain - * No longer than 100 characters |
constant_keyword |
| data_stream.type | An overarching type for the data stream. Currently allowed values are "logs" and "metrics". We expect to also add "traces" and "synthetics" in the near future. | constant_keyword |
| event.dataset | Name of the dataset. If an event source publishes more than one type of log or events (e.g. access log, error log), the dataset is used to specify which one the event comes from. It's recommended but not required to start the dataset name with the module name, followed by a dot, then the dataset name. | constant_keyword |
| event.module | Name of the module this data is coming from. If your monitoring agent supports the concept of modules or plugins to process events of a given source (e.g. Apache logs), event.module should contain the name of this module. |
constant_keyword |
| input.type | Type of filebeat input. | keyword |
| observer.product | The product name of the observer. | constant_keyword |
| observer.vendor | Vendor name of the observer. | constant_keyword |
| trellix_epo_on_prem.product_event.epo_product_events.agent_guid | GUID of the Trellix Agent installation that reported the event. This identifies the agent instance rather than the endpoint, so it is not mapped to an ECS host or agent identifier. | keyword |
| trellix_epo_on_prem.product_event.epo_product_events.extra_dat_names | Additional DAT names associated with the endpoint product event. | keyword |
| trellix_epo_on_prem.product_event.epo_product_events.initiator_id | Source identifier describing what initiated the product operation. | keyword |
| trellix_epo_on_prem.product_event.epo_product_events.initiator_type | Source classification of the product-operation initiator. | keyword |
| trellix_epo_on_prem.product_event.epo_product_events.locale | Locale identifier associated with the product event. | keyword |
| trellix_epo_on_prem.product_event.epo_product_events.node_id | ePO node identifier associated with the endpoint. | keyword |
| trellix_epo_on_prem.product_event.epo_product_events.site_name | ePO site name associated with the product event. | keyword |
| trellix_epo_on_prem.product_event.epo_product_events.sp_hot_fix | Service-pack hotfix value associated with the product event. | keyword |
| trellix_epo_on_prem.product_event.epo_product_events.tenant_id | Tenant identifier associated with the product event. | keyword |
| trellix_epo_on_prem.product_event.epo_product_events.type | Trellix ePO operation class for the product event, such as Install, Uninstall, Update, AMCore, Policy Enforcement, or Property Collection. Refines the event-code categorization but is not itself an enumerated set. | keyword |
This is the device_event data stream.
Example
{
    "@timestamp": "2026-07-31T08:15:42.000Z",
    "agent": {
        "ephemeral_id": "0f1335b4-7837-4846-8a9c-0a364c968ec8",
        "id": "79a4d8c5-2801-40b0-a754-3ff0166fbf63",
        "name": "elastic-agent-67431",
        "type": "filebeat",
        "version": "8.19.0"
    },
    "data_stream": {
        "dataset": "trellix_epo_on_prem.device_event",
        "namespace": "27293",
        "type": "logs"
    },
    "device": {
        "manufacturer": "Example Vendor",
        "model": {
            "name": "Example Secure USB"
        },
        "serial_number": "EXAMPLE-DEVICE-SN-001"
    },
    "ecs": {
        "version": "9.4.0"
    },
    "elastic_agent": {
        "id": "79a4d8c5-2801-40b0-a754-3ff0166fbf63",
        "snapshot": false,
        "version": "8.19.0"
    },
    "event": {
        "action": "approved",
        "agent_id_status": "verified",
        "category": [
            "host"
        ],
        "code": "3001",
        "created": "2026-07-31T08:16:03.000Z",
        "dataset": "trellix_epo_on_prem.device_event",
        "id": "1048576",
        "ingested": "2026-09-09T10:48:16Z",
        "kind": "event",
        "original": "{\"EEFFDeviceAllEventsView.AgentGUID\":\"11111111-2222-4333-8444-555555555555\",\"EEFFDeviceAllEventsView.AutoID\":1048576,\"EEFFDeviceAllEventsView.BackupSize\":1024.5,\"EEFFDeviceAllEventsView.BackupState\":\"Completed\",\"EEFFDeviceAllEventsView.BackupTime\":18.75,\"EEFFDeviceAllEventsView.CredentialType\":1,\"EEFFDeviceAllEventsView.DeviceSN\":\"EXAMPLE-DEVICE-SN-001\",\"EEFFDeviceAllEventsView.DeviceSize\":64000,\"EEFFDeviceAllEventsView.EventGeneratedTime\":\"2026-07-31T08:15:42.000Z\",\"EEFFDeviceAllEventsView.EventID\":3001,\"EEFFDeviceAllEventsView.EventReportedTime\":\"2026-07-31T08:16:03.000Z\",\"EEFFDeviceAllEventsView.Exempted\":\"No\",\"EEFFDeviceAllEventsView.FileSystem\":\"NTFS\",\"EEFFDeviceAllEventsView.FileSystemVersion\":\"3.1\",\"EEFFDeviceAllEventsView.InitializationState\":\"Initialized\",\"EEFFDeviceAllEventsView.InitializationTime\":12.25,\"EEFFDeviceAllEventsView.Key\":\"example-removable-media-key-001\",\"EEFFDeviceAllEventsView.MediaType\":2,\"EEFFDeviceAllEventsView.ProductName\":\"Example Secure USB\",\"EEFFDeviceAllEventsView.Protected\":\"Yes\",\"EEFFDeviceAllEventsView.ProtectedSize\":62000,\"EEFFDeviceAllEventsView.UserName\":\"EXAMPLE\\\\analyst\",\"EEFFDeviceAllEventsView.UserResponse\":\"Approved\",\"EEFFDeviceAllEventsView.VendorName\":\"Example Vendor\"}",
        "type": [
            "info"
        ]
    },
    "input": {
        "type": "cel"
    },
    "related": {
        "user": [
            "EXAMPLE\\analyst"
        ]
    },
    "tags": [
        "preserve_original_event",
        "forwarded",
        "trellix_epo_on_prem-device_event"
    ],
    "trellix_epo_on_prem": {
        "device_event": {
            "eeff_device_all_events_view": {
                "agent_guid": "11111111-2222-4333-8444-555555555555",
                "backup_size": 1024.5,
                "backup_state": "Completed",
                "backup_time": 18.75,
                "credential_type": "1",
                "device_size": 64000,
                "exempted": "No",
                "file_system": "NTFS",
                "file_system_version": "3.1",
                "initialization_state": "Initialized",
                "initialization_time": 12.25,
                "key": "example-removable-media-key-001",
                "media_type": "2",
                "protected": "Yes",
                "protected_size": 62000
            }
        }
    },
    "user": {
        "name": "EXAMPLE\\analyst"
    }
}
Exported fields
| Field | Description | Type |
|---|---|---|
| @timestamp | Date/time when the event originated. This is the date/time extracted from the event, typically representing when the event was generated by the source. If the event source has no original timestamp, this value is typically populated by the first time the event was received by the pipeline. Required field for all events. | date |
| data_stream.dataset | The field can contain anything that makes sense to signify the source of the data. Examples include nginx.access, prometheus, endpoint etc. For data streams that otherwise fit, but that do not have dataset set we use the value "generic" for the dataset value. event.dataset should have the same value as data_stream.dataset. Beyond the Elasticsearch data stream naming criteria noted above, the dataset value has additional restrictions: * Must not contain - * No longer than 100 characters |
constant_keyword |
| data_stream.namespace | A user defined namespace. Namespaces are useful to allow grouping of data. Many users already organize their indices this way, and the data stream naming scheme now provides this best practice as a default. Many users will populate this field with default. If no value is used, it falls back to default. Beyond the Elasticsearch index naming criteria noted above, namespace value has the additional restrictions: * Must not contain - * No longer than 100 characters |
constant_keyword |
| data_stream.type | An overarching type for the data stream. Currently allowed values are "logs" and "metrics". We expect to also add "traces" and "synthetics" in the near future. | constant_keyword |
| event.dataset | Name of the dataset. If an event source publishes more than one type of log or events (e.g. access log, error log), the dataset is used to specify which one the event comes from. It's recommended but not required to start the dataset name with the module name, followed by a dot, then the dataset name. | constant_keyword |
| event.module | Name of the module this data is coming from. If your monitoring agent supports the concept of modules or plugins to process events of a given source (e.g. Apache logs), event.module should contain the name of this module. |
constant_keyword |
| input.type | Type of filebeat input. | keyword |
| observer.product | The product name of the observer. | constant_keyword |
| observer.vendor | Vendor name of the observer. | constant_keyword |
| trellix_epo_on_prem.device_event.eeff_device_all_events_view.agent_guid | GUID of the Trellix Agent installation that reported the event. This identifies the agent instance rather than the endpoint, so it is not mapped to an ECS host or agent identifier. | keyword |
| trellix_epo_on_prem.device_event.eeff_device_all_events_view.backup_size | Backup size value recorded for the removable-media event. | double |
| trellix_epo_on_prem.device_event.eeff_device_all_events_view.backup_state | Backup state recorded for the removable-media event. | keyword |
| trellix_epo_on_prem.device_event.eeff_device_all_events_view.backup_time | Backup time value recorded for the removable-media event. | double |
| trellix_epo_on_prem.device_event.eeff_device_all_events_view.credential_type | Credential-type identifier associated with the event. | keyword |
| trellix_epo_on_prem.device_event.eeff_device_all_events_view.device_size | Size value recorded for the removable-media device. | double |
| trellix_epo_on_prem.device_event.eeff_device_all_events_view.exempted | Exemption status recorded for the removable-media event. | keyword |
| trellix_epo_on_prem.device_event.eeff_device_all_events_view.file_system | File-system name recorded for the removable-media device. | keyword |
| trellix_epo_on_prem.device_event.eeff_device_all_events_view.file_system_version | Version of the file system recorded for the removable-media device. | keyword |
| trellix_epo_on_prem.device_event.eeff_device_all_events_view.initialization_state | Initialization state recorded for the removable-media device. | keyword |
| trellix_epo_on_prem.device_event.eeff_device_all_events_view.initialization_time | Initialization time value recorded for the removable-media device. | double |
| trellix_epo_on_prem.device_event.eeff_device_all_events_view.key | Key value associated with the removable-media event. | keyword |
| trellix_epo_on_prem.device_event.eeff_device_all_events_view.media_type | Media-type identifier associated with the removable-media device. | keyword |
| trellix_epo_on_prem.device_event.eeff_device_all_events_view.protected | Protection status recorded for the removable-media device. | keyword |
| trellix_epo_on_prem.device_event.eeff_device_all_events_view.protected_size | Protected-size value recorded for the removable-media device. | double |
This is the dlp_incident data stream.
Example
{
    "@timestamp": "2026-01-15T10:00:05.000Z",
    "agent": {
        "ephemeral_id": "b11a0c5d-5e0b-4c7c-a9b1-437f44759b9f",
        "id": "b772c529-e1a8-4660-b1d1-e8dd647ab31f",
        "name": "elastic-agent-82360",
        "type": "filebeat",
        "version": "8.19.0"
    },
    "data_stream": {
        "dataset": "trellix_epo_on_prem.dlp_incident",
        "namespace": "17590",
        "type": "logs"
    },
    "ecs": {
        "version": "9.4.0"
    },
    "elastic_agent": {
        "id": "b772c529-e1a8-4660-b1d1-e8dd647ab31f",
        "snapshot": false,
        "version": "8.19.0"
    },
    "event": {
        "agent_id_status": "verified",
        "category": [
            "intrusion_detection"
        ],
        "code": "1",
        "dataset": "trellix_epo_on_prem.dlp_incident",
        "id": "100006",
        "ingested": "2026-09-09T06:19:10Z",
        "kind": "alert",
        "original": "{\"UDLP_EPD_Incidents.ActualAction\":2,\"UDLP_EPD_Incidents.ClassificationsToDisplay\":\"Restricted Data\",\"UDLP_EPD_Incidents.ConnectivityState\":1,\"UDLP_EPD_Incidents.DlpAgentVersion\":\"11.10.0.456\",\"UDLP_EPD_Incidents.EvidenceCount\":1,\"UDLP_EPD_Incidents.ExpectedAction\":2,\"UDLP_EPD_Incidents.FailureReason\":0,\"UDLP_EPD_Incidents.IncidentId\":100006,\"UDLP_EPD_Incidents.IncidentType\":1,\"UDLP_EPD_Incidents.LastUpdateTimestamp\":\"2026-01-15T15:30:05+05:30\",\"UDLP_EPD_Incidents.McAfeeAgentGuid\":\"89a1d5c1-2b3e-4f67-8a9b-0c1d2e3f4a5b\",\"UDLP_EPD_Incidents.OriginalIncidentId\":100005,\"UDLP_EPD_Incidents.ReportingProduct\":1,\"UDLP_EPD_Incidents.ResolutionId\":0,\"UDLP_EPD_Incidents.Reviewer\":\"reviewer@example.com\",\"UDLP_EPD_Incidents.RuleSetToDisplay\":\"Endpoint DLP Rules\",\"UDLP_EPD_Incidents.RulesToDisplay\":\"Block restricted upload\",\"UDLP_EPD_Incidents.Severity\":2,\"UDLP_EPD_Incidents.ShortMatchString\":\"Sample restricted identifier: ***-**-5678\",\"UDLP_EPD_Incidents.StatusId\":1,\"UDLP_EPD_Incidents.TotalContentSize\":2048,\"UDLP_EPD_Incidents.TotalMatchCount\":1,\"UDLP_EPD_Incidents.ViolationCustomTime\":\"2026-01-15T15:30:05+05:30\",\"UDLP_EPD_Incidents.ViolationLocalTime\":\"2026-01-15T15:30:05+05:30\",\"UDLP_EPD_Incidents.ViolationTimezone\":\"India Standard Time\",\"UDLP_EPD_Incidents.ViolationUTCTime\":\"2026-01-15T10:00:05+05:30\"}",
        "outcome": "success",
        "severity": 2,
        "type": [
            "info"
        ]
    },
    "input": {
        "type": "cel"
    },
    "related": {
        "user": [
            "reviewer@example.com"
        ]
    },
    "rule": {
        "name": "Block restricted upload",
        "ruleset": "Endpoint DLP Rules"
    },
    "tags": [
        "preserve_original_event",
        "forwarded",
        "trellix_epo_on_prem-dlp_incident"
    ],
    "trellix_epo_on_prem": {
        "dlp_incident": {
            "udlp_epd_incidents": {
                "actual_action": "2",
                "classifications_to_display": "Restricted Data",
                "connectivity_state": "1",
                "dlp_agent_version": "11.10.0.456",
                "evidence_count": 1,
                "expected_action": "2",
                "failure_reason": "0",
                "last_update_timestamp": "2026-01-15T10:00:05.000Z",
                "mc_afee_agent_guid": "89a1d5c1-2b3e-4f67-8a9b-0c1d2e3f4a5b",
                "original_incident_id": "100005",
                "reporting_product": "1",
                "resolution_id": "0",
                "short_match_string": "Sample restricted identifier: ***-**-5678",
                "status_id": "1",
                "total_content_size": 2048,
                "total_match_count": 1,
                "violation_custom_time": "2026-01-15T10:00:05.000Z",
                "violation_local_time": "2026-01-15T10:00:05.000Z",
                "violation_timezone": "India Standard Time"
            }
        }
    },
    "user": {
        "domain": "example.com",
        "email": "reviewer@example.com",
        "name": "reviewer"
    }
}
Exported fields
| Field | Description | Type |
|---|---|---|
| @timestamp | Date/time when the event originated. This is the date/time extracted from the event, typically representing when the event was generated by the source. If the event source has no original timestamp, this value is typically populated by the first time the event was received by the pipeline. Required field for all events. | date |
| data_stream.dataset | The field can contain anything that makes sense to signify the source of the data. Examples include nginx.access, prometheus, endpoint etc. For data streams that otherwise fit, but that do not have dataset set we use the value "generic" for the dataset value. event.dataset should have the same value as data_stream.dataset. Beyond the Elasticsearch data stream naming criteria noted above, the dataset value has additional restrictions: * Must not contain - * No longer than 100 characters |
constant_keyword |
| data_stream.namespace | A user defined namespace. Namespaces are useful to allow grouping of data. Many users already organize their indices this way, and the data stream naming scheme now provides this best practice as a default. Many users will populate this field with default. If no value is used, it falls back to default. Beyond the Elasticsearch index naming criteria noted above, namespace value has the additional restrictions: * Must not contain - * No longer than 100 characters |
constant_keyword |
| data_stream.type | An overarching type for the data stream. Currently allowed values are "logs" and "metrics". We expect to also add "traces" and "synthetics" in the near future. | constant_keyword |
| event.dataset | Name of the dataset. If an event source publishes more than one type of log or events (e.g. access log, error log), the dataset is used to specify which one the event comes from. It's recommended but not required to start the dataset name with the module name, followed by a dot, then the dataset name. | constant_keyword |
| event.module | Name of the module this data is coming from. If your monitoring agent supports the concept of modules or plugins to process events of a given source (e.g. Apache logs), event.module should contain the name of this module. |
constant_keyword |
| input.type | Type of Filebeat input. | keyword |
| observer.product | The product name of the observer. | constant_keyword |
| observer.vendor | Vendor name of the observer. | constant_keyword |
| trellix_epo_on_prem.dlp_incident.udlp_epd_incidents.actual_action | Code for the action the endpoint actually took for the DLP incident. | keyword |
| trellix_epo_on_prem.dlp_incident.udlp_epd_incidents.classifications_to_display | Display label for the data classification associated with the DLP incident. | keyword |
| trellix_epo_on_prem.dlp_incident.udlp_epd_incidents.connectivity_state | Connectivity-state code associated with the DLP incident. | keyword |
| trellix_epo_on_prem.dlp_incident.udlp_epd_incidents.dlp_agent_version | Version string of the DLP agent associated with the incident. | keyword |
| trellix_epo_on_prem.dlp_incident.udlp_epd_incidents.evidence_count | Number of evidence items associated with the DLP incident. | long |
| trellix_epo_on_prem.dlp_incident.udlp_epd_incidents.expected_action | Code for the action DLP expected the endpoint to take for the incident. | keyword |
| trellix_epo_on_prem.dlp_incident.udlp_epd_incidents.failure_reason | Failure-reason code for the DLP incident; 0 indicates that nothing failed. | keyword |
| trellix_epo_on_prem.dlp_incident.udlp_epd_incidents.last_update_timestamp | Date and time when the DLP incident record was last updated. | date |
| trellix_epo_on_prem.dlp_incident.udlp_epd_incidents.mc_afee_agent_guid | GUID identifying a McAfee agent associated with the DLP incident. | keyword |
| trellix_epo_on_prem.dlp_incident.udlp_epd_incidents.original_incident_id | Identifier of an original incident related to the current DLP incident. | keyword |
| trellix_epo_on_prem.dlp_incident.udlp_epd_incidents.reporting_product | Identifier of the product that reported the DLP incident. | keyword |
| trellix_epo_on_prem.dlp_incident.udlp_epd_incidents.resolution_id | Identifier of the DLP incident resolution. | keyword |
| trellix_epo_on_prem.dlp_incident.udlp_epd_incidents.short_match_string | Short content excerpt associated with a DLP rule match. | keyword |
| trellix_epo_on_prem.dlp_incident.udlp_epd_incidents.status_id | Identifier of the DLP incident status. | keyword |
| trellix_epo_on_prem.dlp_incident.udlp_epd_incidents.total_content_size | Total content size recorded for the DLP incident. | long |
| trellix_epo_on_prem.dlp_incident.udlp_epd_incidents.total_match_count | Total number of matches recorded for the DLP incident. | long |
| trellix_epo_on_prem.dlp_incident.udlp_epd_incidents.violation_custom_time | Custom date and time representation associated with the DLP violation. | date |
| trellix_epo_on_prem.dlp_incident.udlp_epd_incidents.violation_local_time | Local date and time when the DLP violation occurred. | date |
| trellix_epo_on_prem.dlp_incident.udlp_epd_incidents.violation_timezone | Windows time zone display name of the endpoint where the DLP violation occurred, for example India Standard Time. |
keyword |
This is the threat_event data stream.
Example
{
    "@timestamp": "2026-01-15T10:00:05.000Z",
    "agent": {
        "ephemeral_id": "f002de96-ee65-45c4-a849-7909bc8a1137",
        "id": "8c4cbc1f-bcf6-4225-8f34-b9956ad1ff7d",
        "name": "elastic-agent-31862",
        "type": "filebeat",
        "version": "8.19.0"
    },
    "data_stream": {
        "dataset": "trellix_epo_on_prem.threat_event",
        "namespace": "42995",
        "type": "logs"
    },
    "destination": {
        "ip": [
            "203.0.113.50",
            "0:0:0:0:0:FFFF:CB00:7132"
        ],
        "mac": "00-11-22-33-44-77",
        "port": 80
    },
    "device": {
        "product": {
            "name": "Example Virtual SCSI Disk Device"
        }
    },
    "ecs": {
        "version": "9.4.0"
    },
    "elastic_agent": {
        "id": "8c4cbc1f-bcf6-4225-8f34-b9956ad1ff7d",
        "snapshot": false,
        "version": "8.19.0"
    },
    "event": {
        "agent_id_status": "verified",
        "category": [
            "intrusion_detection"
        ],
        "code": "18063",
        "dataset": "trellix_epo_on_prem.threat_event",
        "id": "11111111-1111-4111-8111-111111111106",
        "ingested": "2026-09-09T06:20:00Z",
        "kind": "alert",
        "original": "{\"EPExtendedEvent.AMCoreContentVersion\":\"1.0.0\",\"EPExtendedEvent.APIName\":\"SyntheticApiCall\",\"EPExtendedEvent.AccessRequested\":\"IDS_AAC_REQ_READ\",\"EPExtendedEvent.AnalyzerContentCreationDate\":\"2026-01-01T00:00:00+00:00\",\"EPExtendedEvent.AnalyzerContentVersion\":\"10.7.0.14078\",\"EPExtendedEvent.AnalyzerGTIQuery\":true,\"EPExtendedEvent.AnalyzerRegInfo\":\"Synthetic analyzer registry context\",\"EPExtendedEvent.AnalyzerRuleID\":\"complete-rule-001\",\"EPExtendedEvent.AnalyzerRuleName\":\"Synthetic complete coverage rule\",\"EPExtendedEvent.AnalyzerTechnologyVersion\":\"10.7.20.14030\",\"EPExtendedEvent.AttackVectorType\":3,\"EPExtendedEvent.BladeName\":\"IDS_BLADE_NAME_FW\",\"EPExtendedEvent.Cleanable\":true,\"EPExtendedEvent.Direction\":1,\"EPExtendedEvent.DurationBeforeDetection\":1200,\"EPExtendedEvent.EventAutoID\":6,\"EPExtendedEvent.FirstActionStatus\":true,\"EPExtendedEvent.FirstAttemptedAction\":\"blocked\",\"EPExtendedEvent.Location\":\"C:\\\\Example\\\\sample.exe\",\"EPExtendedEvent.NaturalLangDescription\":\"Synthetic complete field coverage system-test event\",\"EPExtendedEvent.SecondActionStatus\":false,\"EPExtendedEvent.SecondAttemptedAction\":\"quarantined\",\"EPExtendedEvent.SourceAccessTime\":\"2026-01-15T09:00:00+00:00\",\"EPExtendedEvent.SourceCreateTime\":\"2025-01-01T00:00:00+00:00\",\"EPExtendedEvent.SourceDescription\":\"EXAMPLE AGENT MODULE\",\"EPExtendedEvent.SourceDeviceDisplayName\":\"Example Virtual SCSI Disk Device\",\"EPExtendedEvent.SourceDevicePID\":\"PCI\\\\VEN_8086\\u0026DEV_1234\\u0026SUBSYS_00000000\\u0026REV_01\\\\4\\u0026abc\\u00260\\u002600A8\",\"EPExtendedEvent.SourceDeviceSerialNumber\":\"EXAMPLE-SOURCE-SERIAL-0001\",\"EPExtendedEvent.SourceDeviceVID\":\"PCI\\\\VEN_8086\\u0026DEV_1234\\u0026SUBSYS_00000000\\u0026REV_01\\\\4\\u0026abc\\u00260\\u002600A8\",\"EPExtendedEvent.SourceFilePath\":\"C:\\\\Program Files\\\\ExampleApp\",\"EPExtendedEvent.SourceFileSize\":524288,\"EPExtendedEvent.SourceHash\":\"DEADBEEF0123456789ABCDEFF0123456\",\"EPExtendedEvent.SourceModifyTime\":\"2025-01-01T00:00:00+00:00\",\"EPExtendedEvent.SourceParentProcessHash\":\"FEEDFACE0123456789ABCDEFF0123456\",\"EPExtendedEvent.SourceParentProcessName\":\"example-parent.exe\",\"EPExtendedEvent.SourceParentProcessSigned\":true,\"EPExtendedEvent.SourceParentProcessSigner\":\"C=US, O=Example Corp, CN=Example Publisher\",\"EPExtendedEvent.SourcePort\":52000,\"EPExtendedEvent.SourceProcessHash\":\"F6789012345678901234ABCDEF012345\",\"EPExtendedEvent.SourceProcessSigned\":true,\"EPExtendedEvent.SourceProcessSigner\":\"C=US, O=Example Corp, CN=Example Windows\",\"EPExtendedEvent.SourceShareName\":\"\\\\\\\\source-host.example.com\\\\share\",\"EPExtendedEvent.SourceSigned\":true,\"EPExtendedEvent.SourceSigner\":\"C=US, O=Example Corp, CN=Example Windows\",\"EPExtendedEvent.SourceURLRatingCode\":\"trusted\",\"EPExtendedEvent.SourceURLWebCategory\":\"business\",\"EPExtendedEvent.TargetAccessTime\":\"2026-01-15T09:57:00+00:00\",\"EPExtendedEvent.TargetCreateTime\":\"2025-04-01T08:00:00+00:00\",\"EPExtendedEvent.TargetDescription\":\"Synthetic target description\",\"EPExtendedEvent.TargetDeviceDisplayName\":\"Example Target Device\",\"EPExtendedEvent.TargetDevicePID\":\"DEV_5678\",\"EPExtendedEvent.TargetDeviceSerialNumber\":\"EXAMPLE-TARGET-SERIAL-0001\",\"EPExtendedEvent.TargetDeviceVID\":\"VEN_1234\",\"EPExtendedEvent.TargetFileSize\":102400,\"EPExtendedEvent.TargetHash\":\"6789012345678901234ABCDEF0123456\",\"EPExtendedEvent.TargetModifyTime\":\"2025-04-01T08:00:00+00:00\",\"EPExtendedEvent.TargetName\":\"example-document.pdf\",\"EPExtendedEvent.TargetParentProcessHash\":\"B2C3D4E5F6789012345678901234ABCD\",\"EPExtendedEvent.TargetParentProcessName\":\"parent-app.exe\",\"EPExtendedEvent.TargetParentProcessSigned\":true,\"EPExtendedEvent.TargetParentProcessSigner\":\"C=US, O=Example Corp, CN=Example Code Signing\",\"EPExtendedEvent.TargetPath\":\"C:\\\\Users\\\\Public\",\"EPExtendedEvent.TargetShareName\":\"\\\\\\\\target-host.example.com\\\\share\",\"EPExtendedEvent.TargetSigned\":false,\"EPExtendedEvent.TargetSigner\":\"C=US, O=Example Corp, CN=Example Windows Publisher\",\"EPExtendedEvent.TargetURL\":\"https://target.example.com/resource\",\"EPExtendedEvent.TaskName\":\"Synthetic Scan Task\",\"EPExtendedEvent.ThreatDetectedOnCreation\":true,\"EPExtendedEvent.ThreatImpact\":\"low\",\"EPExtendedEvent.Topic\":\"Synthetic threat topic\",\"EPOEvents.AgentGUID\":\"77777777-8888-4999-8AAA-BBBBBBBBBB07\",\"EPOEvents.Analyzer\":\"ENDP_TEST_1000\",\"EPOEvents.AnalyzerDATVersion\":\"9999.0\",\"EPOEvents.AnalyzerDetectionMethod\":\"Access Protection\",\"EPOEvents.AnalyzerEngineVersion\":\"1.2.3\",\"EPOEvents.AnalyzerHostName\":\"lab-host-complete.example.com\",\"EPOEvents.AnalyzerIPV4\":1177773066,\"EPOEvents.AnalyzerIPV6\":\"0:0:0:0:0:FFFF:C633:640A\",\"EPOEvents.AnalyzerMAC\":\"00aabbccddee\",\"EPOEvents.AnalyzerName\":\"Trellix Endpoint Security\",\"EPOEvents.AnalyzerVersion\":\"10.7.20.14066\",\"EPOEvents.AutoGUID\":\"11111111-1111-4111-8111-111111111106\",\"EPOEvents.AutoID\":6,\"EPOEvents.DetectedUTC\":\"2026-01-15T10:00:05+00:00\",\"EPOEvents.EventTimeLocal\":\"2026-01-15T10:00:05+00:00\",\"EPOEvents.ReceivedUTC\":\"2026-01-15T10:00:05+00:00\",\"EPOEvents.ServerID\":\"epo-server-01.example.com\",\"EPOEvents.SourceHostName\":\"source-host.example.com\",\"EPOEvents.SourceIPV4\":1177773066,\"EPOEvents.SourceIPV6\":\"0:0:0:0:0:FFFF:C633:640A\",\"EPOEvents.SourceMAC\":\"010203040506\",\"EPOEvents.SourceProcessName\":\"example-source-process.exe\",\"EPOEvents.SourceURL\":\"https://source.example.com/path\",\"EPOEvents.SourceUserName\":\"EXAMPLE\\\\source_user\",\"EPOEvents.TargetFileName\":\"C:\\\\Users\\\\Public\\\\example-document.pdf\",\"EPOEvents.TargetHostName\":\"target-host.example.com\",\"EPOEvents.TargetIPV4\":1258320178,\"EPOEvents.TargetIPV6\":\"0:0:0:0:0:FFFF:CB00:7132\",\"EPOEvents.TargetMAC\":\"001122334477\",\"EPOEvents.TargetPort\":80,\"EPOEvents.TargetProcessName\":\"example-target-process.exe\",\"EPOEvents.TargetProtocol\":\"TCP\",\"EPOEvents.TargetUserName\":\"EXAMPLE\\\\target_user\",\"EPOEvents.TenantId\":1,\"EPOEvents.ThreatActionTaken\":\"blocked\",\"EPOEvents.ThreatCategory\":\"hip.process\",\"EPOEvents.ThreatEventID\":18063,\"EPOEvents.ThreatHandled\":true,\"EPOEvents.ThreatName\":\"Synthetic complete system-test event\",\"EPOEvents.ThreatSeverity\":2,\"EPOEvents.ThreatType\":\"IDS_THREAT_TYPE_VALUE_SP\"}",
        "outcome": "success",
        "provider": "Access Protection",
        "reason": "Synthetic complete system-test event",
        "sequence": 6,
        "severity": 2,
        "type": [
            "denied"
        ]
    },
    "file": {
        "accessed": "2026-01-15T09:00:00.000Z",
        "code_signature": {
            "exists": true
        },
        "created": "2025-01-01T00:00:00.000Z",
        "hash": {
            "md5": "DEADBEEF0123456789ABCDEFF0123456"
        },
        "mtime": "2025-01-01T00:00:00.000Z",
        "path": "C:\\Program Files\\ExampleApp",
        "size": 524288
    },
    "host": {
        "hostname": "lab-host-complete.example.com",
        "ip": [
            "198.51.100.10",
            "0:0:0:0:0:FFFF:C633:640A"
        ],
        "mac": [
            "00-AA-BB-CC-DD-EE"
        ],
        "target": {
            "hostname": "target-host.example.com"
        }
    },
    "input": {
        "type": "cel"
    },
    "message": "Synthetic complete field coverage system-test event",
    "network": {
        "transport": "tcp"
    },
    "observer": {
        "hostname": "lab-host-complete.example.com",
        "ip": [
            "198.51.100.10",
            "0:0:0:0:0:FFFF:C633:640A"
        ],
        "mac": [
            "00-AA-BB-CC-DD-EE"
        ],
        "product": "Trellix Endpoint Security",
        "version": "10.7.20.14066"
    },
    "process": {
        "code_signature": {
            "exists": true,
            "subject_name": "C=US, O=Example Corp, CN=Example Windows"
        },
        "hash": {
            "md5": "F6789012345678901234ABCDEF012345"
        },
        "name": "example-source-process.exe",
        "parent": {
            "code_signature": {
                "exists": true,
                "subject_name": "C=US, O=Example Corp, CN=Example Publisher"
            },
            "hash": {
                "md5": "FEEDFACE0123456789ABCDEFF0123456"
            },
            "name": "example-parent.exe"
        }
    },
    "related": {
        "hash": [
            "F6789012345678901234ABCDEF012345",
            "6789012345678901234ABCDEF0123456",
            "B2C3D4E5F6789012345678901234ABCD",
            "DEADBEEF0123456789ABCDEFF0123456",
            "FEEDFACE0123456789ABCDEFF0123456"
        ],
        "hosts": [
            "lab-host-complete.example.com",
            "epo-server-01.example.com",
            "target-host.example.com",
            "source-host.example.com"
        ],
        "ip": [
            "198.51.100.10",
            "0:0:0:0:0:FFFF:C633:640A",
            "203.0.113.50",
            "0:0:0:0:0:FFFF:CB00:7132"
        ],
        "user": [
            "EXAMPLE\\source_user",
            "EXAMPLE\\target_user"
        ]
    },
    "rule": {
        "id": "complete-rule-001",
        "name": "Synthetic complete coverage rule",
        "version": "10.7.0.14078"
    },
    "source": {
        "ip": [
            "198.51.100.10",
            "0:0:0:0:0:FFFF:C633:640A"
        ],
        "mac": "01-02-03-04-05-06",
        "port": 52000
    },
    "tags": [
        "preserve_original_event",
        "forwarded",
        "trellix_epo_on_prem-threat_event"
    ],
    "threat": {
        "indicator": {
            "file": {
                "accessed": "2026-01-15T09:57:00.000Z",
                "code_signature": {
                    "exists": false,
                    "subject_name": "C=US, O=Example Corp, CN=Example Windows Publisher"
                },
                "created": "2025-04-01T08:00:00.000Z",
                "directory": "C:\\Users\\Public",
                "hash": {
                    "md5": "6789012345678901234ABCDEF0123456"
                },
                "mtime": "2025-04-01T08:00:00.000Z",
                "name": "example-document.pdf",
                "path": "C:\\Users\\Public\\example-document.pdf",
                "size": 102400
            }
        }
    },
    "trellix_epo_on_prem": {
        "threat_event": {
            "ep_extended_event": {
                "access_requested": "IDS_AAC_REQ_READ",
                "am_core_content_version": "1.0.0",
                "analyzer_content_creation_date": "2026-01-01T00:00:00.000Z",
                "analyzer_gti_query": true,
                "analyzer_reg_info": "Synthetic analyzer registry context",
                "analyzer_technology_version": "10.7.20.14030",
                "api_name": "SyntheticApiCall",
                "attack_vector_type": "3",
                "blade_name": "IDS_BLADE_NAME_FW",
                "cleanable": true,
                "direction": "1",
                "duration_before_detection": 1200,
                "event_auto_id": "6",
                "first_action_status": true,
                "first_attempted_action": "blocked",
                "location": "C:\\Example\\sample.exe",
                "second_action_status": false,
                "second_attempted_action": "quarantined",
                "source_description": "EXAMPLE AGENT MODULE",
                "source_device_pid": "PCI\\VEN_8086&DEV_1234&SUBSYS_00000000&REV_01\\4&abc&0&00A8",
                "source_device_serial_number": "EXAMPLE-SOURCE-SERIAL-0001",
                "source_device_vid": "PCI\\VEN_8086&DEV_1234&SUBSYS_00000000&REV_01\\4&abc&0&00A8",
                "source_share_name": "\\\\source-host.example.com\\share",
                "source_url_rating_code": "trusted",
                "source_url_web_category": "business",
                "target_description": "Synthetic target description",
                "target_device_display_name": "Example Target Device",
                "target_device_pid": "DEV_5678",
                "target_device_serial_number": "EXAMPLE-TARGET-SERIAL-0001",
                "target_device_vid": "VEN_1234",
                "target_parent_process_hash": "B2C3D4E5F6789012345678901234ABCD",
                "target_parent_process_name": "parent-app.exe",
                "target_parent_process_signed": true,
                "target_parent_process_signer": "C=US, O=Example Corp, CN=Example Code Signing",
                "target_share_name": "\\\\target-host.example.com\\share",
                "target_url": "https://target.example.com/resource",
                "task_name": "Synthetic Scan Task",
                "threat_detected_on_creation": true,
                "threat_impact": "low",
                "topic": "Synthetic threat topic"
            },
            "epo_events": {
                "agent_guid": "77777777-8888-4999-8AAA-BBBBBBBBBB07",
                "analyzer": "ENDP_TEST_1000",
                "analyzer_dat_version": "9999.0",
                "analyzer_engine_version": "1.2.3",
                "detected_utc": "2026-01-15T10:00:05.000Z",
                "event_time_local": "2026-01-15T10:00:05.000Z",
                "server_id": "epo-server-01.example.com",
                "source_host_name": "source-host.example.com",
                "source_url": "https://source.example.com/path",
                "target_process_name": "example-target-process.exe",
                "tenant_id": "1",
                "threat_action_taken": "blocked",
                "threat_category": "hip.process",
                "threat_handled": true,
                "threat_type": "IDS_THREAT_TYPE_VALUE_SP"
            }
        }
    },
    "user": {
        "name": "EXAMPLE\\source_user",
        "target": {
            "name": "EXAMPLE\\target_user"
        }
    }
}
Exported fields
| Field | Description | Type |
|---|---|---|
| @timestamp | Date/time when the event originated. This is the date/time extracted from the event, typically representing when the event was generated by the source. If the event source has no original timestamp, this value is typically populated by the first time the event was received by the pipeline. Required field for all events. | date |
| data_stream.dataset | The field can contain anything that makes sense to signify the source of the data. Examples include nginx.access, prometheus, endpoint etc. For data streams that otherwise fit, but that do not have dataset set we use the value "generic" for the dataset value. event.dataset should have the same value as data_stream.dataset. Beyond the Elasticsearch data stream naming criteria noted above, the dataset value has additional restrictions: * Must not contain - * No longer than 100 characters |
constant_keyword |
| data_stream.namespace | A user defined namespace. Namespaces are useful to allow grouping of data. Many users already organize their indices this way, and the data stream naming scheme now provides this best practice as a default. Many users will populate this field with default. If no value is used, it falls back to default. Beyond the Elasticsearch index naming criteria noted above, namespace value has the additional restrictions: * Must not contain - * No longer than 100 characters |
constant_keyword |
| data_stream.type | An overarching type for the data stream. Currently allowed values are "logs" and "metrics". We expect to also add "traces" and "synthetics" in the near future. | constant_keyword |
| event.dataset | Name of the dataset. If an event source publishes more than one type of log or events (e.g. access log, error log), the dataset is used to specify which one the event comes from. It's recommended but not required to start the dataset name with the module name, followed by a dot, then the dataset name. | constant_keyword |
| event.module | Name of the module this data is coming from. If your monitoring agent supports the concept of modules or plugins to process events of a given source (e.g. Apache logs), event.module should contain the name of this module. |
constant_keyword |
| input.type | Type of filebeat input. | keyword |
| observer.vendor | Vendor name of the observer. | constant_keyword |
| trellix_epo_on_prem.threat_event.ep_extended_event.access_requested | Access Requested value recorded in the extended threat-event details. | keyword |
| trellix_epo_on_prem.threat_event.ep_extended_event.am_core_content_version | AM Core Content Version value recorded in the extended threat-event details. | keyword |
| trellix_epo_on_prem.threat_event.ep_extended_event.analyzer_content_creation_date | Analyzer Content Creation Date value recorded in the extended threat-event details. | date |
| trellix_epo_on_prem.threat_event.ep_extended_event.analyzer_gti_query | Analyzer GTI Query value recorded in the extended threat-event details. | boolean |
| trellix_epo_on_prem.threat_event.ep_extended_event.analyzer_reg_info | Analyzer Reg Info value recorded in the extended threat-event details. | keyword |
| trellix_epo_on_prem.threat_event.ep_extended_event.analyzer_technology_version | Analyzer Technology Version value recorded in the extended threat-event details. | keyword |
| trellix_epo_on_prem.threat_event.ep_extended_event.api_name | API Name value recorded in the extended threat-event details. | keyword |
| trellix_epo_on_prem.threat_event.ep_extended_event.attack_vector_type | Attack Vector Type value recorded in the extended threat-event details. | keyword |
| trellix_epo_on_prem.threat_event.ep_extended_event.blade_name | Blade Name value recorded in the extended threat-event details. | keyword |
| trellix_epo_on_prem.threat_event.ep_extended_event.cleanable | Cleanable value recorded in the extended threat-event details. | boolean |
| trellix_epo_on_prem.threat_event.ep_extended_event.direction | Direction value recorded in the extended threat-event details. | keyword |
| trellix_epo_on_prem.threat_event.ep_extended_event.duration_before_detection | Duration Before Detection value recorded in the extended threat-event details. | long |
| trellix_epo_on_prem.threat_event.ep_extended_event.event_auto_id | Event Auto ID value recorded in the extended threat-event details. | keyword |
| trellix_epo_on_prem.threat_event.ep_extended_event.first_action_status | First Action Status value recorded in the extended threat-event details. | boolean |
| trellix_epo_on_prem.threat_event.ep_extended_event.first_attempted_action | First Attempted Action value recorded in the extended threat-event details. | keyword |
| trellix_epo_on_prem.threat_event.ep_extended_event.location | Location value recorded in the extended threat-event details. | keyword |
| trellix_epo_on_prem.threat_event.ep_extended_event.second_action_status | Second Action Status value recorded in the extended threat-event details. | boolean |
| trellix_epo_on_prem.threat_event.ep_extended_event.second_attempted_action | Second Attempted Action value recorded in the extended threat-event details. | keyword |
| trellix_epo_on_prem.threat_event.ep_extended_event.source_description | Source Description value recorded in the extended threat-event details. | keyword |
| trellix_epo_on_prem.threat_event.ep_extended_event.source_device_pid | Source Device PID value recorded in the extended threat-event details. | keyword |
| trellix_epo_on_prem.threat_event.ep_extended_event.source_device_serial_number | Source Device Serial Number value recorded in the extended threat-event details. | keyword |
| trellix_epo_on_prem.threat_event.ep_extended_event.source_device_vid | Source Device VID value recorded in the extended threat-event details. | keyword |
| trellix_epo_on_prem.threat_event.ep_extended_event.source_hash | Source Hash value recorded in the extended threat-event details. | keyword |
| trellix_epo_on_prem.threat_event.ep_extended_event.source_share_name | Source Share Name value recorded in the extended threat-event details. | keyword |
| trellix_epo_on_prem.threat_event.ep_extended_event.source_url_rating_code | Source URL Rating Code value recorded in the extended threat-event details. | keyword |
| trellix_epo_on_prem.threat_event.ep_extended_event.source_url_web_category | Source URL Web Category value recorded in the extended threat-event details. | keyword |
| trellix_epo_on_prem.threat_event.ep_extended_event.target_create_time | Target Create Time value recorded in the extended threat-event details. | date |
| trellix_epo_on_prem.threat_event.ep_extended_event.target_description | Target Description value recorded in the extended threat-event details. | keyword |
| trellix_epo_on_prem.threat_event.ep_extended_event.target_device_display_name | Target Device Display Name value recorded in the extended threat-event details. | keyword |
| trellix_epo_on_prem.threat_event.ep_extended_event.target_device_pid | Target Device PID value recorded in the extended threat-event details. | keyword |
| trellix_epo_on_prem.threat_event.ep_extended_event.target_device_serial_number | Target Device Serial Number value recorded in the extended threat-event details. | keyword |
| trellix_epo_on_prem.threat_event.ep_extended_event.target_device_vid | Target Device VID value recorded in the extended threat-event details. | keyword |
| trellix_epo_on_prem.threat_event.ep_extended_event.target_modify_time | Target Modify Time value recorded in the extended threat-event details. | date |
| trellix_epo_on_prem.threat_event.ep_extended_event.target_parent_process_hash | Target Parent Process Hash value recorded in the extended threat-event details. | keyword |
| trellix_epo_on_prem.threat_event.ep_extended_event.target_parent_process_name | Target Parent Process Name value recorded in the extended threat-event details. | keyword |
| trellix_epo_on_prem.threat_event.ep_extended_event.target_parent_process_signed | Target Parent Process Signed value recorded in the extended threat-event details. | boolean |
| trellix_epo_on_prem.threat_event.ep_extended_event.target_parent_process_signer | Target Parent Process Signer value recorded in the extended threat-event details. | keyword |
| trellix_epo_on_prem.threat_event.ep_extended_event.target_share_name | Target Share Name value recorded in the extended threat-event details. | keyword |
| trellix_epo_on_prem.threat_event.ep_extended_event.target_url | Target URL value recorded in the extended threat-event details. | keyword |
| trellix_epo_on_prem.threat_event.ep_extended_event.task_name | Task Name value recorded in the extended threat-event details. | keyword |
| trellix_epo_on_prem.threat_event.ep_extended_event.threat_detected_on_creation | Threat Detected On Creation value recorded in the extended threat-event details. | boolean |
| trellix_epo_on_prem.threat_event.ep_extended_event.threat_impact | Threat Impact value recorded in the extended threat-event details. | keyword |
| trellix_epo_on_prem.threat_event.ep_extended_event.topic | Topic value recorded in the extended threat-event details. | keyword |
| trellix_epo_on_prem.threat_event.epo_events.agent_guid | Agent GUID value recorded in the ePO threat event. | keyword |
| trellix_epo_on_prem.threat_event.epo_events.analyzer | Analyzer value recorded in the ePO threat event. | keyword |
| trellix_epo_on_prem.threat_event.epo_events.analyzer_dat_version | Analyzer DAT Version value recorded in the ePO threat event. | keyword |
| trellix_epo_on_prem.threat_event.epo_events.analyzer_engine_version | Analyzer Engine Version value recorded in the ePO threat event. | keyword |
| trellix_epo_on_prem.threat_event.epo_events.detected_utc | Detection time recorded in the ePO threat event. | date |
| trellix_epo_on_prem.threat_event.epo_events.event_time_local | Event Time Local value recorded in the ePO threat event. | date |
| trellix_epo_on_prem.threat_event.epo_events.server_id | Server ID value recorded in the ePO threat event. | keyword |
| trellix_epo_on_prem.threat_event.epo_events.source_host_name | Source Host Name value recorded in the ePO threat event. | keyword |
| trellix_epo_on_prem.threat_event.epo_events.source_url | Source URL value recorded in the ePO threat event. | keyword |
| trellix_epo_on_prem.threat_event.epo_events.target_process_name | Target Process Name value recorded in the ePO threat event. | keyword |
| trellix_epo_on_prem.threat_event.epo_events.tenant_id | Tenant ID value recorded in the ePO threat event. | keyword |
| trellix_epo_on_prem.threat_event.epo_events.threat_action_taken | Threat Action Taken value recorded in the ePO threat event. | keyword |
| trellix_epo_on_prem.threat_event.epo_events.threat_category | Trellix threat-category identifier used to classify the event variant. | keyword |
| trellix_epo_on_prem.threat_event.epo_events.threat_handled | Threat Handled value recorded in the ePO threat event. | boolean |
| trellix_epo_on_prem.threat_event.epo_events.threat_type | Trellix threat-type identifier used as the primary event variant discriminator. | keyword |
This is the event data stream.
Example
{
    "@timestamp": "2018-06-29T10:53:33.000Z",
    "agent": {
        "ephemeral_id": "9c7de2ee-e912-4ce3-9b95-ede8e1724ff2",
        "id": "6865871b-95fc-4a75-b9fc-15eb2ece2127",
        "name": "elastic-agent-97787",
        "type": "filebeat",
        "version": "8.19.0"
    },
    "data_stream": {
        "dataset": "trellix_epo_on_prem.event",
        "namespace": "23613",
        "type": "logs"
    },
    "ecs": {
        "version": "9.4.0"
    },
    "elastic_agent": {
        "id": "6865871b-95fc-4a75-b9fc-15eb2ece2127",
        "snapshot": false,
        "version": "8.19.0"
    },
    "event": {
        "action": "infected-file-deleted",
        "agent_id_status": "verified",
        "category": [
            "malware",
            "file"
        ],
        "code": "1027",
        "dataset": "trellix_epo_on_prem.event",
        "ingested": "2026-09-19T04:24:26Z",
        "kind": "alert",
        "outcome": "success",
        "severity": 2,
        "type": [
            "deletion"
        ]
    },
    "file": {
        "directory": "c:\\Program Files\\QRadar_v2\\Desktop",
        "hash": {
            "md5": "ed066136978a05009cf30c35de92e08e"
        },
        "name": "91",
        "size": 70
    },
    "host": {
        "ip": [
            "203.0.113.30"
        ],
        "mac": [
            "00-50-56-AF-C7-47"
        ],
        "name": "epo-server.example.local",
        "os": {
            "name": "Windows Server 2012 R2"
        }
    },
    "input": {
        "type": "tcp"
    },
    "log": {
        "source": {
            "address": "172.19.0.3:41824"
        },
        "syslog": {
            "appname": "EPOEvents",
            "facility": {
                "code": 3,
                "name": "system"
            },
            "hostname": "epo-server.example.local",
            "msgid": "EventFwd",
            "priority": 29,
            "severity": {
                "code": 5,
                "name": "Notice"
            },
            "version": "1"
        }
    },
    "observer": {
        "hostname": "epo-server.example.local"
    },
    "process": {
        "executable": "c:\\Program Files\\QRadar\\file1.ext"
    },
    "related": {
        "hash": [
            "ed066136978a05009cf30c35de92e08e"
        ],
        "hosts": [
            "epo-server.example.local"
        ],
        "ip": [
            "203.0.113.30"
        ],
        "user": [
            "SYSTEM",
            "domain\\admin"
        ]
    },
    "rule": {
        "category": "av.detect"
    },
    "tags": [
        "forwarded",
        "trellix_epo_on_prem-event"
    ],
    "threat": {
        "software": {
            "name": "Elspy.worm"
        }
    },
    "trellix_epo_on_prem": {
        "event": {
            "epo_event": {
                "machine_info": {
                    "agent_guid": "{890cc45c-7b89-11e8-1cd6-005056afc747}",
                    "time_zone_bias": -330
                },
                "software_info": {
                    "common_fields": {
                        "analyzer": "ENDP_AM_1060",
                        "analyzer_dat_version": "3389.0",
                        "analyzer_detection_method": "On-Access Scan",
                        "analyzer_engine_version": "5900.7806",
                        "analyzer_name": "McAfee Endpoint Security",
                        "analyzer_version": "10.6.0"
                    },
                    "event": {
                        "common_fields": {
                            "detected_utc": "2018-06-29T10:52:58.000Z",
                            "threat_event_id": "1027",
                            "threat_handled": true,
                            "threat_severity": 2,
                            "threat_type": "virus"
                        },
                        "custom_fields": {
                            "analyzer_content_creation_date": "2018-06-28T02:04:00.000Z",
                            "blade_name": "IDS_BLADE_NAME_SPB",
                            "target": "EPExtendedEventMT",
                            "threat_detected_on_creation": true
                        },
                        "gmt_time": "2018-06-29T10:52:58.000Z",
                        "severity": 3
                    },
                    "product_family": "TVD",
                    "product_name": "McAfee Endpoint Security",
                    "product_version": "10.6.0"
                }
            }
        }
    },
    "user": {
        "name": "SYSTEM",
        "target": {
            "domain": "domain",
            "name": "admin"
        }
    }
}
Exported fields
| Field | Description | Type | Unit |
|---|---|---|---|
| @timestamp | Date/time when the event originated. This is the date/time extracted from the event, typically representing when the event was generated by the source. If the event source has no original timestamp, this value is typically populated by the first time the event was received by the pipeline. Required field for all events. | date | |
| data_stream.dataset | The field can contain anything that makes sense to signify the source of the data. Examples include nginx.access, prometheus, endpoint etc. For data streams that otherwise fit, but that do not have dataset set we use the value "generic" for the dataset value. event.dataset should have the same value as data_stream.dataset. Beyond the Elasticsearch data stream naming criteria noted above, the dataset value has additional restrictions: * Must not contain - * No longer than 100 characters |
constant_keyword | |
| data_stream.namespace | A user defined namespace. Namespaces are useful to allow grouping of data. Many users already organize their indices this way, and the data stream naming scheme now provides this best practice as a default. Many users will populate this field with default. If no value is used, it falls back to default. Beyond the Elasticsearch index naming criteria noted above, namespace value has the additional restrictions: * Must not contain - * No longer than 100 characters |
constant_keyword | |
| data_stream.type | An overarching type for the data stream. Currently allowed values are "logs" and "metrics". We expect to also add "traces" and "synthetics" in the near future. | constant_keyword | |
| event.dataset | Name of the dataset. If an event source publishes more than one type of log or events (e.g. access log, error log), the dataset is used to specify which one the event comes from. It's recommended but not required to start the dataset name with the module name, followed by a dot, then the dataset name. | constant_keyword | |
| event.module | Name of the module this data is coming from. If your monitoring agent supports the concept of modules or plugins to process events of a given source (e.g. Apache logs), event.module should contain the name of this module. |
constant_keyword | |
| input.type | Type of filebeat input. | keyword | |
| log.offset | Log offset. | long | |
| log.source.address | Source address from which the log event was read / sent from. | keyword | |
| observer.product | The product name of the observer. | constant_keyword | |
| observer.vendor | Vendor name of the observer. | constant_keyword | |
| trellix_epo_on_prem.event.epo_event.access_requested | keyword | ||
| trellix_epo_on_prem.event.epo_event.action_id | keyword | ||
| trellix_epo_on_prem.event.epo_event.agent_guid | keyword | ||
| trellix_epo_on_prem.event.epo_event.analyzer | keyword | ||
| trellix_epo_on_prem.event.epo_event.analyzer_dat_version | keyword | ||
| trellix_epo_on_prem.event.epo_event.analyzer_detection_method | keyword | ||
| trellix_epo_on_prem.event.epo_event.analyzer_engine_version | keyword | ||
| trellix_epo_on_prem.event.epo_event.analyzer_gti_query | boolean | ||
| trellix_epo_on_prem.event.epo_event.analyzer_name | Name of the product that detected the threat. | keyword | |
| trellix_epo_on_prem.event.epo_event.analyzer_version | Version of the detecting product. | keyword | |
| trellix_epo_on_prem.event.epo_event.api_name | keyword | ||
| trellix_epo_on_prem.event.epo_event.attack_vector_type | keyword | ||
| trellix_epo_on_prem.event.epo_event.bad_link_rating_id | keyword | ||
| trellix_epo_on_prem.event.epo_event.blade_name | keyword | ||
| trellix_epo_on_prem.event.epo_event.cleanable | boolean | ||
| trellix_epo_on_prem.event.epo_event.content_func_group | keyword | ||
| trellix_epo_on_prem.event.epo_event.content_name | keyword | ||
| trellix_epo_on_prem.event.epo_event.content_risk_group | keyword | ||
| trellix_epo_on_prem.event.epo_event.count | long | ||
| trellix_epo_on_prem.event.epo_event.dat_version | keyword | ||
| trellix_epo_on_prem.event.epo_event.detected_utc | Detection time in UTC. | date | |
| trellix_epo_on_prem.event.epo_event.detection_method | keyword | ||
| trellix_epo_on_prem.event.epo_event.detection_time | date | ||
| trellix_epo_on_prem.event.epo_event.direction | keyword | ||
| trellix_epo_on_prem.event.epo_event.download_rating_id | keyword | ||
| trellix_epo_on_prem.event.epo_event.duration_before_detection | long | ||
| trellix_epo_on_prem.event.epo_event.event_type | keyword | ||
| trellix_epo_on_prem.event.epo_event.exploit_rating_id | keyword | ||
| trellix_epo_on_prem.event.epo_event.files | keyword | ||
| trellix_epo_on_prem.event.epo_event.first_action_status | boolean | ||
| trellix_epo_on_prem.event.epo_event.first_attempted_action | keyword | ||
| trellix_epo_on_prem.event.epo_event.hostname | keyword | ||
| trellix_epo_on_prem.event.epo_event.jti_object_type | keyword | ||
| trellix_epo_on_prem.event.epo_event.jti_reputation | keyword | ||
| trellix_epo_on_prem.event.epo_event.list_id | keyword | ||
| trellix_epo_on_prem.event.epo_event.list_type | keyword | ||
| trellix_epo_on_prem.event.epo_event.local_reputation | keyword | ||
| trellix_epo_on_prem.event.epo_event.machine_info.agent_guid | keyword | ||
| trellix_epo_on_prem.event.epo_event.machine_info.time_zone_bias | long | ||
| trellix_epo_on_prem.event.epo_event.new_reputations.trust_level | keyword | ||
| trellix_epo_on_prem.event.epo_event.observer_mode | keyword | ||
| trellix_epo_on_prem.event.epo_event.old_reputations.trust_level | keyword | ||
| trellix_epo_on_prem.event.epo_event.phishing_rating_id | keyword | ||
| trellix_epo_on_prem.event.epo_event.popup_rating_id | keyword | ||
| trellix_epo_on_prem.event.epo_event.priority | long | ||
| trellix_epo_on_prem.event.epo_event.product_family | keyword | ||
| trellix_epo_on_prem.event.epo_event.rating | keyword | ||
| trellix_epo_on_prem.event.epo_event.reason_id | keyword | ||
| trellix_epo_on_prem.event.epo_event.reason_type | keyword | ||
| trellix_epo_on_prem.event.epo_event.received_utc | Time the event was received by the ePO server. | date | |
| trellix_epo_on_prem.event.epo_event.registry_value | keyword | ||
| trellix_epo_on_prem.event.epo_event.remediation_action | keyword | ||
| trellix_epo_on_prem.event.epo_event.second_action_status | boolean | ||
| trellix_epo_on_prem.event.epo_event.second_attempted_action | keyword | ||
| trellix_epo_on_prem.event.epo_event.server_id | keyword | ||
| trellix_epo_on_prem.event.epo_event.siem_last_time | date | ||
| trellix_epo_on_prem.event.epo_event.signature_name | keyword | ||
| trellix_epo_on_prem.event.epo_event.site_name | keyword | ||
| trellix_epo_on_prem.event.epo_event.software_info.common_fields.analyzer | keyword | ||
| trellix_epo_on_prem.event.epo_event.software_info.common_fields.analyzer_dat_version | keyword | ||
| trellix_epo_on_prem.event.epo_event.software_info.common_fields.analyzer_detection_method | keyword | ||
| trellix_epo_on_prem.event.epo_event.software_info.common_fields.analyzer_engine_version | keyword | ||
| trellix_epo_on_prem.event.epo_event.software_info.common_fields.analyzer_name | Name of the product that detected the threat. | keyword | |
| trellix_epo_on_prem.event.epo_event.software_info.common_fields.analyzer_version | Version of the detecting product. | keyword | |
| trellix_epo_on_prem.event.epo_event.software_info.event.common_fields.detected_utc | Detection time in UTC. | date | |
| trellix_epo_on_prem.event.epo_event.software_info.event.common_fields.threat_event_id | keyword | ||
| trellix_epo_on_prem.event.epo_event.software_info.event.common_fields.threat_handled | boolean | ||
| trellix_epo_on_prem.event.epo_event.software_info.event.common_fields.threat_severity | Severity level of the threat. | long | |
| trellix_epo_on_prem.event.epo_event.software_info.event.common_fields.threat_type | Type of threat (for example, virus, trojan, or PUP). | keyword | |
| trellix_epo_on_prem.event.epo_event.software_info.event.custom_fields.analyzer_content_creation_date | date | ||
| trellix_epo_on_prem.event.epo_event.software_info.event.custom_fields.blade_name | keyword | ||
| trellix_epo_on_prem.event.epo_event.software_info.event.custom_fields.target | keyword | ||
| trellix_epo_on_prem.event.epo_event.software_info.event.custom_fields.threat_detected_on_creation | boolean | ||
| trellix_epo_on_prem.event.epo_event.software_info.event.gmt_time | date | ||
| trellix_epo_on_prem.event.epo_event.software_info.event.severity | long | ||
| trellix_epo_on_prem.event.epo_event.software_info.product_family | keyword | ||
| trellix_epo_on_prem.event.epo_event.software_info.product_name | keyword | ||
| trellix_epo_on_prem.event.epo_event.software_info.product_version | keyword | ||
| trellix_epo_on_prem.event.epo_event.source_file_size | long | byte | |
| trellix_epo_on_prem.event.epo_event.source_process_name | keyword | ||
| trellix_epo_on_prem.event.epo_event.spam_rating_id | keyword | ||
| trellix_epo_on_prem.event.epo_event.success | boolean | ||
| trellix_epo_on_prem.event.epo_event.target_name | keyword | ||
| trellix_epo_on_prem.event.epo_event.target_path | keyword | ||
| trellix_epo_on_prem.event.epo_event.task_name | keyword | ||
| trellix_epo_on_prem.event.epo_event.threat_detected_on_creation | boolean | ||
| trellix_epo_on_prem.event.epo_event.threat_handled | boolean | ||
| trellix_epo_on_prem.event.epo_event.threat_severity | Severity level of the threat. | long | |
| trellix_epo_on_prem.event.epo_event.threat_type | Type of threat (for example, virus, trojan, or PUP). | keyword | |
| trellix_epo_on_prem.event.epo_event.tvd_severity | long | ||
| trellix_epo_on_prem.event.epo_event.usb_serial_number | keyword | ||
| trellix_epo_on_prem.event.epo_event.vendor | keyword | ||
| trellix_epo_on_prem.event.epo_event.version | keyword | ||
| trellix_epo_on_prem.event.epo_event.wp_rating | keyword | ||
| trellix_epo_on_prem.event.original | The decoded JSON representation of the raw Trellix ePO syslog event. Only stored when the "Preserve decoded event" toggle is enabled. | keyword |
These inputs are used in this integration:
This integration uses the Trellix ePO executeQuery API (endpoint: /remote/core.executeQuery) for the API-based data streams:
| Data stream | Table |
|---|---|
audit |
OrionAuditLog |
web_control |
WP_EventInfo |
compliance_history |
EpoComplianceHistory |
system |
EPOLeafNode |
product_event |
EPOProductEvents |
device_event |
EEFFDeviceAllEventsView |
dlp_incident |
UDLP_EPD_Incidents |
threat_event |
EPOEvents and EPExtendedEvent |
The event data stream does not use an API. Event records are pushed by the Trellix ePO event forwarder to the Elastic Agent as RFC 5424 syslog messages over TCP with TLS.
This integration includes one or more Kibana dashboards that visualizes the data collected by the integration. The screenshots below illustrate how the ingested data is displayed.
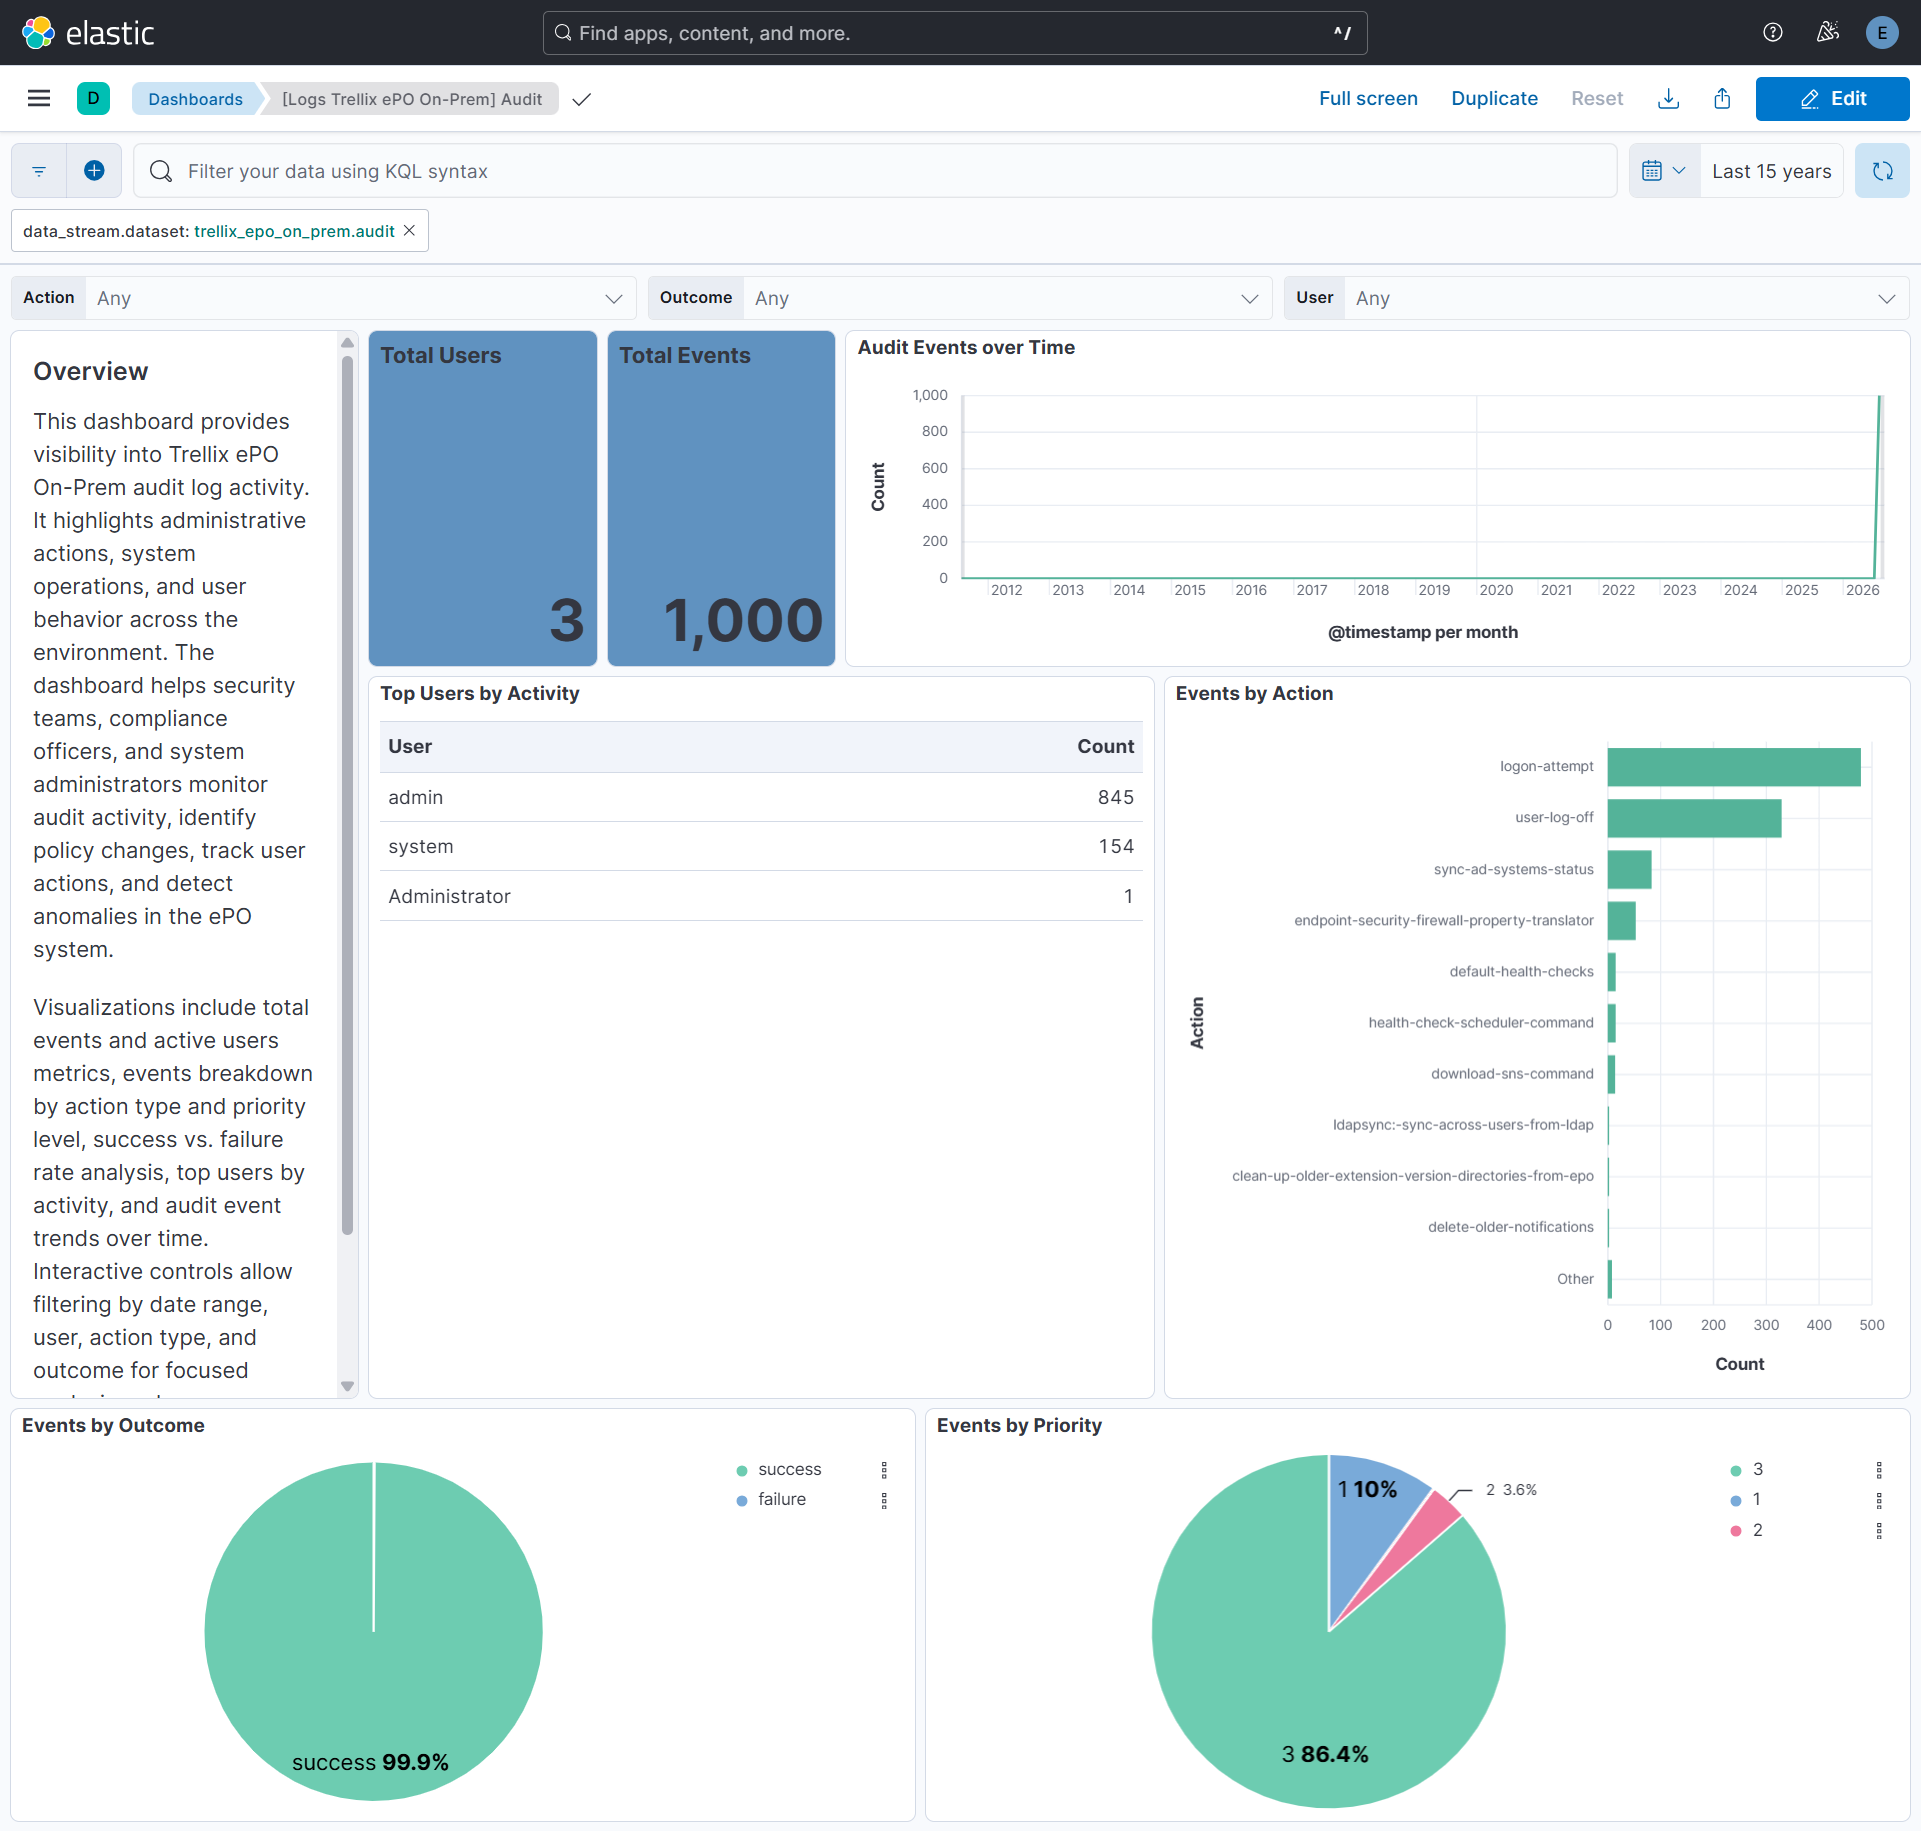
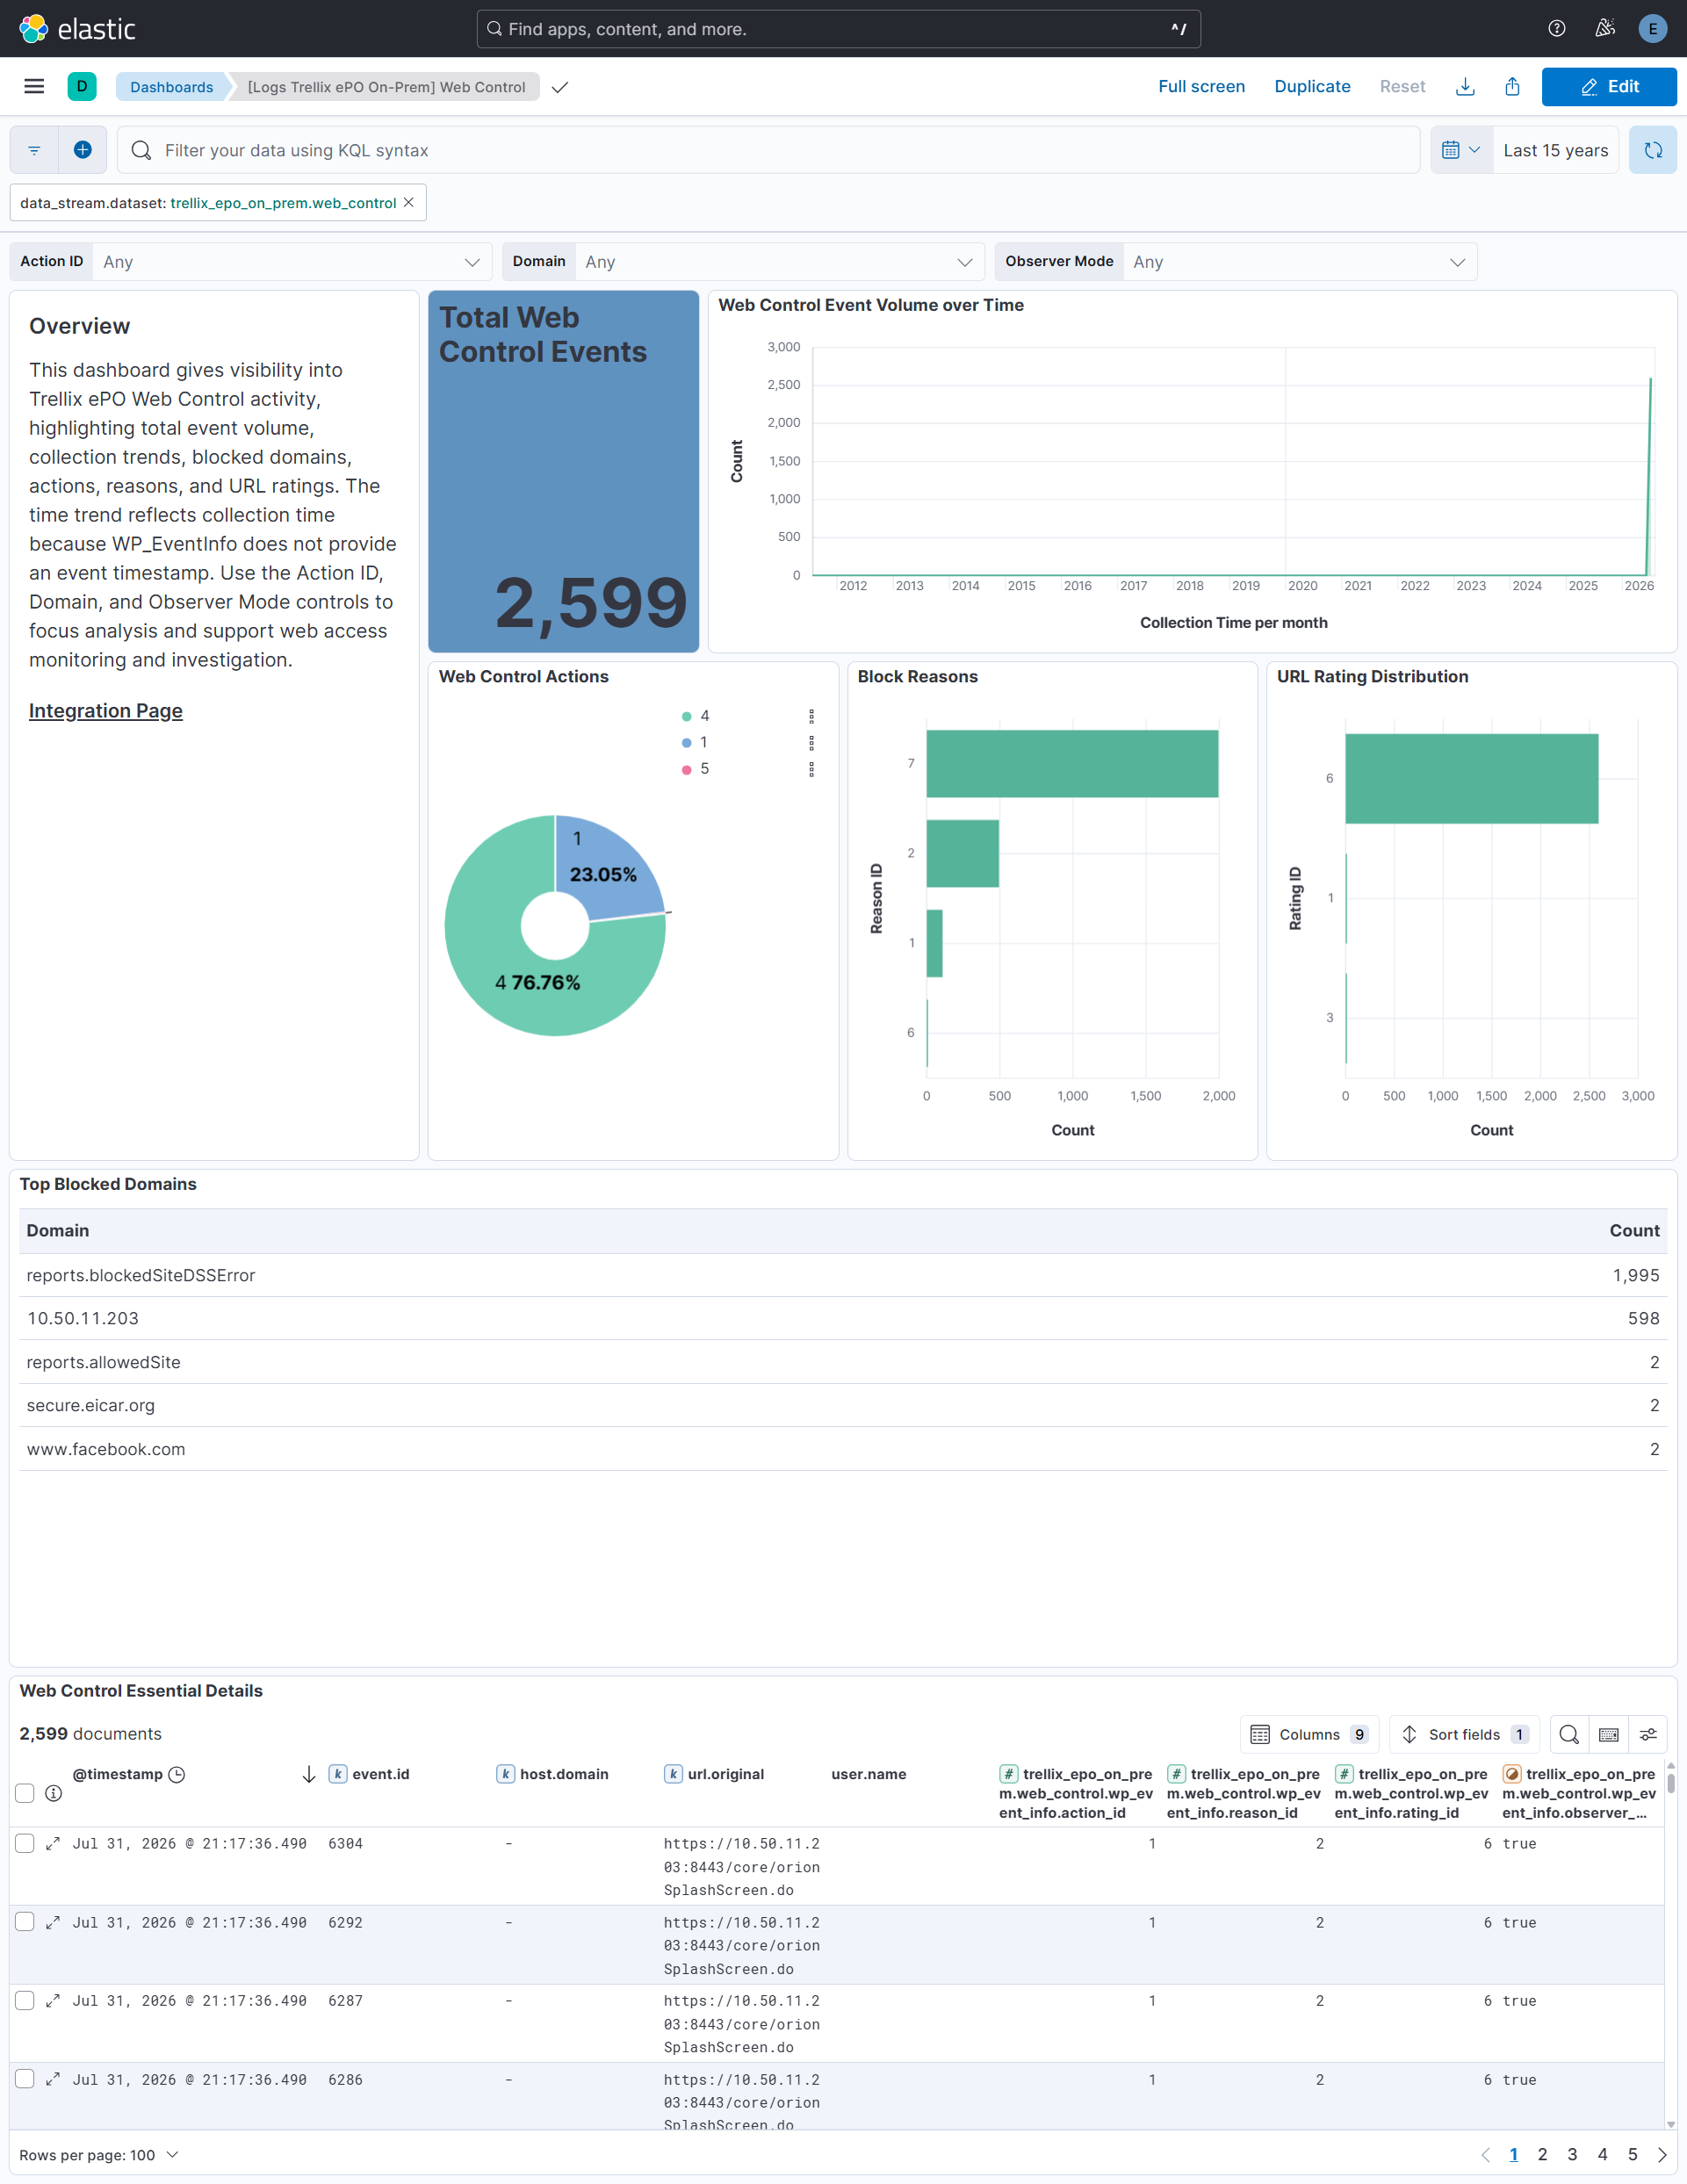
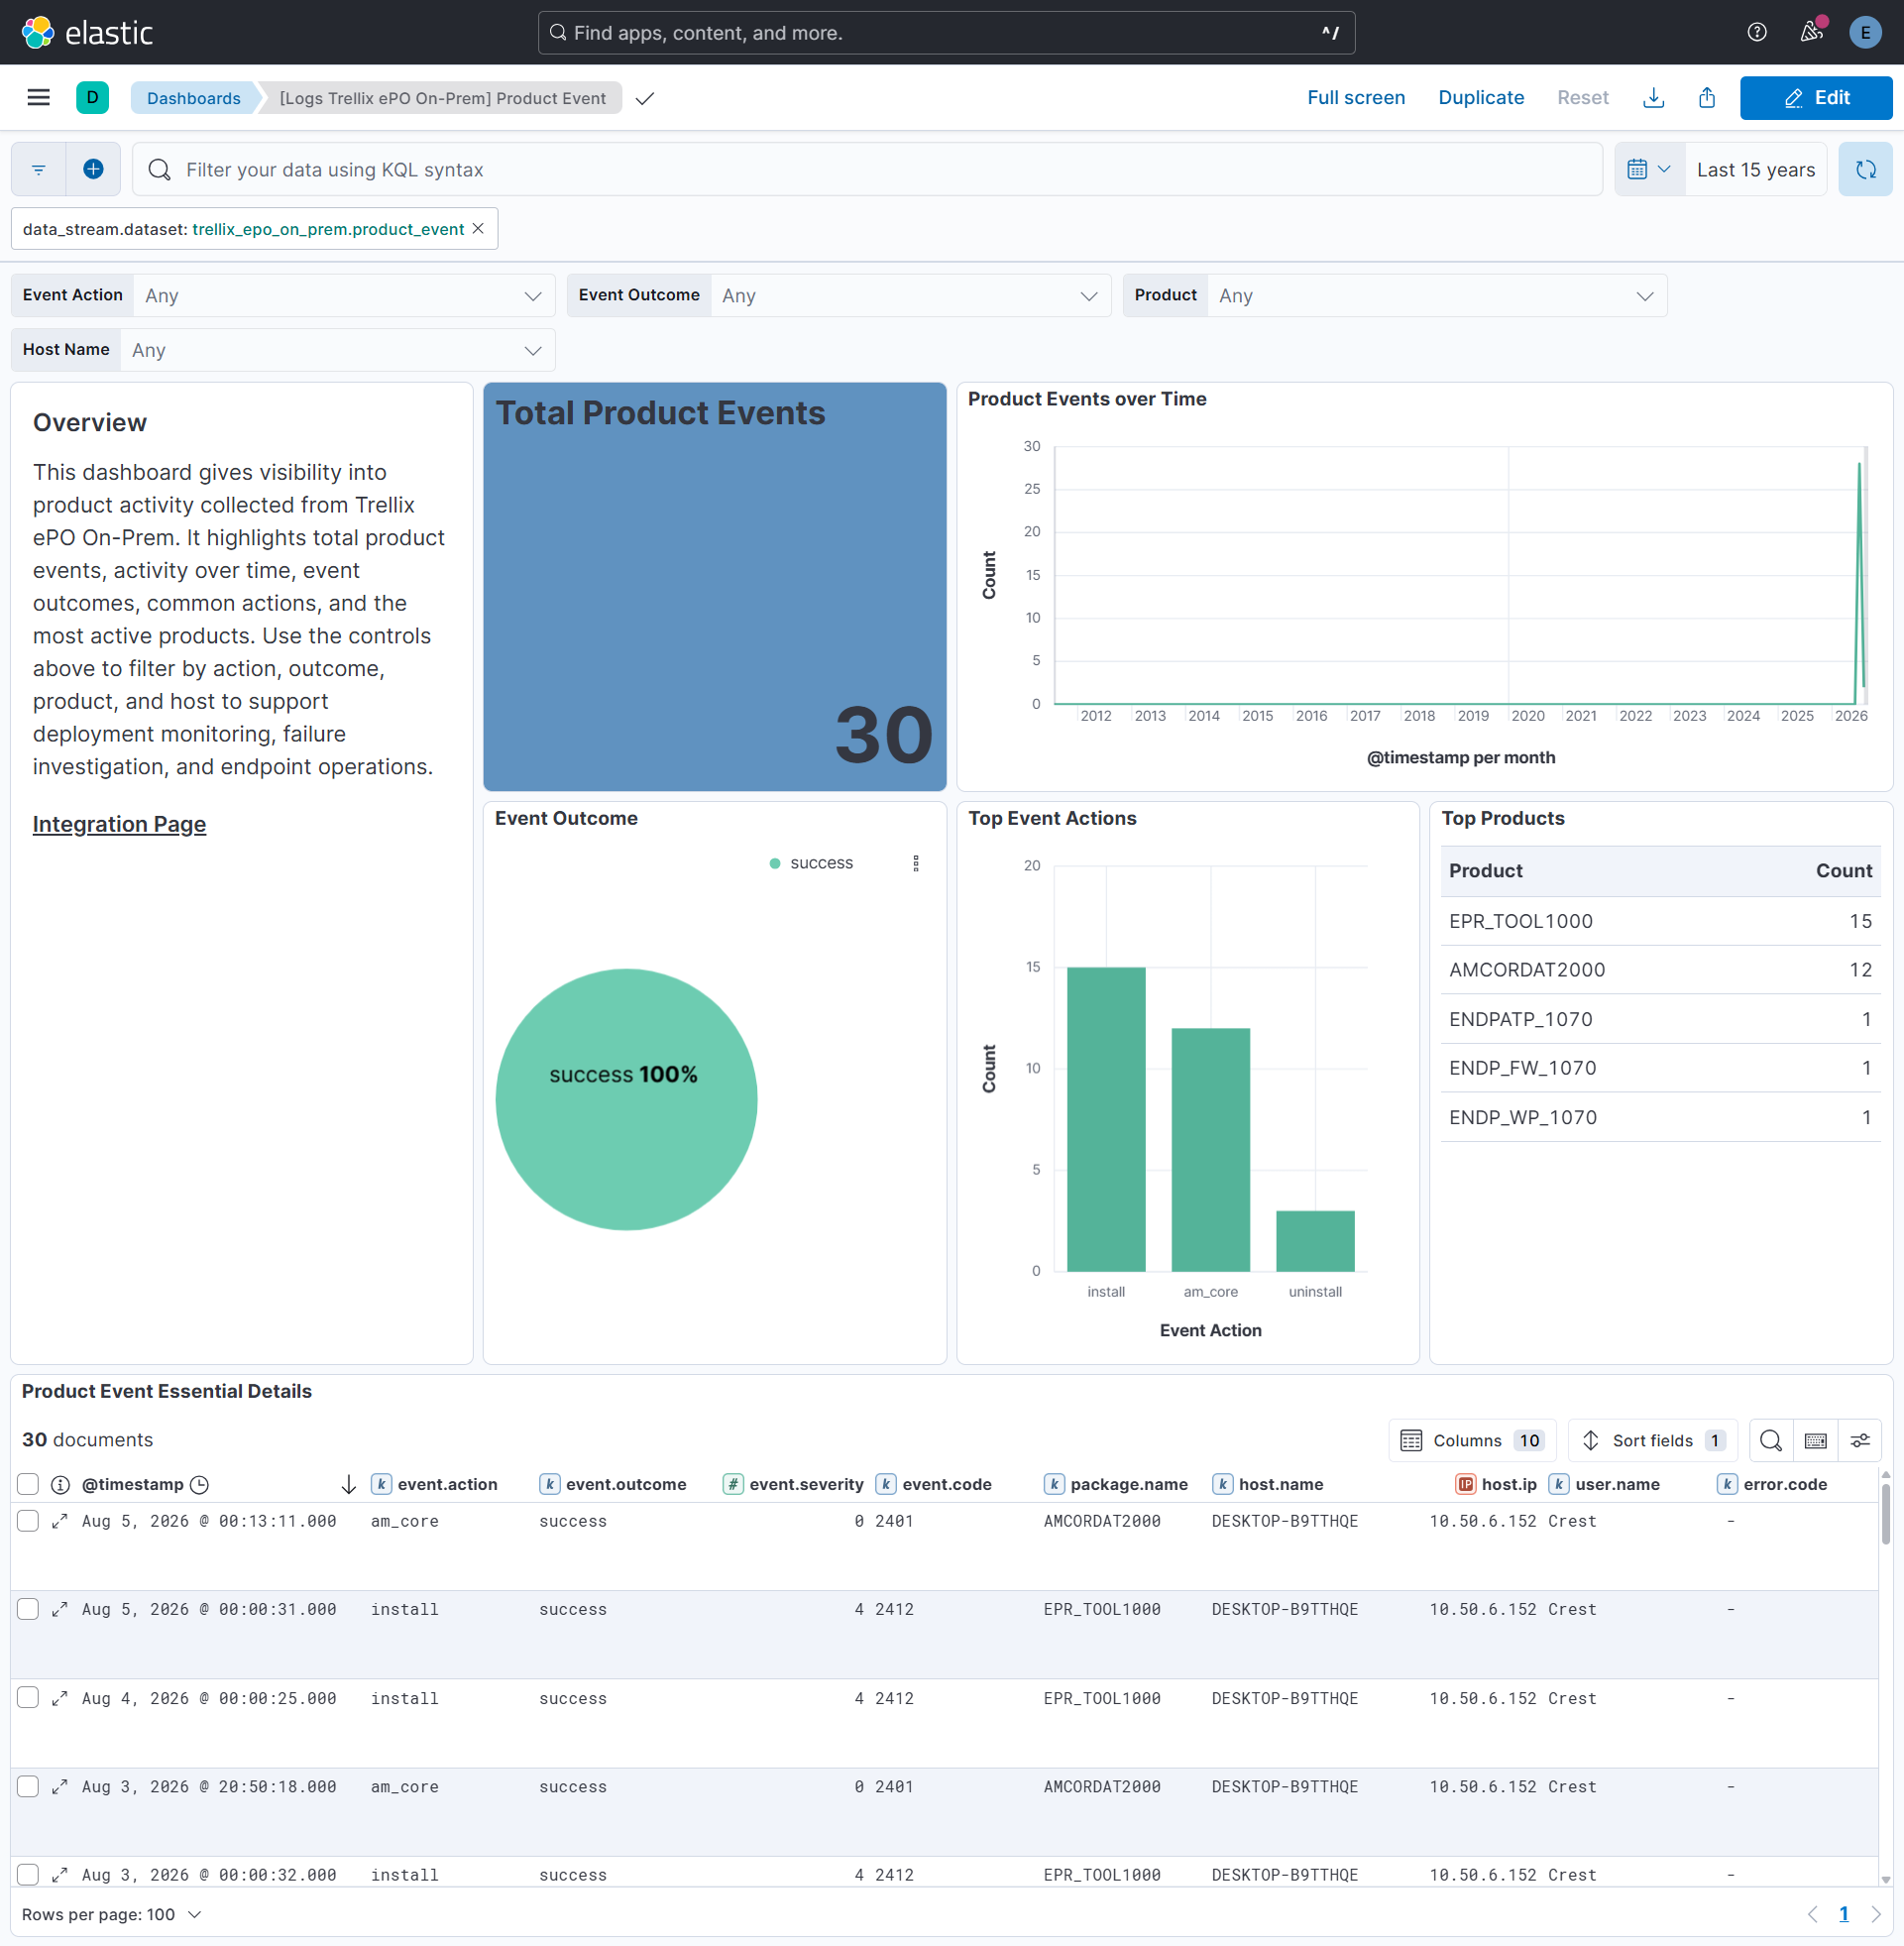
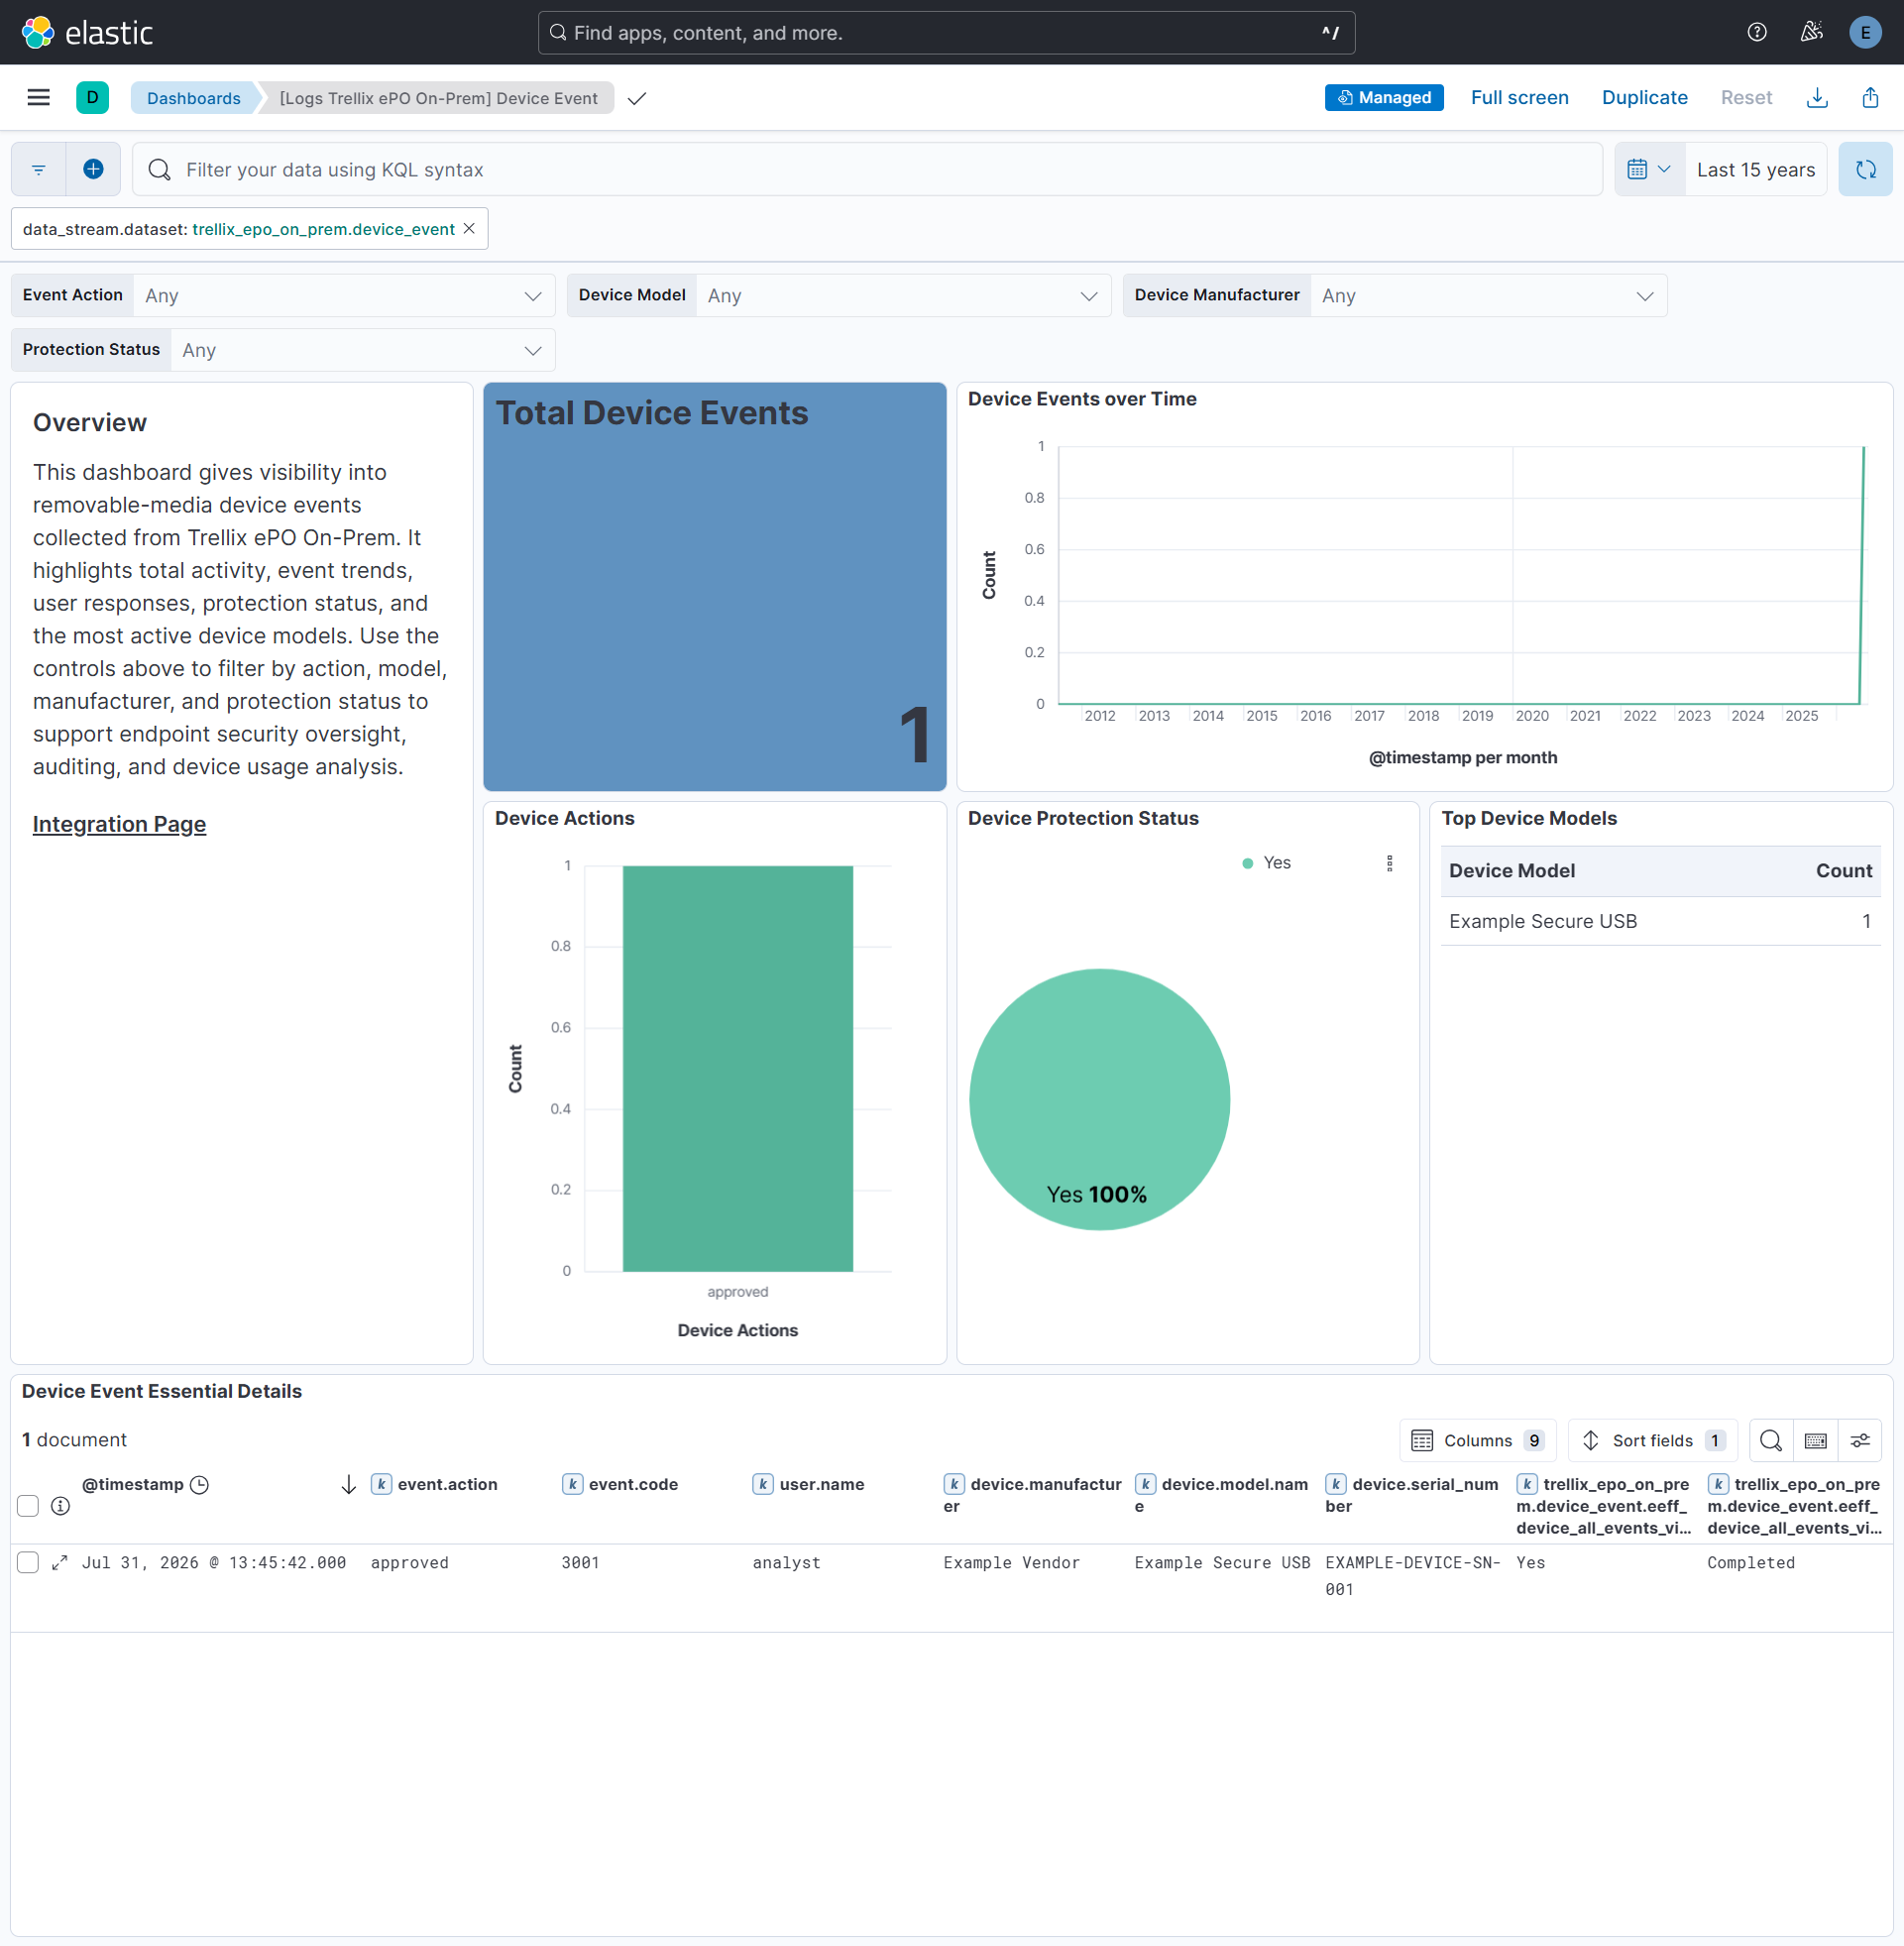
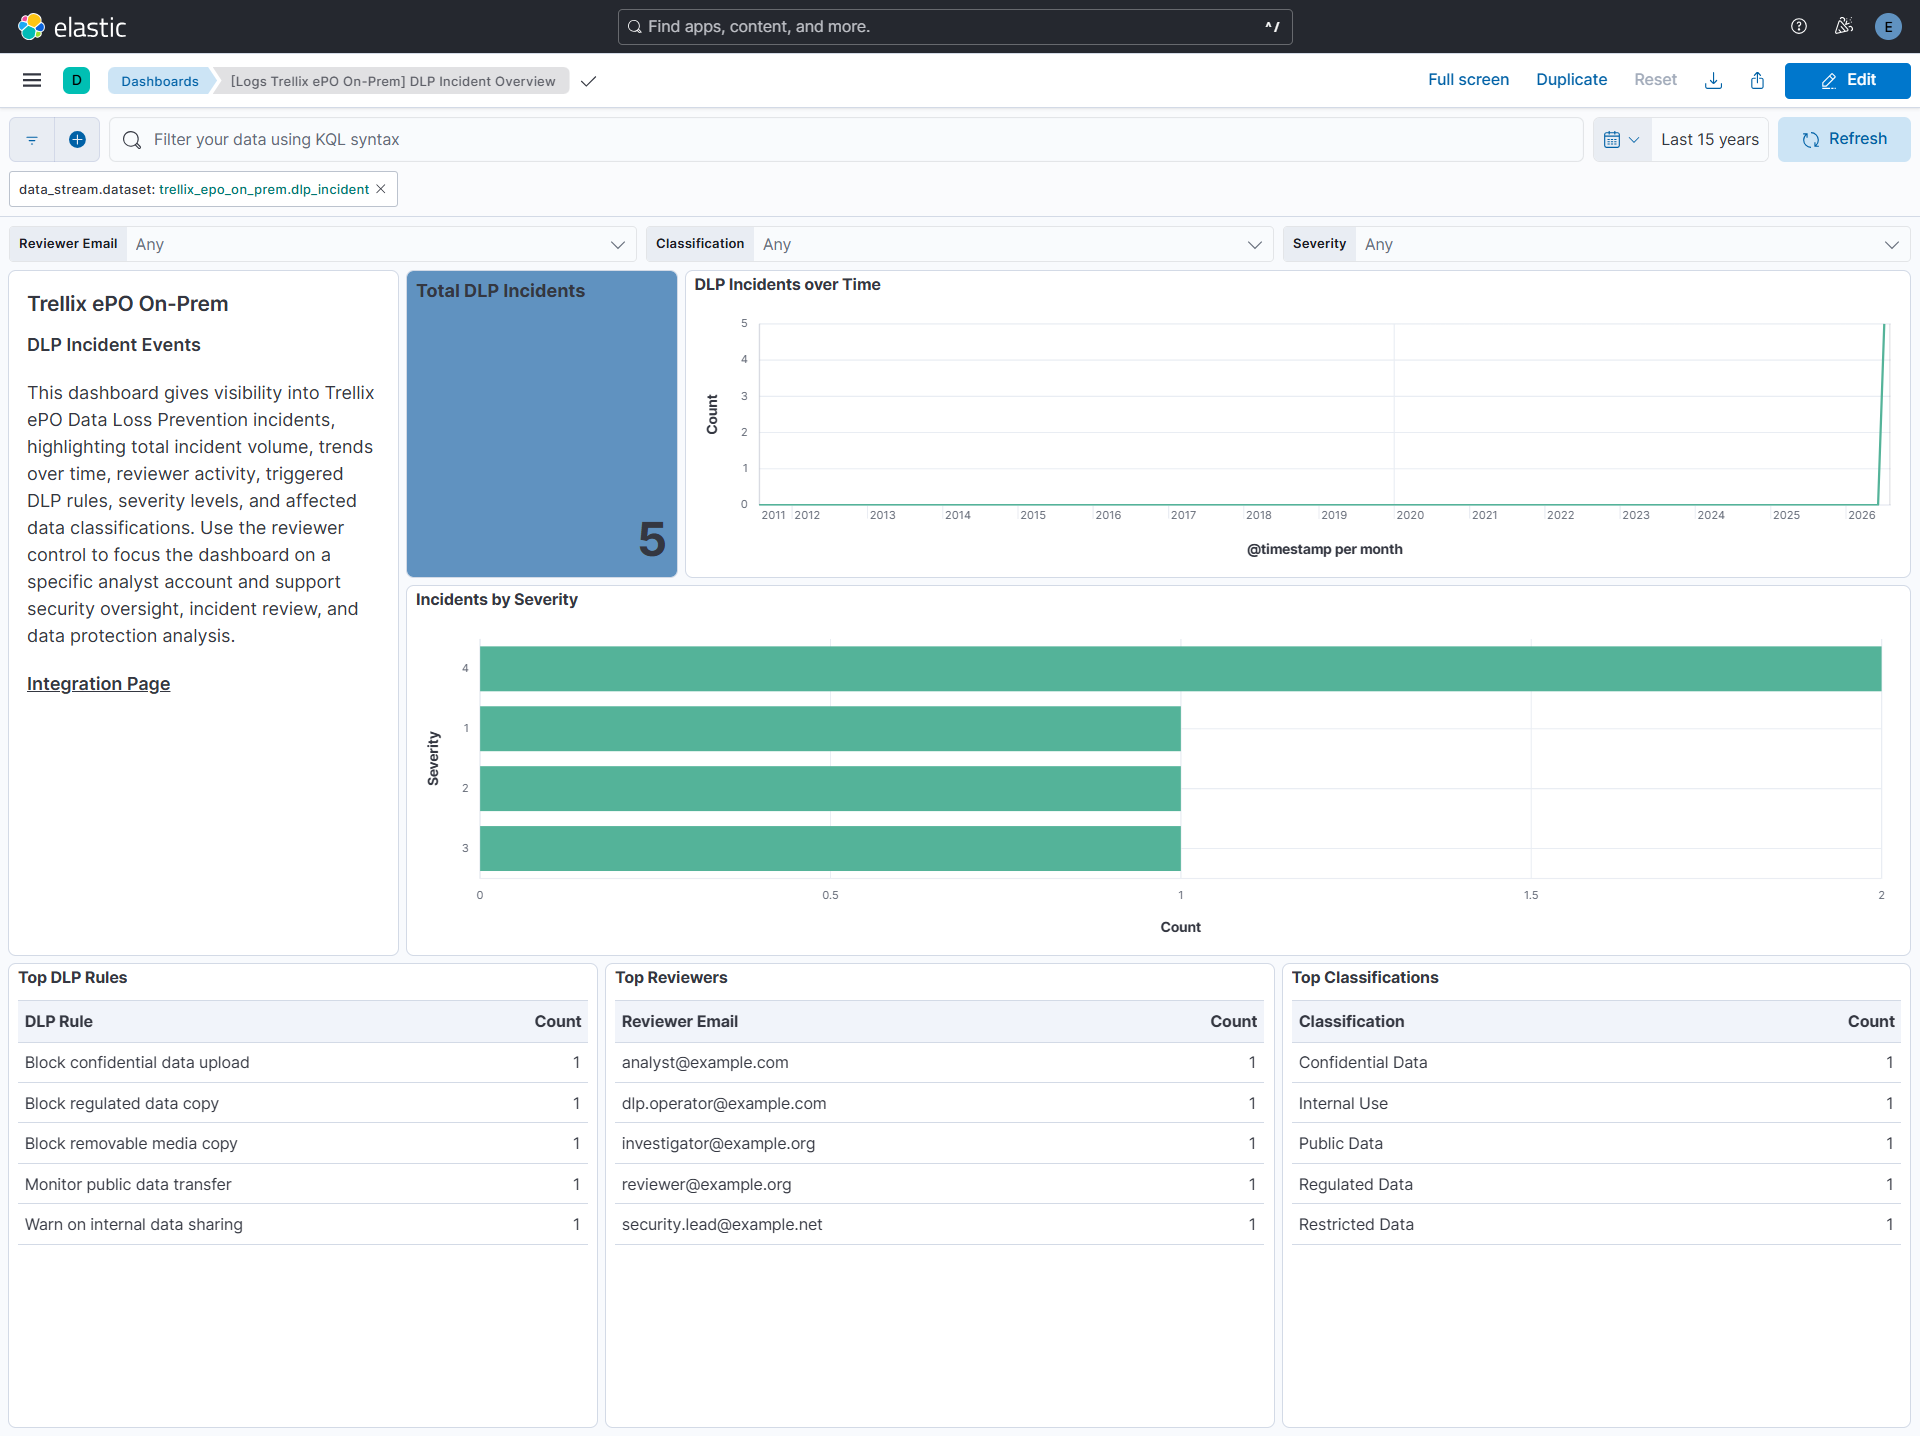
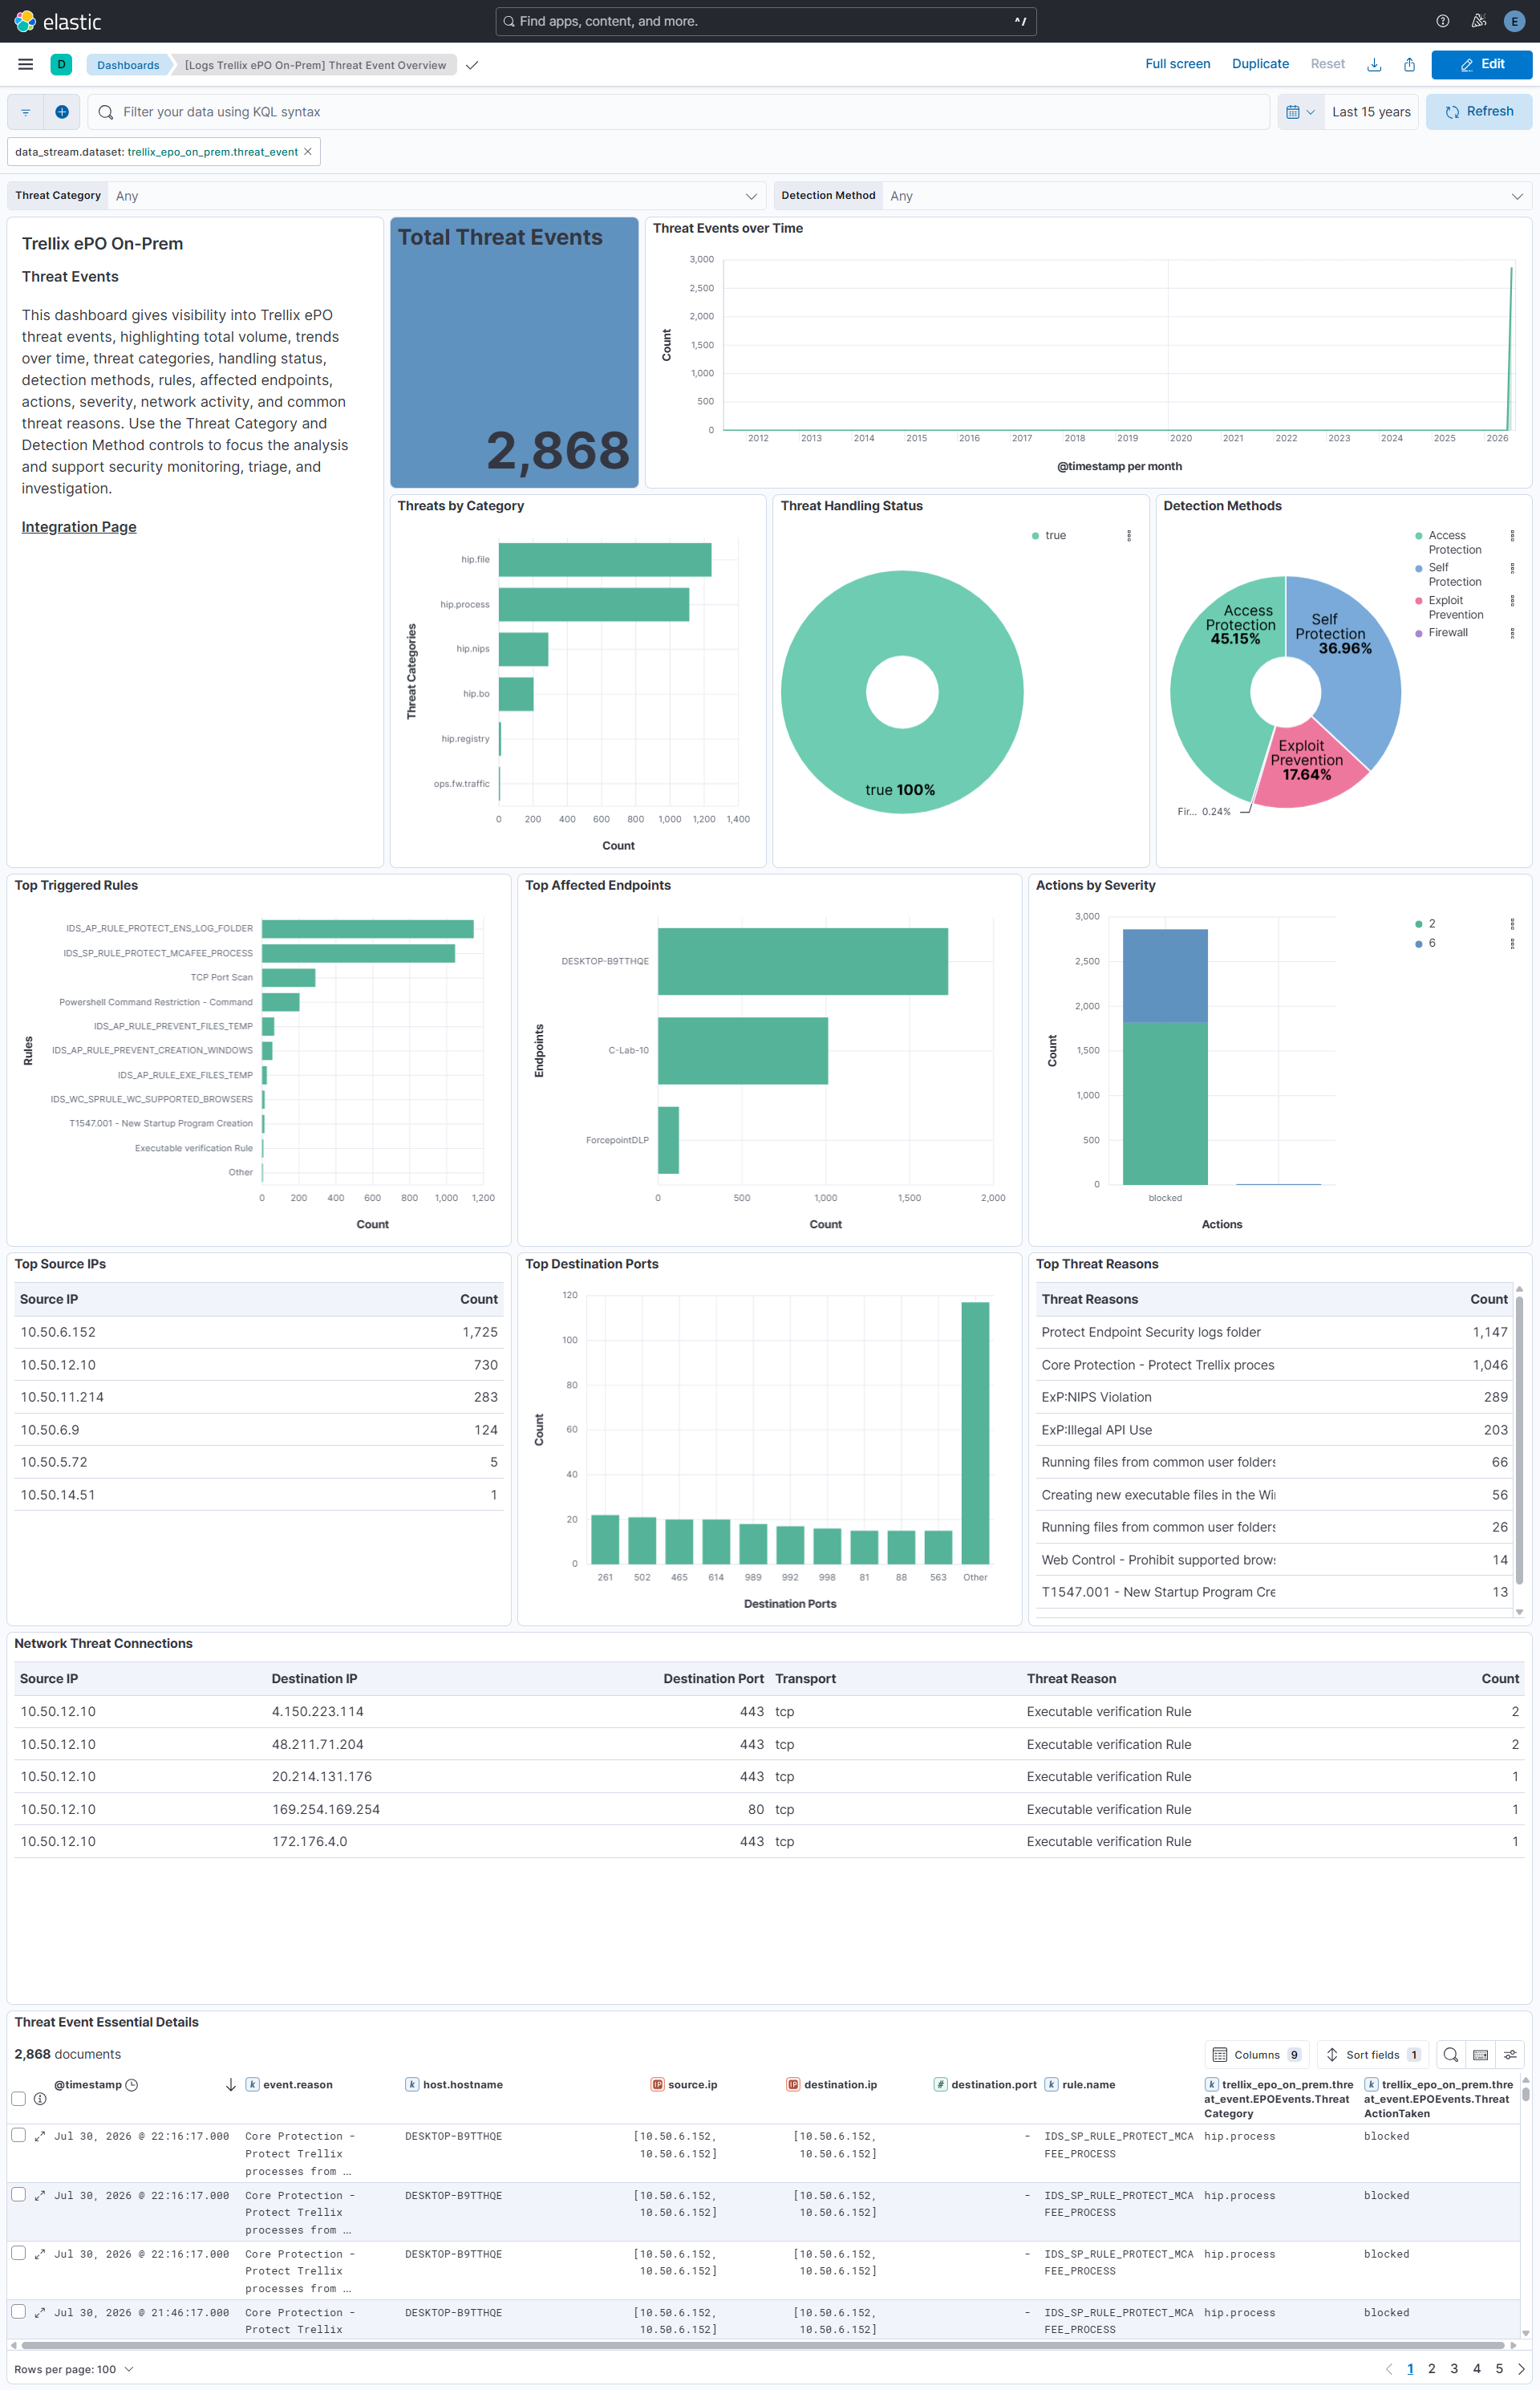
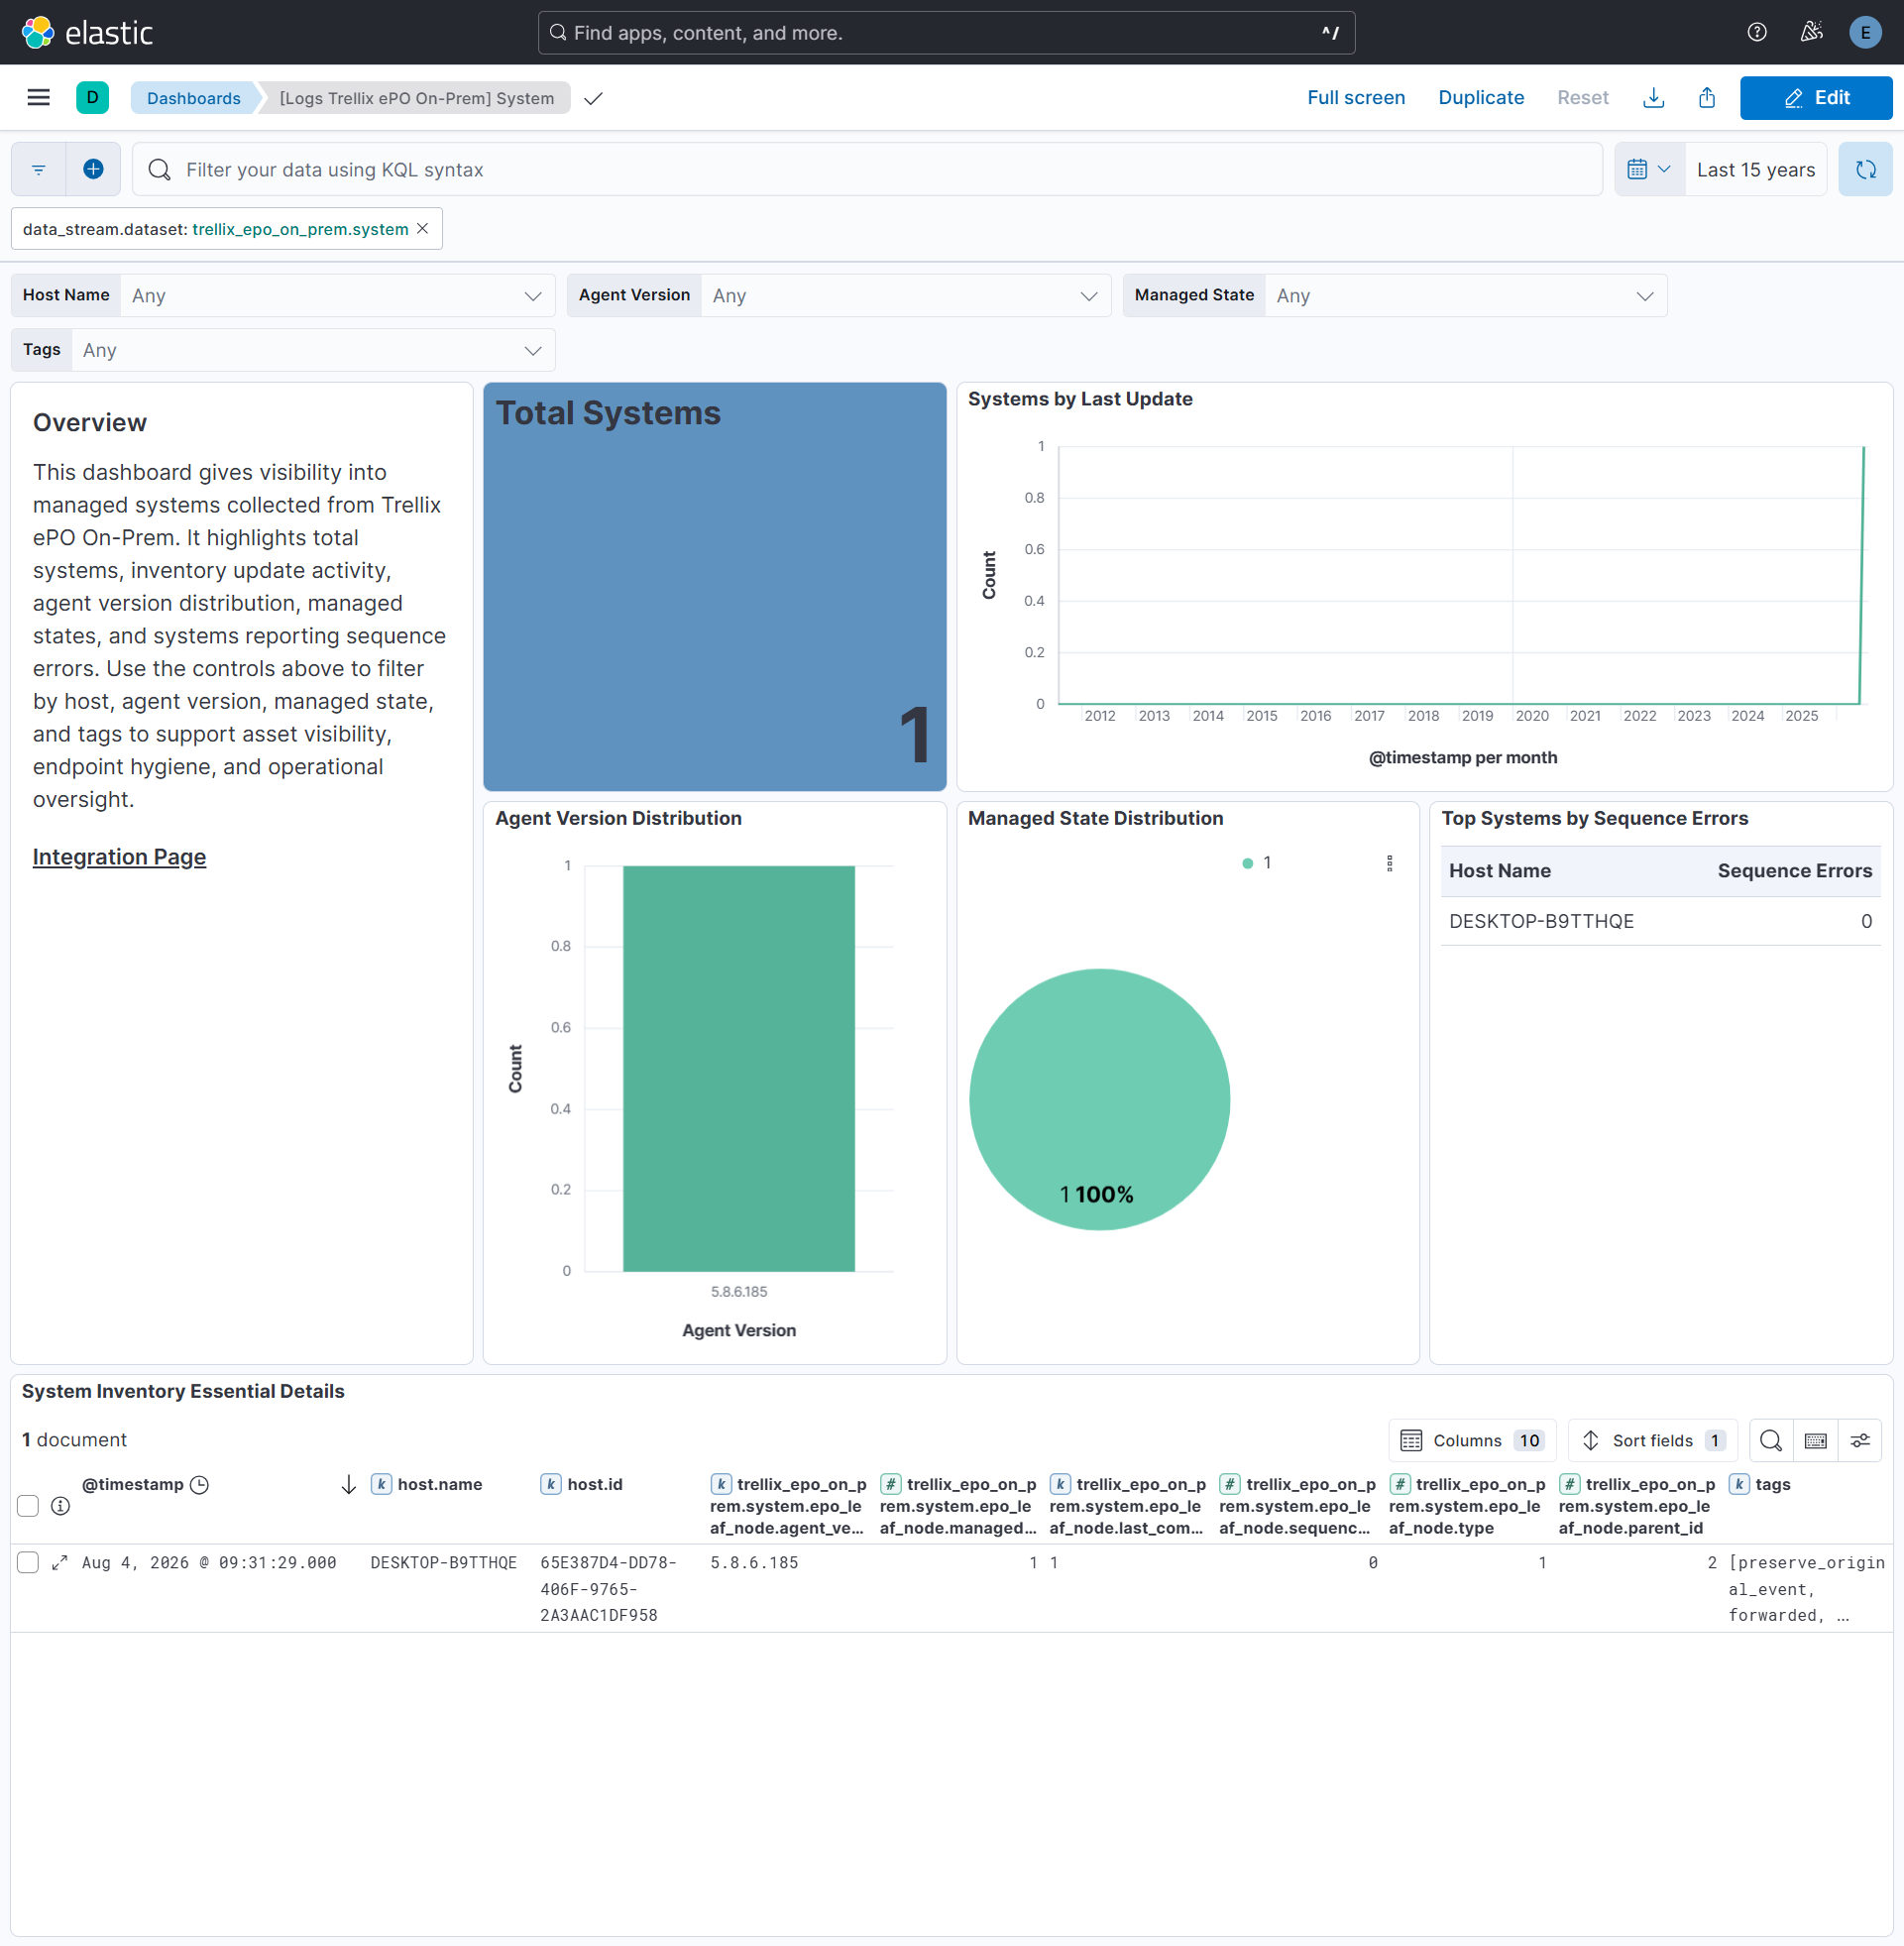
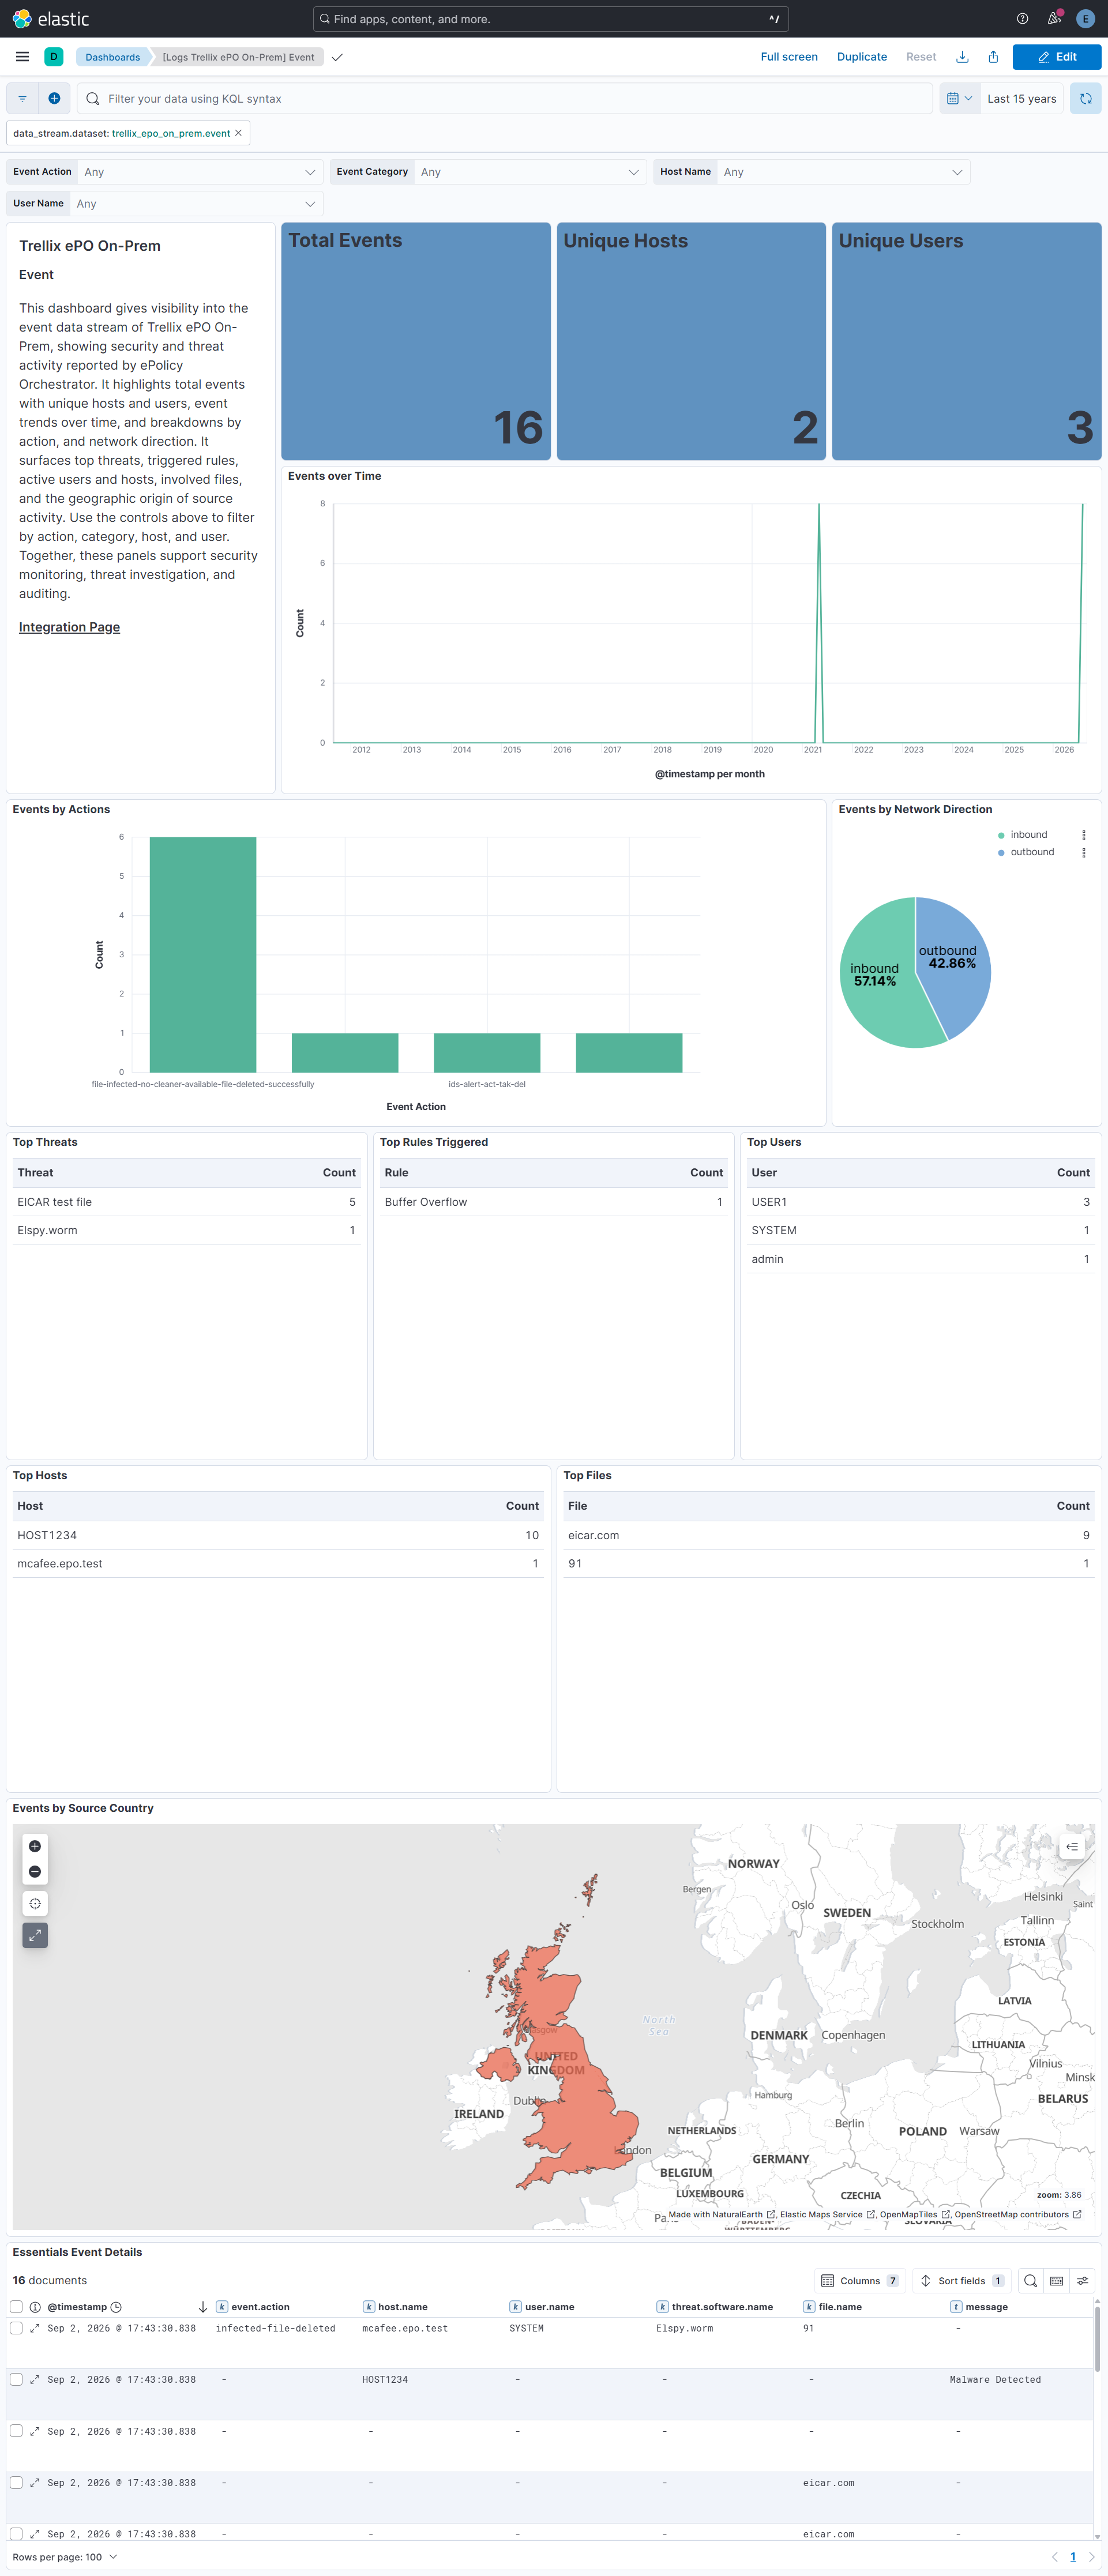
Changelog
| Version | Details | Minimum Kibana version |
|---|---|---|
| 0.1.0 | Enhancement (View pull request) Initial release of Trellix ePO On-Prem integration. Enhancement (View pull request) Add support for the event data stream. Enhancement (View pull request) Add support for the compliance_history and system data streams. Enhancement (View pull request) Add support for the device_event and product_event data streams. Enhancement (View pull request) Add support for the threat_event and dlp_incident data streams. Enhancement (View pull request) Add support for the web_control data stream. Enhancement (View pull request) Add support for the audit data stream. |
9.1.0 8.19.0 |