Contrast Security
| Version | 0.1.0
|
| Subscription level What's this? |
Basic |
| Developed by What's this? |
Partner |
| Minimum Kibana version(s) | 9.1.0 8.19.0 |
To use pre-release integrations, go to the Integrations page in Kibana, scroll down, and toggle on the Display beta integrations option.
Contrast Security ADR (Application Detection and Response) is a runtime security platform that instruments application code to detect, block, and report attacks at the point of exploitation — inside the application process itself.
The Contrast Security integration brings ADR telemetry into Elastic Security, giving SOC teams attack event data, escalated incident records, and vulnerability findings alongside the rest of their security data. Prebuilt detection rules surface exploited attacks and open incidents as Elastic Security alerts.
This integration is compatible with Elastic Stack 8.19.0 or later, or 9.1.0 or later on the 9.x line.
Contrast ADR must be configured to use the Elastic output formatter, which writes data directly to Elasticsearch using the Bulk API.
Contrast ADR instruments your application at runtime and generates telemetry for each detected security event. The output formatter sends that telemetry directly to Elasticsearch over HTTPS using the Bulk API — no Elastic Agent is required. A minimal ingest pipeline fills in default event.dataset/event.module/event.kind values when the formatter omits them and normalizes @timestamp, but otherwise passes the pre-formatted ECS document through unchanged.
Three data streams are written:
- Attack events arrive as individual runtime detections with a confirmed result.
- Incidents are created when the Contrast platform correlates related attack events into a case requiring analyst review.
- Issues are vulnerability findings identified by the Contrast agent — a static risk record tied to the application code, distinct from a live attack event.
The Contrast Security integration collects three types of data:
Attack Events — individual attack attempts detected at application runtime. Each record carries the attack type, result (EXPLOITED, BLOCKED, PROBED, or SUSPICIOUS), affected application, target URL, and the source IP. Index pattern:
logs-contrast_security.attack_event-*Incidents — escalated cases created by the Contrast platform when related attack events are correlated with known vulnerabilities or chained attack patterns. Incidents require SOC analyst attention and carry a severity and status. Index pattern:
logs-contrast_security.incident-*Issues — application vulnerability findings (for example, SQL injection weakness, insecure deserialization, missing input validation). Issues carry a CVSS score and vector. They describe a weakness in the application code, which is distinct from an attack event that describes an attempt to exploit one. Index pattern:
logs-contrast_security.issue-*
- Alert on confirmed exploits in production applications in near real time.
- Correlate Contrast ADR exploits with alerts from DLP, EDR, and WAF tools using the bundled EQL sequence rules.
- Track open security incidents and vulnerability findings alongside other Elastic Security data.
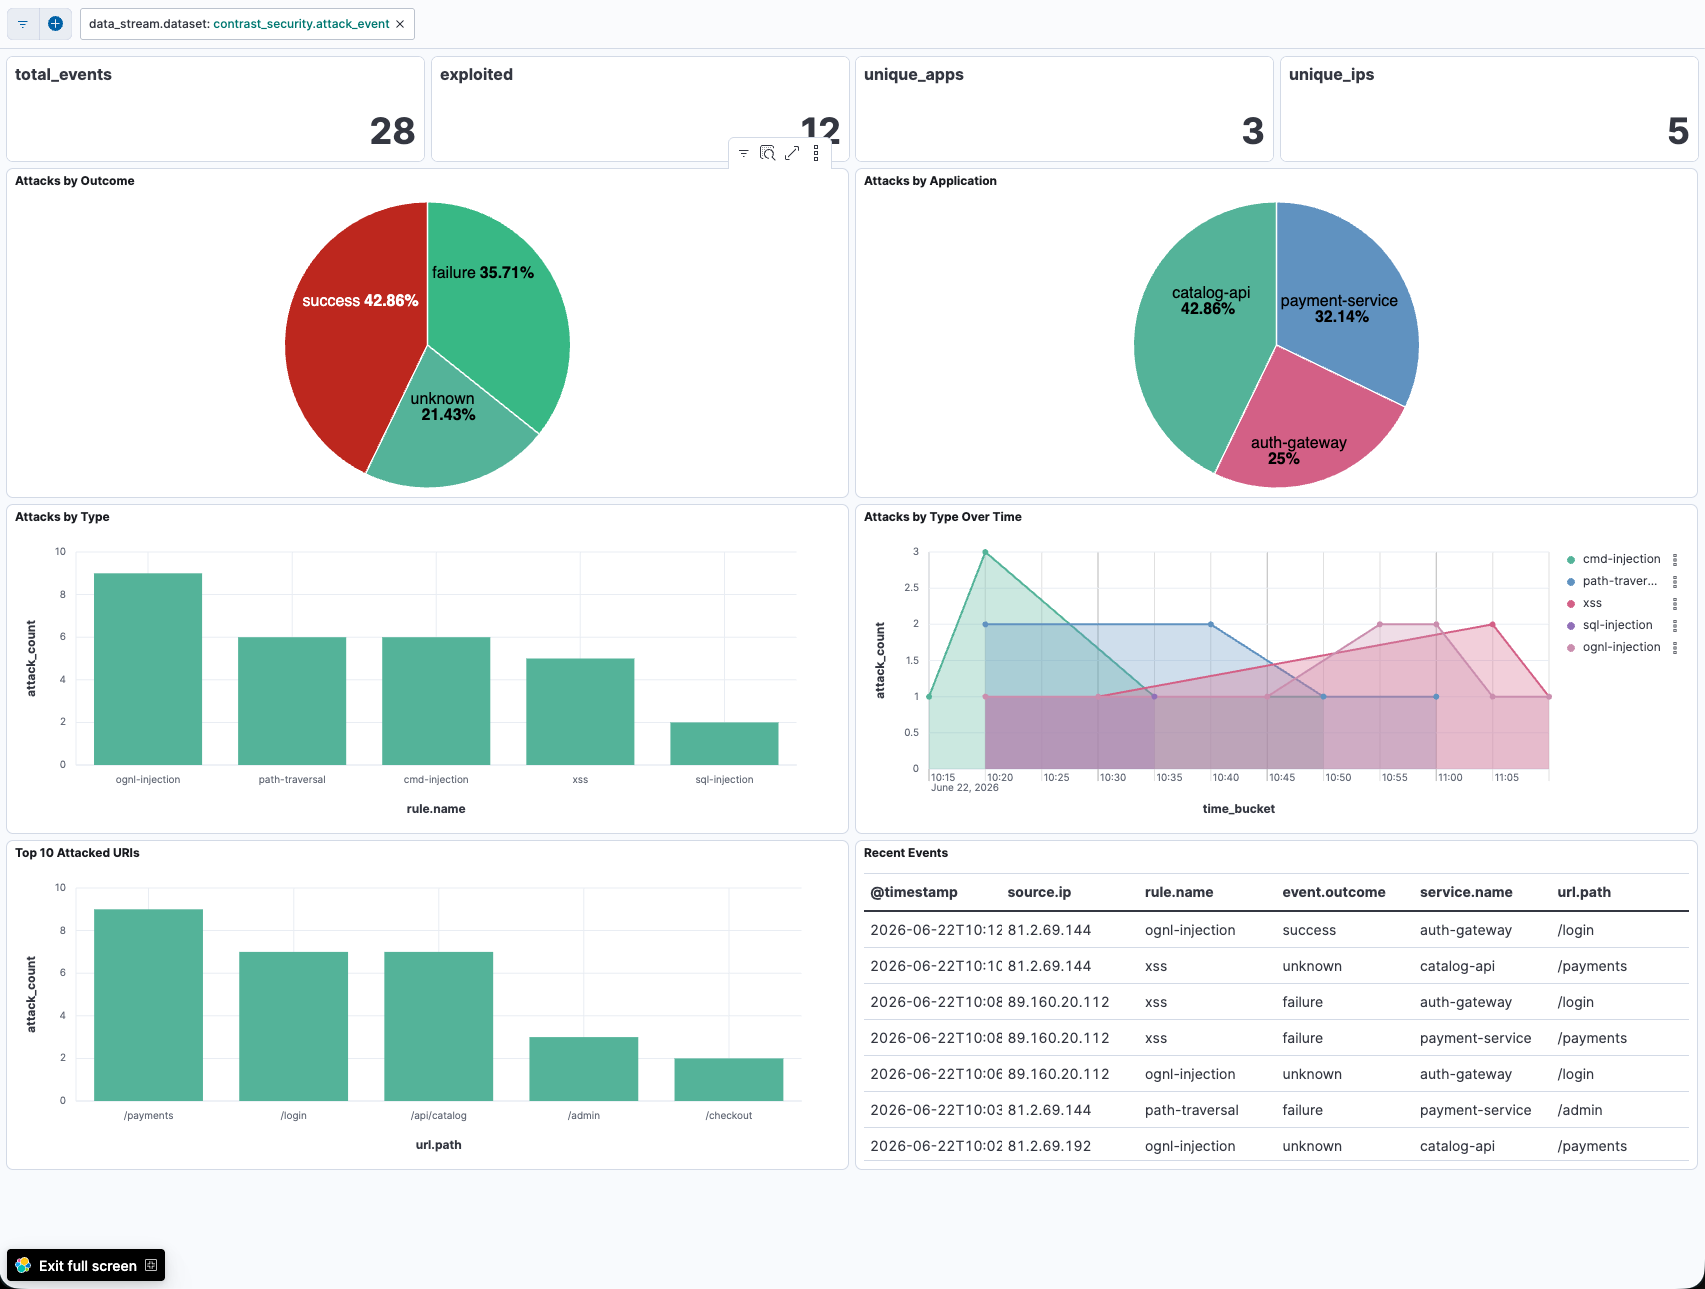
- Visualize attack trends, outcome distribution, and most-targeted endpoints in the [Contrast Security] Attack Summary Overview dashboard.
- Elastic Stack 8.19.0 or later, or 9.1.0 or later on the 9.x line, with Kibana and an Elasticsearch cluster accessible from the Contrast ADR output formatter.
- Contrast Security ADR with the Elastic output formatter configured. The formatter writes directly to Elasticsearch via the Bulk API — no Elastic Agent is required on the ADR side.
- An Elasticsearch user or API key with write access to the
logs-contrast_security.*index patterns.
No Elastic Agent deployment is required for data collection.
- In Kibana, go to Management > Integrations.
- Search for Contrast Security.
- Select the integration and click Add Contrast Security.
- Accept the defaults and click Save and continue.
Installing the integration creates the required index templates, component templates, and ILM policies, and installs the prebuilt detection rules and dashboard.
In your Contrast Security ADR deployment, configure the Elastic output formatter with your Elasticsearch endpoint and credentials. Refer to the Contrast Security documentation for your deployment type for exact steps.
- In Kibana, go to Discover and set the index pattern to
logs-contrast_security.attack_event-*. - Confirm that documents are arriving. If your environment is active, attack events should appear within a few minutes of configuration.
| Data stream | Index pattern |
|---|---|
| Attack Events | logs-contrast_security.attack_event-* |
| Incidents | logs-contrast_security.incident-* |
| Issues | logs-contrast_security.issue-* |
This integration installs five detection rules. All rules install disabled.
Prebuilt rules (ready to enable):
- Contrast ADR: Exploited Attack in Production Environment — fires when an attack is confirmed exploited in a production environment. Severity: critical.
- Contrast ADR: Security Incident Requiring Investigation — surfaces Contrast incidents as Elastic Security alerts. Severity: high.
Cross-tool EQL correlation rules (require customer configuration before enabling):
- Contrast ADR: SQL Injection Followed by DLP Alert on Same Host — correlates a confirmed SQL injection with a DLP alert on the same host within 1 hour.
- Contrast ADR: Exploited Attack Followed by EDR Alert on Same Host — correlates a confirmed exploit with an EDR alert on the same host within 30 minutes.
- Contrast ADR: Exploited Attack Confirmed by WAF Alert on Same Request — correlates a confirmed exploit with a WAF alert on the same source IP and URL path within 5 minutes.
The three EQL correlation rules are disabled because the third-party index pattern varies per deployment. Before enabling one, open it in Elastic Security, edit its index pattern to match your DLP, EDR, or WAF data, and toggle it on.
To enable rules, go to Security > Rules > Detection rules (SIEM), search for Contrast ADR, and enable the rules you want.
No data appearing in Elasticsearch
Check that the Contrast ADR output formatter is configured with the correct Elasticsearch endpoint and that the credentials have write access to logs-contrast_security.*. Review the Contrast ADR output formatter logs for connection errors.
Index template conflicts
If you see mapping conflicts, check that no legacy index templates from a previous manual setup are targeting the logs-contrast_security.* patterns. Remove any conflicting legacy templates and roll over the affected indices.
Detection rules not triggering
Confirm that the rules are enabled and that data is landing in the index pattern each rule queries. For the EQL correlation rules, confirm that the third-party data source index pattern has been updated in the rule's index configuration.
The Contrast ADR output formatter writes events synchronously to Elasticsearch via the Bulk API. Throughput depends on the volume of attack events generated by your instrumented applications and the capacity of your Elasticsearch cluster.
For guidance on sizing and ingest architectures, refer to the Ingest Architectures documentation.
This is the attack_event dataset.
Example
{
    "@timestamp": "2026-01-07T17:46:40.561Z",
    "agent": {
        "version": "6.24.0"
    },
    "ecs": {
        "version": "9.1"
    },
    "error": {
        "stack_trace": "com.zaxxer.hikari.pool.HikariProxyStatement.execute(HikariProxyStatement.java:-1)\norg.springframework.jdbc.core.JdbcTemplate$1ExecuteStatementCallback.doInStatement(JdbcTemplate.java:435)\norg.springframework.jdbc.core.JdbcTemplate.execute(JdbcTemplate.java:393)\ncom.contrast.dataservice.PaymentController.executeRawQuery(PaymentController.java:55)"
    },
    "event": {
        "category": [
            "intrusion_detection"
        ],
        "dataset": "contrast_security.attack_event",
        "id": "0d86b13b-dfac-4885-8f7c-510425177d05",
        "kind": "event",
        "module": "contrast_security",
        "outcome": "success",
        "provider": "Contrast Security",
        "reason": "sql-injection",
        "severity": 4,
        "type": [
            "allowed"
        ],
        "url": "https://apptwo.contrastsecurity.com/Contrast/cs/index.html#/0f767995-4882-4c7c-889f-994d945ff0d5/applications/03f49f62-efd2-4f7b-9402-8f5f399b0d36/attacks/0d86b13b"
    },
    "host": {
        "hostname": "contrast-cargo-cats-dataservice-7bd8f7c4d8-lsw8p",
        "id": "92325",
        "name": "contrast-cargo-cats-dataservice-agent",
        "os": {
            "full": "Linux 6.12.54-linuxkit aarch64"
        }
    },
    "http": {
        "request": {
            "body": {
                "content": "9999999999999999 ' AND SLEEP(5) OR 'a'='a"
            },
            "method": "GET"
        },
        "version": "1.1"
    },
    "message": "sql-injection",
    "network": {
        "protocol": "http",
        "transport": "tcp"
    },
    "observer": {
        "product": "Contrast ADR",
        "type": "adr",
        "vendor": "Contrast Security"
    },
    "organization": {
        "id": "119844af-42ff-4293-b06b-81d426e9a4a9"
    },
    "rule": {
        "category": "Application Attack",
        "id": "sql-injection",
        "name": "sql-injection",
        "ruleset": "Contrast ADR"
    },
    "service": {
        "environment": "production",
        "id": "03f49f62-efd2-4f7b-9402-8f5f399b0d36",
        "name": "contrast-cargo-cats-dataservice",
        "type": "java"
    },
    "source": {
        "ip": "10.1.1.128"
    },
    "threat": {
        "framework": "MITRE ATT&CK",
        "tactic": {
            "id": [
                "TA0040",
                "TA0010",
                "TA0009"
            ],
            "name": [
                "Impact",
                "Exfiltration",
                "Collection"
            ],
            "reference": [
                "https://attack.mitre.org/tactics/TA0040/",
                "https://attack.mitre.org/tactics/TA0010/",
                "https://attack.mitre.org/tactics/TA0009/"
            ]
        }
    },
    "url": {
        "path": "/payments"
    }
}
Exported fields
| Field | Description | Type |
|---|---|---|
| @timestamp | Date/time when the event originated. This is the date/time extracted from the event, typically representing when the event was generated by the source. If the event source has no original timestamp, this value is typically populated by the first time the event was received by the pipeline. Required field for all events. | date |
| agent.version | Version of the agent. | keyword |
| data_stream.dataset | The field can contain anything that makes sense to signify the source of the data. Examples include nginx.access, prometheus, endpoint etc. For data streams that otherwise fit, but that do not have dataset set we use the value "generic" for the dataset value. event.dataset should have the same value as data_stream.dataset. Beyond the Elasticsearch data stream naming criteria noted above, the dataset value has additional restrictions: * Must not contain - * No longer than 100 characters |
constant_keyword |
| data_stream.namespace | A user defined namespace. Namespaces are useful to allow grouping of data. Many users already organize their indices this way, and the data stream naming scheme now provides this best practice as a default. Many users will populate this field with default. If no value is used, it falls back to default. Beyond the Elasticsearch index naming criteria noted above, namespace value has the additional restrictions: * Must not contain - * No longer than 100 characters |
constant_keyword |
| data_stream.type | An overarching type for the data stream. Currently allowed values are "logs" and "metrics". We expect to also add "traces" and "synthetics" in the near future. | constant_keyword |
| ecs.version | ECS version this event conforms to. ecs.version is a required field and must exist in all events. When querying across multiple indices -- which may conform to slightly different ECS versions -- this field lets integrations adjust to the schema version of the events. |
keyword |
| error.stack_trace | The stack trace of this error in plain text. | wildcard |
| error.stack_trace.text | Multi-field of error.stack_trace. |
match_only_text |
| event.category | This is one of four ECS Categorization Fields, and indicates the second level in the ECS category hierarchy. event.category represents the "big buckets" of ECS categories. For example, filtering on event.category:process yields all events relating to process activity. This field is closely related to event.type, which is used as a subcategory. This field is an array. This will allow proper categorization of some events that fall in multiple categories. |
keyword |
| event.created | event.created contains the date/time when the event was first read by an agent, or by your pipeline. This field is distinct from @timestamp in that @timestamp typically contain the time extracted from the original event. In most situations, these two timestamps will be slightly different. The difference can be used to calculate the delay between your source generating an event, and the time when your agent first processed it. This can be used to monitor your agent's or pipeline's ability to keep up with your event source. In case the two timestamps are identical, @timestamp should be used. |
date |
| event.dataset | Name of the dataset. If an event source publishes more than one type of log or events (e.g. access log, error log), the dataset is used to specify which one the event comes from. It's recommended but not required to start the dataset name with the module name, followed by a dot, then the dataset name. | constant_keyword |
| event.id | Unique ID to describe the event. | keyword |
| event.kind | This is one of four ECS Categorization Fields, and indicates the highest level in the ECS category hierarchy. event.kind gives high-level information about what type of information the event contains, without being specific to the contents of the event. For example, values of this field distinguish alert events from metric events. The value of this field can be used to inform how these kinds of events should be handled. They may warrant different retention, different access control, it may also help understand whether the data is coming in at a regular interval or not. |
keyword |
| event.module | Name of the module this data is coming from. If your monitoring agent supports the concept of modules or plugins to process events of a given source (e.g. Apache logs), event.module should contain the name of this module. |
constant_keyword |
| event.outcome | This is one of four ECS Categorization Fields, and indicates the lowest level in the ECS category hierarchy. event.outcome simply denotes whether the event represents a success or a failure from the perspective of the entity that produced the event. Note that when a single transaction is described in multiple events, each event may populate different values of event.outcome, according to their perspective. Also note that in the case of a compound event (a single event that contains multiple logical events), this field should be populated with the value that best captures the overall success or failure from the perspective of the event producer. Further note that not all events will have an associated outcome. For example, this field is generally not populated for metric events, events with event.type:info, or any events for which an outcome does not make logical sense. |
keyword |
| event.provider | Source of the event. Event transports such as Syslog or the Windows Event Log typically mention the source of an event. It can be the name of the software that generated the event (e.g. Sysmon, httpd), or of a subsystem of the operating system (kernel, Microsoft-Windows-Security-Auditing). | keyword |
| event.reason | Reason why this event happened, according to the source. This describes the why of a particular action or outcome captured in the event. Where event.action captures the action from the event, event.reason describes why that action was taken. For example, a web proxy with an event.action which denied the request may also populate event.reason with the reason why (e.g. blocked site). |
keyword |
| event.severity | The numeric severity of the event according to your event source. What the different severity values mean can be different between sources and use cases. It's up to the implementer to make sure severities are consistent across events from the same source. The Syslog severity belongs in log.syslog.severity.code. event.severity is meant to represent the severity according to the event source (e.g. firewall, IDS). If the event source does not publish its own severity, you may optionally copy the log.syslog.severity.code to event.severity. |
long |
| event.type | This is one of four ECS Categorization Fields, and indicates the third level in the ECS category hierarchy. event.type represents a categorization "sub-bucket" that, when used along with the event.category field values, enables filtering events down to a level appropriate for single visualization. This field is an array. This will allow proper categorization of some events that fall in multiple event types. |
keyword |
| event.url | URL linking to an external system to continue investigation of this event. This URL links to another system where in-depth investigation of the specific occurrence of this event can take place. Alert events, indicated by event.kind:alert, are a common use case for this field. |
keyword |
| host.hostname | Hostname of the host. It normally contains what the hostname command returns on the host machine. |
keyword |
| host.id | Unique host id. As hostname is not always unique, use values that are meaningful in your environment. Example: The current usage of beat.name. |
keyword |
| host.name | Name of the host. It can contain what hostname returns on Unix systems, the fully qualified domain name (FQDN), or a name specified by the user. The recommended value is the lowercase FQDN of the host. | keyword |
| host.os.full | Operating system name, including the version or code name. | keyword |
| host.os.full.text | Multi-field of host.os.full. |
match_only_text |
| http.request.body.content | The full HTTP request body. | wildcard |
| http.request.body.content.text | Multi-field of http.request.body.content. |
match_only_text |
| http.request.method | HTTP request method. The value should retain its casing from the original event. For example, GET, get, and GeT are all considered valid values for this field. |
keyword |
| http.version | HTTP version. | keyword |
| message | For log events the message field contains the log message, optimized for viewing in a log viewer. For structured logs without an original message field, other fields can be concatenated to form a human-readable summary of the event. If multiple messages exist, they can be combined into one message. | match_only_text |
| network.protocol | In the OSI Model this would be the Application Layer protocol. For example, http, dns, or ssh. The field value must be normalized to lowercase for querying. |
keyword |
| network.transport | Same as network.iana_number, but instead using the Keyword name of the transport layer (udp, tcp, ipv6-icmp, etc.) The field value must be normalized to lowercase for querying. | keyword |
| observer.product | The product name of the observer. | keyword |
| observer.type | The type of the observer the data is coming from. There is no predefined list of observer types. Some examples are forwarder, firewall, ids, ips, proxy, poller, sensor, APM server. |
keyword |
| observer.vendor | Vendor name of the observer. | keyword |
| organization.id | Unique identifier for the organization. | keyword |
| rule.category | A categorization value keyword used by the entity using the rule for detection of this event. | keyword |
| rule.id | A rule ID that is unique within the scope of an agent, observer, or other entity using the rule for detection of this event. | keyword |
| rule.name | The name of the rule or signature generating the event. | keyword |
| rule.ruleset | Name of the ruleset, policy, group, or parent category in which the rule used to generate this event is a member. | keyword |
| service.environment | Identifies the environment where the service is running. If the same service runs in different environments (production, staging, QA, development, etc.), the environment can identify other instances of the same service. Can also group services and applications from the same environment. | keyword |
| service.id | Unique identifier of the running service. If the service is comprised of many nodes, the service.id should be the same for all nodes. This id should uniquely identify the service. This makes it possible to correlate logs and metrics for one specific service, no matter which particular node emitted the event. Note that if you need to see the events from one specific host of the service, you should filter on that host.name or host.id instead. |
keyword |
| service.name | Name of the service data is collected from. The name of the service is normally user given. This allows for distributed services that run on multiple hosts to correlate the related instances based on the name. In the case of Elasticsearch the service.name could contain the cluster name. For Beats the service.name is by default a copy of the service.type field if no name is specified. |
keyword |
| service.type | The type of the service data is collected from. The type can be used to group and correlate logs and metrics from one service type. Example: If logs or metrics are collected from Elasticsearch, service.type would be elasticsearch. |
keyword |
| source.ip | IP address of the source (IPv4 or IPv6). | ip |
| threat.framework | Name of the threat framework used to further categorize and classify the tactic and technique of the reported threat. Framework classification can be provided by detecting systems, evaluated at ingest time, or retrospectively tagged to events. | keyword |
| threat.tactic.id | The id of tactic used by this threat. You can use a MITRE ATT&CK® tactic, for example. (ex. https://attack.mitre.org/tactics/TA0002/ ) | keyword |
| threat.tactic.name | Name of the type of tactic used by this threat. You can use a MITRE ATT&CK® tactic, for example. (ex. https://attack.mitre.org/tactics/TA0002/) | keyword |
| threat.tactic.reference | The reference url of tactic used by this threat. You can use a MITRE ATT&CK® tactic, for example. (ex. https://attack.mitre.org/tactics/TA0002/ ) | keyword |
| url.path | Path of the request, such as "/search". | wildcard |
This is the incident dataset.
Example
{
    "message": "V1 SQL Injection on \"/WebGoat/attack\"",
    "@timestamp": "2026-02-06T16:00:14.223Z",
    "observer": {
        "vendor": "Contrast Security",
        "product": "Contrast ADR",
        "type": "adr"
    },
    "ecs": {
        "version": "9.1"
    },
    "rule": {
        "category": "Security Incident",
        "ruleset": "Contrast ADR",
        "reference": [
            "https://github.com/Contrast-Security-OSS/adr-runbooks/blob/main/_runbooks/path-traversal.md",
            "Another runbook"
        ],
        "name": "sql-injection"
    },
    "event": {
        "kind": "alert",
        "category": [
            "intrusion_detection"
        ],
        "type": [
            "info"
        ],
        "dataset": "contrast_security.incident",
        "module": "contrast_security",
        "id": "INC-1996-19960",
        "reason": "Incident Severity Updated",
        "url": "https://test.contrast.com/Contrast/cs/index.html#/3ccd2a09-b356-42c4-9c0c-80128513ff3b/incidents/INC-1996-19960",
        "created": "2026-06-18T16:05:47.365052Z",
        "end": "2026-06-18T16:05:15.902Z",
        "risk_score": 10,
        "severity": 10,
        "action": "incident_updated",
        "provider": "contrast-security-adr"
    },
    "organization": {
        "id": "3ccd2a09-b356-42c4-9c0c-80128513ff3b"
    },
    "contrast_security": {
        "event_type": "contrast_security_incidentalert",
        "status": "OPEN",
        "related_rules": [
            "sql-injection"
        ],
        "recommended_actions": [
            "\t\t\t{{#paragraph}}The most effective method of stopping SQL injection attacks is to only use an\n\t{{#link}}http://en.wikipedia.org/wiki/Object-relational_mapping$$LINK_DELIM$$Object-Relational Mapping{{/link}} (ORM)\n\tlike\n\t{{#link}}http://www.hibernate.org$$LINK_DELIM$$Hibernate{{/link}}\n\tthat safely handles database interaction. If you must execute queries manually, use\n\n\t{{#link}}http://docs.oracle.com/javase/6/docs/api/java/sql/CallableStatement.html$$LINK_DELIM$$CallableStatement{{/link}}\n\n\t(for stored procedures) and\n\n\t{{#link}}http://docs.oracle.com/javase/6/docs/api/java/sql/PreparedStatement.html$$LINK_DELIM$$PreparedStatement{{/link}}\n\n\t(for normal queries). Both of these APIs utilize bind variables. Both techniques completely stop the injection of code if used properly.\n\tYou must still avoid concatenating untrusted supplied input to queries and use the binding pattern to keep untrusted input from being\n\tmisinterpreted as SQL code.{{/paragraph}}\n\n\t{{#paragraph}}Here's an example of an {{#badParam}}unsafe{{/badParam}} query:{{/paragraph}}\n\t{{#javaBlock}}\n\tString user = request.getParameter(\"user\");\n\tString pass = request.getParameter(\"pass\");\n\tString query = \"SELECT user_id FROM user_data WHERE user_name = '\" + user + \"' and user_password = '\" + pass +\"'\";\n\ttry {\n\tStatement statement = connection.createStatement( );\n\tResultSet results = statement.executeQuery( query ); // Unsafe!\n\t}{{/javaBlock}}\n\n\t{{#paragraph}}Here's an example of the same query, made {{#goodParam}}safe{{/goodParam}} with PreparedStatement:{{/paragraph}}\n\t{{#javaBlock}}String user = request.getParameter(\"user\");\n\tString pass = request.getParameter(\"pass\");\n\tString query = \"SELECT user_id FROM user_data WHERE user_name = ? and user_password = ?\";\n\ttry {\n\tPreparedStatement pstmt = connection.prepareStatement( query );\n\tpstmt.setString( 1, user );\n\tpstmt.setString( 2, pass );\n\tpstmt.execute(); // Safe!\n\t}{{/javaBlock}}\n\n\t{{#paragraph}}\n\tThere are some scenarios, like dynamic search, that make it difficult to use parameterized queries because the order and quantity\n\tof variables is not predetermined. If you are unable to avoid building such a SQL call on the fly, then validation and escaping all\n\tuntrusted data is necessary. Deciding which characters to escape depends on the database in use and the context into which the untrusted\n\tdata is being placed.{{/paragraph}}\n\n\t{{#paragraph}}This is difficult to do by hand, but luckily the {{#link}}https://www.owasp.org/index.php/ESAPI$$LINK_DELIM$$ESAPI library{{/link}} offers such functionality. Here's an example of safely encoding a dynamically built statement for an Oracle database using untrusted data:{{/paragraph}}\n\t{{#javaBlock}}\n\tCodec ORACLE_CODEC = new OracleCodec();\n\tString user = req.getParameter(\"user\");\n\tString pass = req.getParameter(\"pass\");\n\tString query = \"SELECT user_id FROM user_data WHERE user_name = '\" +\n\tESAPI.encoder().encodeForSQL( ORACLE_CODEC, **user**) + \"' and user_password = '\" +\n\tESAPI.encoder().encodeForSQL( ORACLE_CODEC, **pass**) + \"'\";{{/javaBlock}}\n\n\t{{#paragraph}}\n\tIf your user data needs to enter the logic of the query, rather than the data of the query. For example controlling the order the data is returned in a ORDER BY Field.\n\t{{/paragraph}}\n\n\t{{#javaBlock}}\n\tString userType = request.getParameter(\"userType\");\n\tString orderBy = request.getParameter(\"orderBy\");\n\tString query = \"+;\n\ttry {\n\tPreparedStatement preparedStatement = con.prepareStatement(\"select email,first_name,last_name from tbl_employees where user_type = ? ORDER BY \"+ orderBy+\";\");\n\tpreparedStatement.setString(userType);\n\tResultSet results = preparedStatement.executeQuery();\n\t}\n\t{{/javaBlock}}\n\tThis cannot be set in a parameterised field and SQL Sanitisers like {{#code}}ESAPI.encoder().encodeForSQL(){{/code}} are not sufficient. The safest way is to create a white list of allowed column names. For example :\n\n\t{{#javaBlock}}\n\tString userType = request.getParameter(\"userType\");\n\tString orderBy = request.getParameter(\"orderBy\");\n\tString query = \"+;\n\ttry {\n\tPreparedStatement preparedStatement = con.prepareStatement(\"select email,first_name,last_name from tbl_employees where user_type = ? ORDER BY \"+ ColumnMapping.valueOf(orderBy).getColumnName()+\";\");\n\tpreparedStatement.setString(userType);\n\tResultSet results = preparedStatement.executeQuery();\n\t}\n\t...\n\tenum ColumnMapping {\n\tFIRSTNAME(\"first_name\"),\n\tLASTNAME(\"last_name\"),\n\tAGE(\"age\");\n\n\tprivate String columnName;\n\n\tColumnMapping(String columnName) {\n\tthis.columnName = columnName;\n\t}\n\n\tpublic String getColumnName() {\n\treturn columnName;\n\t}\n\n\t}\n\t{{/javaBlock}}\n\n\n\t\n\t\n{{#paragraph}}It's also helpful to ensure that the application is granted only the minimum database privileges necessary to perform its function. This may help reduce the impact of a successful SQL injection attack. At a minimum, access to powerful database APIs that interact with the operating or file systems should be revoked.{{/paragraph}}"
        ],
        "http_source_ip": [
            {
                "blocked": true,
                "ipAddress": "81.2.69.142",
                "count": "1"
            },
            {
                "blocked": false,
                "ipAddress": "81.2.69.144",
                "count": "1"
            },
            {
                "blocked": true,
                "ipAddress": "89.160.20.112",
                "count": "1"
            }
        ],
        "servers": [
            {
                "hostname": "webgoat-ns-demo2",
                "environment": "QA",
                "id": "e4f8dcfc-0c41-4e7d-8dcf-234a79fb1a51",
                "operatingSystem": "OS"
            },
            {
                "hostname": "webgoat-ns-demo3",
                "environment": "QA",
                "id": "8ac57a83-e8b6-47df-ae81-11e2f1b73706"
            }
        ],
        "issue_ids": [
            "ISS-2025-6"
        ]
    },
    "cloud": {},
    "service": {},
    "source": {
        "ip": "81.2.69.142"
    }
}
Exported fields
| Field | Description | Type |
|---|---|---|
| @timestamp | Date/time when the event originated. This is the date/time extracted from the event, typically representing when the event was generated by the source. If the event source has no original timestamp, this value is typically populated by the first time the event was received by the pipeline. Required field for all events. | date |
| contrast_security.event_type | Contrast event type discriminator (e.g. contrast_security_incidentalert). | keyword |
| contrast_security.http_source_ip.blocked | Whether Contrast blocked traffic from this source IP. | boolean |
| contrast_security.http_source_ip.count | Number of attack events observed from this source IP. | keyword |
| contrast_security.http_source_ip.ipAddress | Source IP address observed in the incident. | ip |
| contrast_security.issue_ids | Contrast issue identifiers associated with the incident. | keyword |
| contrast_security.recommended_actions | Contrast remediation guidance for the incident, as templated runbook text. | text |
| contrast_security.related_rules | Contrast rule names involved in the incident. | keyword |
| contrast_security.servers.environment | Deployment environment of the affected server. | keyword |
| contrast_security.servers.hostname | Hostname of the affected server. | keyword |
| contrast_security.servers.id | Contrast server identifier. | keyword |
| contrast_security.servers.operatingSystem | Operating system of the affected server. | keyword |
| contrast_security.status | Incident lifecycle status as reported by Contrast (e.g. OPEN, CLOSED). | keyword |
| data_stream.dataset | The field can contain anything that makes sense to signify the source of the data. Examples include nginx.access, prometheus, endpoint etc. For data streams that otherwise fit, but that do not have dataset set we use the value "generic" for the dataset value. event.dataset should have the same value as data_stream.dataset. Beyond the Elasticsearch data stream naming criteria noted above, the dataset value has additional restrictions: * Must not contain - * No longer than 100 characters |
constant_keyword |
| data_stream.namespace | A user defined namespace. Namespaces are useful to allow grouping of data. Many users already organize their indices this way, and the data stream naming scheme now provides this best practice as a default. Many users will populate this field with default. If no value is used, it falls back to default. Beyond the Elasticsearch index naming criteria noted above, namespace value has the additional restrictions: * Must not contain - * No longer than 100 characters |
constant_keyword |
| data_stream.type | An overarching type for the data stream. Currently allowed values are "logs" and "metrics". We expect to also add "traces" and "synthetics" in the near future. | constant_keyword |
| ecs.version | ECS version this event conforms to. ecs.version is a required field and must exist in all events. When querying across multiple indices -- which may conform to slightly different ECS versions -- this field lets integrations adjust to the schema version of the events. |
keyword |
| event.action | The action captured by the event. This describes the information in the event. It is more specific than event.category. Examples are group-add, process-started, file-created. The value is normally defined by the implementer. |
keyword |
| event.category | This is one of four ECS Categorization Fields, and indicates the second level in the ECS category hierarchy. event.category represents the "big buckets" of ECS categories. For example, filtering on event.category:process yields all events relating to process activity. This field is closely related to event.type, which is used as a subcategory. This field is an array. This will allow proper categorization of some events that fall in multiple categories. |
keyword |
| event.created | event.created contains the date/time when the event was first read by an agent, or by your pipeline. This field is distinct from @timestamp in that @timestamp typically contain the time extracted from the original event. In most situations, these two timestamps will be slightly different. The difference can be used to calculate the delay between your source generating an event, and the time when your agent first processed it. This can be used to monitor your agent's or pipeline's ability to keep up with your event source. In case the two timestamps are identical, @timestamp should be used. |
date |
| event.dataset | Name of the dataset. If an event source publishes more than one type of log or events (e.g. access log, error log), the dataset is used to specify which one the event comes from. It's recommended but not required to start the dataset name with the module name, followed by a dot, then the dataset name. | constant_keyword |
| event.end | event.end contains the date when the event ended or when the activity was last observed. |
date |
| event.id | Unique ID to describe the event. | keyword |
| event.kind | This is one of four ECS Categorization Fields, and indicates the highest level in the ECS category hierarchy. event.kind gives high-level information about what type of information the event contains, without being specific to the contents of the event. For example, values of this field distinguish alert events from metric events. The value of this field can be used to inform how these kinds of events should be handled. They may warrant different retention, different access control, it may also help understand whether the data is coming in at a regular interval or not. |
keyword |
| event.module | Name of the module this data is coming from. If your monitoring agent supports the concept of modules or plugins to process events of a given source (e.g. Apache logs), event.module should contain the name of this module. |
constant_keyword |
| event.provider | Source of the event. Event transports such as Syslog or the Windows Event Log typically mention the source of an event. It can be the name of the software that generated the event (e.g. Sysmon, httpd), or of a subsystem of the operating system (kernel, Microsoft-Windows-Security-Auditing). | keyword |
| event.reason | Reason why this event happened, according to the source. This describes the why of a particular action or outcome captured in the event. Where event.action captures the action from the event, event.reason describes why that action was taken. For example, a web proxy with an event.action which denied the request may also populate event.reason with the reason why (e.g. blocked site). |
keyword |
| event.risk_score | Risk score or priority of the event (e.g. security solutions). Use your system's original value here. | float |
| event.severity | The numeric severity of the event according to your event source. What the different severity values mean can be different between sources and use cases. It's up to the implementer to make sure severities are consistent across events from the same source. The Syslog severity belongs in log.syslog.severity.code. event.severity is meant to represent the severity according to the event source (e.g. firewall, IDS). If the event source does not publish its own severity, you may optionally copy the log.syslog.severity.code to event.severity. |
long |
| event.type | This is one of four ECS Categorization Fields, and indicates the third level in the ECS category hierarchy. event.type represents a categorization "sub-bucket" that, when used along with the event.category field values, enables filtering events down to a level appropriate for single visualization. This field is an array. This will allow proper categorization of some events that fall in multiple event types. |
keyword |
| event.url | URL linking to an external system to continue investigation of this event. This URL links to another system where in-depth investigation of the specific occurrence of this event can take place. Alert events, indicated by event.kind:alert, are a common use case for this field. |
keyword |
| message | For log events the message field contains the log message, optimized for viewing in a log viewer. For structured logs without an original message field, other fields can be concatenated to form a human-readable summary of the event. If multiple messages exist, they can be combined into one message. | match_only_text |
| observer.product | The product name of the observer. | keyword |
| observer.type | The type of the observer the data is coming from. There is no predefined list of observer types. Some examples are forwarder, firewall, ids, ips, proxy, poller, sensor, APM server. |
keyword |
| observer.vendor | Vendor name of the observer. | keyword |
| organization.id | Unique identifier for the organization. | keyword |
| rule.category | A categorization value keyword used by the entity using the rule for detection of this event. | keyword |
| rule.name | The name of the rule or signature generating the event. | keyword |
| rule.reference | Reference URL to additional information about the rule used to generate this event. The URL can point to the vendor's documentation about the rule. If that's not available, it can also be a link to a more general page describing this type of alert. | keyword |
| rule.ruleset | Name of the ruleset, policy, group, or parent category in which the rule used to generate this event is a member. | keyword |
| source.ip | IP address of the source (IPv4 or IPv6). | ip |
This is the issue dataset.
Example
{
    "@timestamp": "2026-02-06T16:00:14.223Z",
    "message": "SQL Injection from \"user_input\" Parameter on \"/vulnpy/sqli/sqlite3-executescript/\" page",
    "labels": {
        "test": "yes"
    },
    "observer": {
        "vendor": "Contrast Security",
        "product": "Contrast ADR",
        "type": "adr"
    },
    "ecs": {
        "version": "9.1"
    },
    "rule": {
        "category": "Application Vulnerability",
        "ruleset": "Contrast ADR",
        "name": "sql-injection"
    },
    "event": {
        "kind": "alert",
        "category": [
            "vulnerability"
        ],
        "type": [
            "info"
        ],
        "dataset": "contrast_security.issue",
        "module": "contrast_security",
        "provider": "Contrast Security",
        "id": "ISS-24",
        "reason": "Issue Updated Score",
        "url": "https://test.contrast.com/Contrast/cs/index.html#/4a3ba5b0-0553-42d1-823b-963ab4669631/issues/ISS-24",
        "reference": "INC-2025-1007,INC-2025-1022,INC-2025-1031,INC-2025-1038,INC-2025-1045,INC-2025-1048,INC-2025-1049",
        "action": "issue_updated",
        "created": "2026-02-06T16:00:14.223Z"
    },
    "vulnerability": {
        "description": "We tracked the following data from \"user_input\" Parameter:\nGET /vulnpy/sqli/sqlite3-executescript/?user_input=%27hacker%27%2C%27hacker%27%29%2C%28%27hacker%27\n\nuser_input='hacker','hacker'),('hacker'\n\n...which was accessed within the following code:\nvulnpy.trigger.sqli.py, line 59, in executescript()\n\n...and ended up in this database query:\nINSERT INTO Character VALUES (''hacker','hacker'),('hacker'', '1'); SELECT 0",
        "severity": "critical",
        "score": {
            "base": 9.3
        }
    },
    "service": {
        "id": "c8c090e1-84d1-4fbe-946c-0110c93e765a",
        "name": "vulnpy-protect-app1",
        "type": "",
        "environment": "development"
    },
    "url": {
        "path": "/vulnpy/sqli/sqlite3-executescript/"
    },
    "organization": {
        "id": "4a3ba5b0-0553-42d1-823b-963ab4669631"
    },
    "contrast_security": {
        "event_type": "contrast_security_issuealert",
        "status": "OPEN",
        "last_observed": "2026-02-06T16:00:14.223Z",
        "cvss_vector": "CVSS:4.0/AV:N/AC:L/AT:N/PR:N/UI:N/VC:H/VI:H/VA:H/SC:H/SI:H/SA:H/E:A",
        "emit_time": "2026-06-18T16:14:10.955596Z",
        "environments": [
            "DEVELOPMENT"
        ]
    },
    "cloud": {}
}
Exported fields
| Field | Description | Type |
|---|---|---|
| @timestamp | Date/time when the event originated. This is the date/time extracted from the event, typically representing when the event was generated by the source. If the event source has no original timestamp, this value is typically populated by the first time the event was received by the pipeline. Required field for all events. | date |
| contrast_security.cvss_vector | CVSS vector string describing the vulnerability (e.g. CVSS:4.0/AV:N/...). | keyword |
| contrast_security.emit_time | Time the Contrast platform emitted this issue alert. | date |
| contrast_security.environments | Deployment environments reported by Contrast for the issue (full list; service.environment carries the first, lowercased). | keyword |
| contrast_security.event_type | Contrast event type discriminator (e.g. contrast_security_issuealert). | keyword |
| contrast_security.last_observed | Time the vulnerability was last observed by Contrast. | date |
| contrast_security.status | Issue lifecycle status as reported by Contrast (e.g. OPEN, CLOSED). | keyword |
| data_stream.dataset | The field can contain anything that makes sense to signify the source of the data. Examples include nginx.access, prometheus, endpoint etc. For data streams that otherwise fit, but that do not have dataset set we use the value "generic" for the dataset value. event.dataset should have the same value as data_stream.dataset. Beyond the Elasticsearch data stream naming criteria noted above, the dataset value has additional restrictions: * Must not contain - * No longer than 100 characters |
constant_keyword |
| data_stream.namespace | A user defined namespace. Namespaces are useful to allow grouping of data. Many users already organize their indices this way, and the data stream naming scheme now provides this best practice as a default. Many users will populate this field with default. If no value is used, it falls back to default. Beyond the Elasticsearch index naming criteria noted above, namespace value has the additional restrictions: * Must not contain - * No longer than 100 characters |
constant_keyword |
| data_stream.type | An overarching type for the data stream. Currently allowed values are "logs" and "metrics". We expect to also add "traces" and "synthetics" in the near future. | constant_keyword |
| ecs.version | ECS version this event conforms to. ecs.version is a required field and must exist in all events. When querying across multiple indices -- which may conform to slightly different ECS versions -- this field lets integrations adjust to the schema version of the events. |
keyword |
| event.action | The action captured by the event. This describes the information in the event. It is more specific than event.category. Examples are group-add, process-started, file-created. The value is normally defined by the implementer. |
keyword |
| event.category | This is one of four ECS Categorization Fields, and indicates the second level in the ECS category hierarchy. event.category represents the "big buckets" of ECS categories. For example, filtering on event.category:process yields all events relating to process activity. This field is closely related to event.type, which is used as a subcategory. This field is an array. This will allow proper categorization of some events that fall in multiple categories. |
keyword |
| event.created | event.created contains the date/time when the event was first read by an agent, or by your pipeline. This field is distinct from @timestamp in that @timestamp typically contain the time extracted from the original event. In most situations, these two timestamps will be slightly different. The difference can be used to calculate the delay between your source generating an event, and the time when your agent first processed it. This can be used to monitor your agent's or pipeline's ability to keep up with your event source. In case the two timestamps are identical, @timestamp should be used. |
date |
| event.dataset | Name of the dataset. If an event source publishes more than one type of log or events (e.g. access log, error log), the dataset is used to specify which one the event comes from. It's recommended but not required to start the dataset name with the module name, followed by a dot, then the dataset name. | constant_keyword |
| event.id | Unique ID to describe the event. | keyword |
| event.kind | This is one of four ECS Categorization Fields, and indicates the highest level in the ECS category hierarchy. event.kind gives high-level information about what type of information the event contains, without being specific to the contents of the event. For example, values of this field distinguish alert events from metric events. The value of this field can be used to inform how these kinds of events should be handled. They may warrant different retention, different access control, it may also help understand whether the data is coming in at a regular interval or not. |
keyword |
| event.module | Name of the module this data is coming from. If your monitoring agent supports the concept of modules or plugins to process events of a given source (e.g. Apache logs), event.module should contain the name of this module. |
constant_keyword |
| event.provider | Source of the event. Event transports such as Syslog or the Windows Event Log typically mention the source of an event. It can be the name of the software that generated the event (e.g. Sysmon, httpd), or of a subsystem of the operating system (kernel, Microsoft-Windows-Security-Auditing). | keyword |
| event.reason | Reason why this event happened, according to the source. This describes the why of a particular action or outcome captured in the event. Where event.action captures the action from the event, event.reason describes why that action was taken. For example, a web proxy with an event.action which denied the request may also populate event.reason with the reason why (e.g. blocked site). |
keyword |
| event.reference | Reference URL linking to additional information about this event. This URL links to a static definition of this event. Alert events, indicated by event.kind:alert, are a common use case for this field. |
keyword |
| event.type | This is one of four ECS Categorization Fields, and indicates the third level in the ECS category hierarchy. event.type represents a categorization "sub-bucket" that, when used along with the event.category field values, enables filtering events down to a level appropriate for single visualization. This field is an array. This will allow proper categorization of some events that fall in multiple event types. |
keyword |
| event.url | URL linking to an external system to continue investigation of this event. This URL links to another system where in-depth investigation of the specific occurrence of this event can take place. Alert events, indicated by event.kind:alert, are a common use case for this field. |
keyword |
| labels | Custom key/value pairs. Can be used to add meta information to events. Should not contain nested objects. All values are stored as keyword. Example: docker and k8s labels. |
object |
| message | For log events the message field contains the log message, optimized for viewing in a log viewer. For structured logs without an original message field, other fields can be concatenated to form a human-readable summary of the event. If multiple messages exist, they can be combined into one message. | match_only_text |
| observer.product | The product name of the observer. | keyword |
| observer.type | The type of the observer the data is coming from. There is no predefined list of observer types. Some examples are forwarder, firewall, ids, ips, proxy, poller, sensor, APM server. |
keyword |
| observer.vendor | Vendor name of the observer. | keyword |
| organization.id | Unique identifier for the organization. | keyword |
| rule.category | A categorization value keyword used by the entity using the rule for detection of this event. | keyword |
| rule.name | The name of the rule or signature generating the event. | keyword |
| rule.ruleset | Name of the ruleset, policy, group, or parent category in which the rule used to generate this event is a member. | keyword |
| service.environment | Identifies the environment where the service is running. If the same service runs in different environments (production, staging, QA, development, etc.), the environment can identify other instances of the same service. Can also group services and applications from the same environment. | keyword |
| service.id | Unique identifier of the running service. If the service is comprised of many nodes, the service.id should be the same for all nodes. This id should uniquely identify the service. This makes it possible to correlate logs and metrics for one specific service, no matter which particular node emitted the event. Note that if you need to see the events from one specific host of the service, you should filter on that host.name or host.id instead. |
keyword |
| service.name | Name of the service data is collected from. The name of the service is normally user given. This allows for distributed services that run on multiple hosts to correlate the related instances based on the name. In the case of Elasticsearch the service.name could contain the cluster name. For Beats the service.name is by default a copy of the service.type field if no name is specified. |
keyword |
| service.type | The type of the service data is collected from. The type can be used to group and correlate logs and metrics from one service type. Example: If logs or metrics are collected from Elasticsearch, service.type would be elasticsearch. |
keyword |
| url.path | Path of the request, such as "/search". | wildcard |
| vulnerability.description | The description of the vulnerability that provides additional context of the vulnerability. For example (https://cve.mitre.org/about/faqs.html#cve_entry_descriptions_created) | keyword |
| vulnerability.description.text | Multi-field of vulnerability.description. |
match_only_text |
| vulnerability.score.base | Scores can range from 0.0 to 10.0, with 10.0 being the most severe. Base scores cover an assessment for exploitability metrics (attack vector, complexity, privileges, and user interaction), impact metrics (confidentiality, integrity, and availability), and scope. For example (https://www.first.org/cvss/specification-document) | float |
| vulnerability.severity | The severity of the vulnerability can help with metrics and internal prioritization regarding remediation. For example (https://nvd.nist.gov/vuln-metrics/cvss) | keyword |
This integration includes one or more Kibana dashboards that visualizes the data collected by the integration. The screenshots below illustrate how the ingested data is displayed.
Changelog
| Version | Details | Minimum Kibana version |
|---|---|---|
| 0.1.0 | Enhancement (View pull request) Initial release of the Contrast Security integration with attack_event, incident, and issue data streams. |
9.1.0 8.19.0 |