AWS SQS Metrics OpenTelemetry Assets
| Version | 0.12.0
|
| Subscription level What's this? |
Basic |
| Developed by What's this? |
Elastic |
| Minimum Kibana version(s) | 9.5.0 |
To use pre-release integrations, go to the Integrations page in Kibana, scroll down, and toggle on the Display beta integrations option.
This package contains Kibana assets for monitoring SQS queues with AWS CloudWatch metrics collected by the OpenTelemetry Collector.
The package is content only. It provides a curated metrics dashboard, but it does not configure data collection. Use the AWS CloudWatch OpenTelemetry Input Package (aws_cloudwatch_input_otel) to configure the OpenTelemetry Collector CloudWatch receiver and collect the required AWS service metrics into Elasticsearch.
- CloudWatch metrics collected by the OpenTelemetry Collector AWS CloudWatch receiver.
- Documents indexed into the
metrics-aws.sqs.otel-*data stream. - The relevant AWS dimensions for this service, such as resource name, region, and service-specific identifiers.
Requires Kibana ^9.5.0.
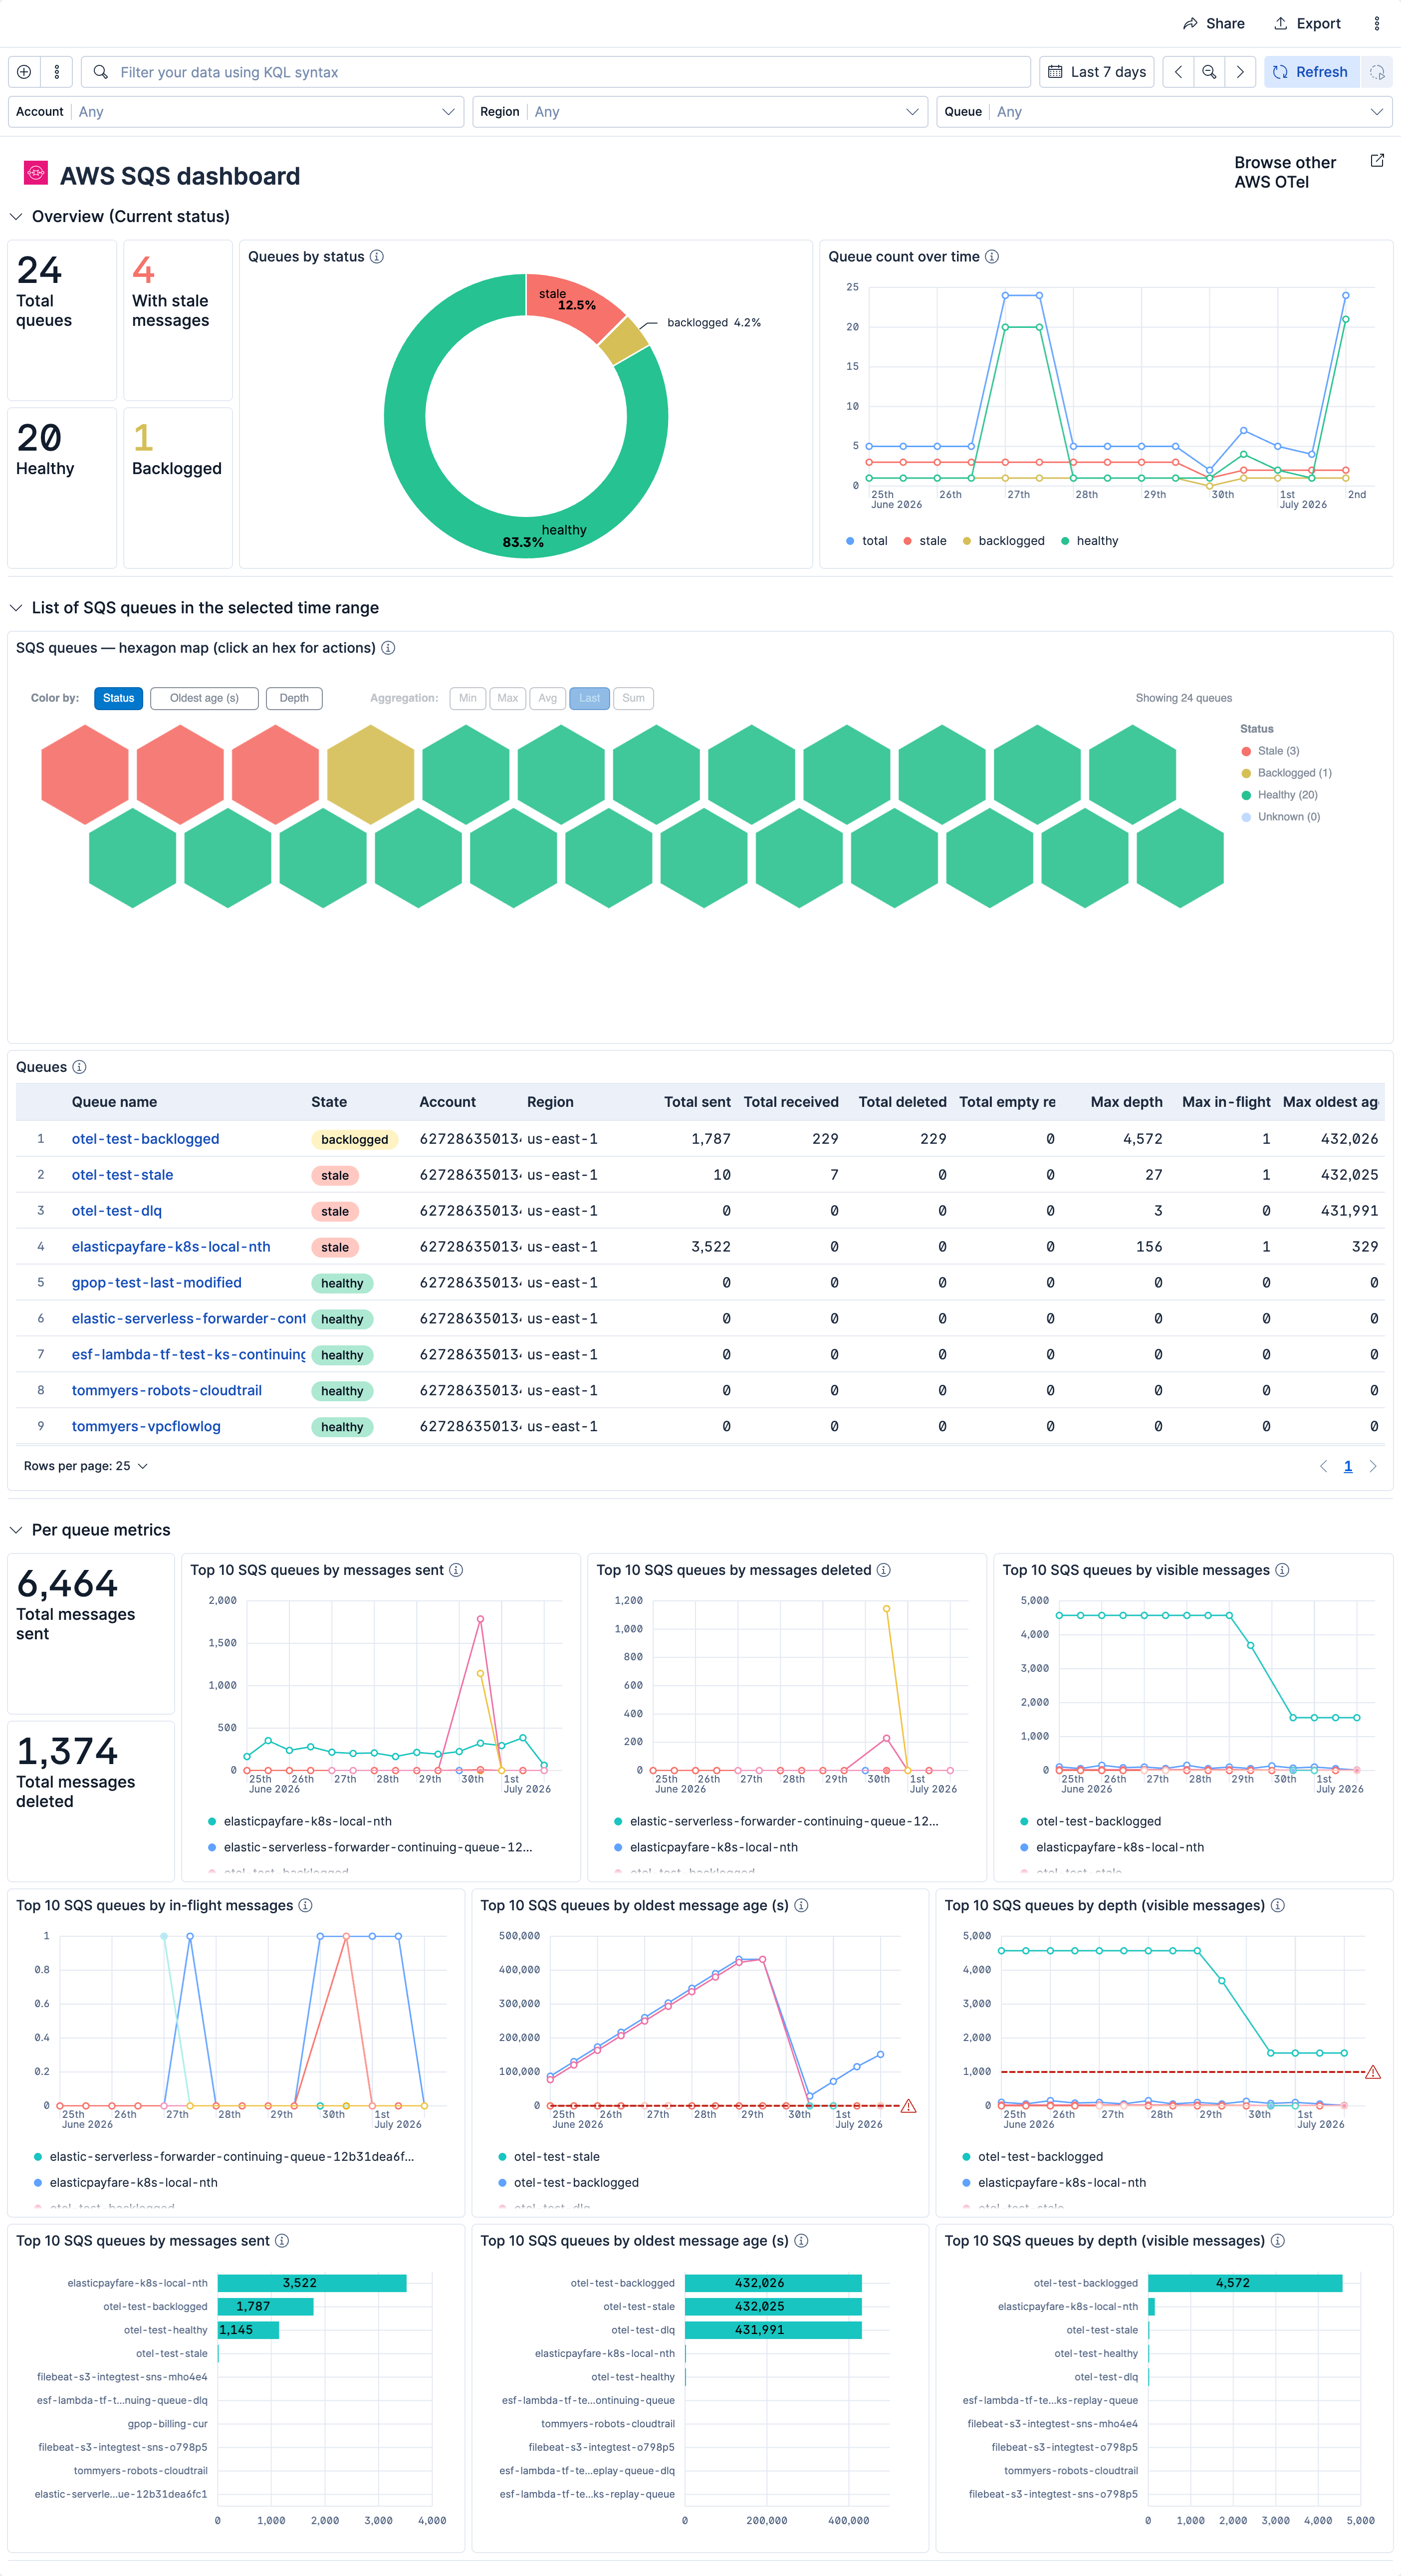
This package includes one pre-built Kibana dashboard:
| Name | Description |
|---|---|
| [AWS SQS OTel] Metrics | AWS SQS dashboard for CloudWatch metrics collected by the OpenTelemetry Collector. |
Alert rule templates provide pre-defined configurations for creating alert rules in Kibana.
For more information, refer to the Elastic documentation.
Alert rule templates require Elastic Stack version 9.2.0 or later.
The following alert rule templates are available:
View the alert rule templates
| Name | Description |
|---|---|
| [AWS SQS OTel] DLQ has messages | Alerts when any dead-letter queue has one or more visible messages. Any message in a DLQ represents a processing failure and warrants immediate investigation. |
| [AWS SQS OTel] High backlog | Alerts when a queue's visible message backlog stays above the configured depth across the evaluation window, indicating consumers are not keeping up with producers. Pair with the oldest-message-age alert/SLO, which captures processing lag directly. |
| [AWS SQS OTel] In-flight saturation | Alerts when in-flight messages approach the standard-queue limit (~120,000), indicating stuck consumers or processing bottlenecks. |
| [AWS SQS OTel] Oldest message age high | Alerts when the oldest unprocessed message on a queue exceeds a configurable age threshold. This is the headline SQS processing-lag signal. |
| [AWS SQS OTel] Producer send rate drop | Alerts when a queue's message send rate drops below the configured minimum, indicating producer slowdown or failure. Requires threshold tuning to match your expected baseline send rate. |
SLO templates provide pre-defined configurations for creating SLOs in Kibana.
For more information, refer to the Elastic documentation.
SLO templates require Elastic Stack version 9.4.0 or later.
The following SLO templates are available:
View the SLO templates
| Name | Description |
|---|---|
| [AWS SQS OTel] DLQ empty 99.5% rolling 30 days | Tracks dead-letter queue correctness: 99.5% of 1-minute intervals must show zero visible messages on DLQ queues (QueueName matching *dlq*). Any message in a DLQ represents a processing failure and dropped work — the primary SQS error signal. Adjust the QueueName pattern if your DLQ naming convention differs. |
| [AWS SQS OTel] Oldest message age 99.5% rolling 30 days | Tracks processing freshness per queue: 99.5% of 1-minute intervals must show maximum oldest-message age below 300 seconds on non-DLQ queues. ApproximateAgeOfOldestMessage is the headline SQS timeliness signal — sustained elevation means consumers are falling behind. Threshold is workload-dependent and should be tuned per queue SLA. |
This integration includes one or more Kibana dashboards that visualizes the data collected by the integration. The screenshots below illustrate how the ingested data is displayed.
Changelog
| Version | Details | Minimum Kibana version |
|---|---|---|
| 0.12.0 | Bug fix (View pull request) Replace the deprecated popout icon with external so dashboard navigation cards render correctly. |
9.5.0 |
| 0.11.0 | Enhancement (View pull request) Add ML anomaly detection module for SQS queue backlog, in-flight, and oldest-message age. Enhancement (View pull request) Add ml_module to the Kibana asset tags. |
9.5.0 |
| 0.10.0 | Enhancement (View pull request) Add missing recommended alert for producer send rate drop. |
9.5.0 |
| 0.9.0 | Enhancement (View pull request) Add tags to Kibana assets |
9.5.0 |
| 0.8.1 | Enhancement (View pull request) Rename the dashboard to "[AWS SQS OTel] Metrics". |
9.5.0 |
| 0.8.0 | Enhancement (View pull request) Remove the idle status and map "no data" to "Unknown" across SQS dashboard panels. |
9.5.0 |
| 0.7.0 | Enhancement (View pull request) Improve ESQL queries in dashboards |
9.5.0 |
| 0.6.0 | Enhancement (View pull request) Add _dev/build/docs/README.md |
9.5.0 |
| 0.5.0 | Enhancement (View pull request) Improve dashboard queries and visualizations |
9.5.0 |
| 0.4.0 | Enhancement (View pull request) Update aggregation functions and replace backlog-growth alert with high-backlog. |
9.5.0 |
| 0.3.0 | Enhancement (View pull request) Add alert rules and SLOs to README |
9.5.0 |
| 0.2.1 | Enhancement (View pull request) Standardize the package title and description to the AWS <service> <signal> OpenTelemetry Assets naming convention. |
9.5.0 |
| 0.2.0 | Enhancement (View pull request) Create new SLO and Alert assets |
9.5.0 |
| 0.1.0 | Enhancement (View pull request) Initial AWS SQS OpenTelemetry metrics dashboard package |
9.5.0 |