HiperAI SecureAI
| Version | 1.0.0 (View all) |
| Subscription level What's this? |
Basic |
| Developed by What's this? |
Partner |
| Ingestion method(s) | Webhook |
| Minimum Kibana version(s) | 9.1.0 8.19.0 |
The HiperAI SecureAI integration for Elastic enables you to monitor and analyze security events from SecureAI, an enterprise security, data loss prevention (DLP), and governance platform for generative AI and large language model (LLM) workflows. This integration collects authentication activity, AI model usage, policy enforcement decisions, DLP triggers, and audit logs, so you can correlate AI-specific security events with the rest of your enterprise telemetry in Elastic Security.
This integration is compatible with SecureAI version 1.1.x and later. SecureAI must be able to reach the Elastic Agent HTTP listener over the network to deliver events.
SecureAI pushes security events to Elastic rather than Elastic polling SecureAI. The integration starts an HTTP listener on an Elastic Agent using the http_endpoint input, and you configure the SecureAI Elastic SIEM integration to send events to that listener as JSON over HTTP.
Every request must carry a shared secret in a header that you choose, and the listener rejects requests that do not present the expected value. Received events are normalized to the Elastic Common Schema (ECS) by the integration's ingest pipeline, which sets event categorization, maps the SecureAI severity label to the Elastic severity scale, and enriches source IP addresses with geolocation and autonomous system data. Platform-specific values that have no ECS equivalent are preserved under the hiperai.* namespace.
The HiperAI SecureAI integration collects security and governance events from the SecureAI platform in the events data stream, including:
- Authentication activity: successful and failed logins, and session termination.
- AI model usage: chat completions, API requests, and data access events.
- Policy enforcement: DLP and security policy violations, prompt injection detections, and security incidents.
- SMLTP governance: Secure Model Link Transport Protocol policy violations, enforcement actions, and entitlement denials.
- Administrative activity: configuration changes, audit logs, and billing or usage events.
You choose which of these categories SecureAI forwards, in the SecureAI console.
- AI usage monitoring: track which users and applications are calling which models, and correlate that activity with the rest of your security telemetry.
- Data loss prevention for AI: investigate attempts to send personally identifiable information (PII), protected health information (PHI), credentials, or confidential data to AI models.
- Governance and policy enforcement: audit SMLTP policy decisions and model entitlement denials.
- Threat detection: detect prompt injection attempts and other adversarial activity against AI workflows.
- Compliance and audit: retain an auditable record of AI interactions and administrative changes.
You need the following Elastic components:
- An Elastic Stack deployment, either self-managed or on Elastic Cloud.
- An Elastic Agent enrolled in Fleet, installed on a host that SecureAI can reach over the network.
- A port on that host that is reachable from SecureAI, and open in any firewall between the two. The integration listens on port
8089by default.
You also need the following on the SecureAI side:
- A SecureAI deployment running version 1.1.x or later.
- An administrator account with access to the SecureAI console, to configure the Elastic SIEM integration.
This integration receives data through an HTTP listener on an Elastic Agent, so the agent must be installed before you configure SecureAI. Agentless deployment is not supported, because SecureAI must be able to reach a listener that you control.
Follow these steps in Kibana:
- Navigate to Management > Integrations.
- Search for and select HiperAI SecureAI.
- Click Add HiperAI SecureAI.
- Configure the listener:
- Listen Port: the port the agent listens on. The default is
8089. - URL Path: the path the listener accepts requests on. The default is
/hiperai/events. - Secret Header: the name of the HTTP header that carries the shared secret, for example
Authorization. - Secret Value: the value the listener requires in that header. For API key authentication, use the format
ApiKey <base64-encoded-key>. - TLS/SSL Configuration (optional, under advanced options): serve the listener over HTTPS. Configure this whenever SecureAI reaches the agent over an untrusted network.
- Listen Port: the port the agent listens on. The default is
- Select the agent policy to deploy to, and click Save and continue.
Then configure the delivery side in SecureAI:
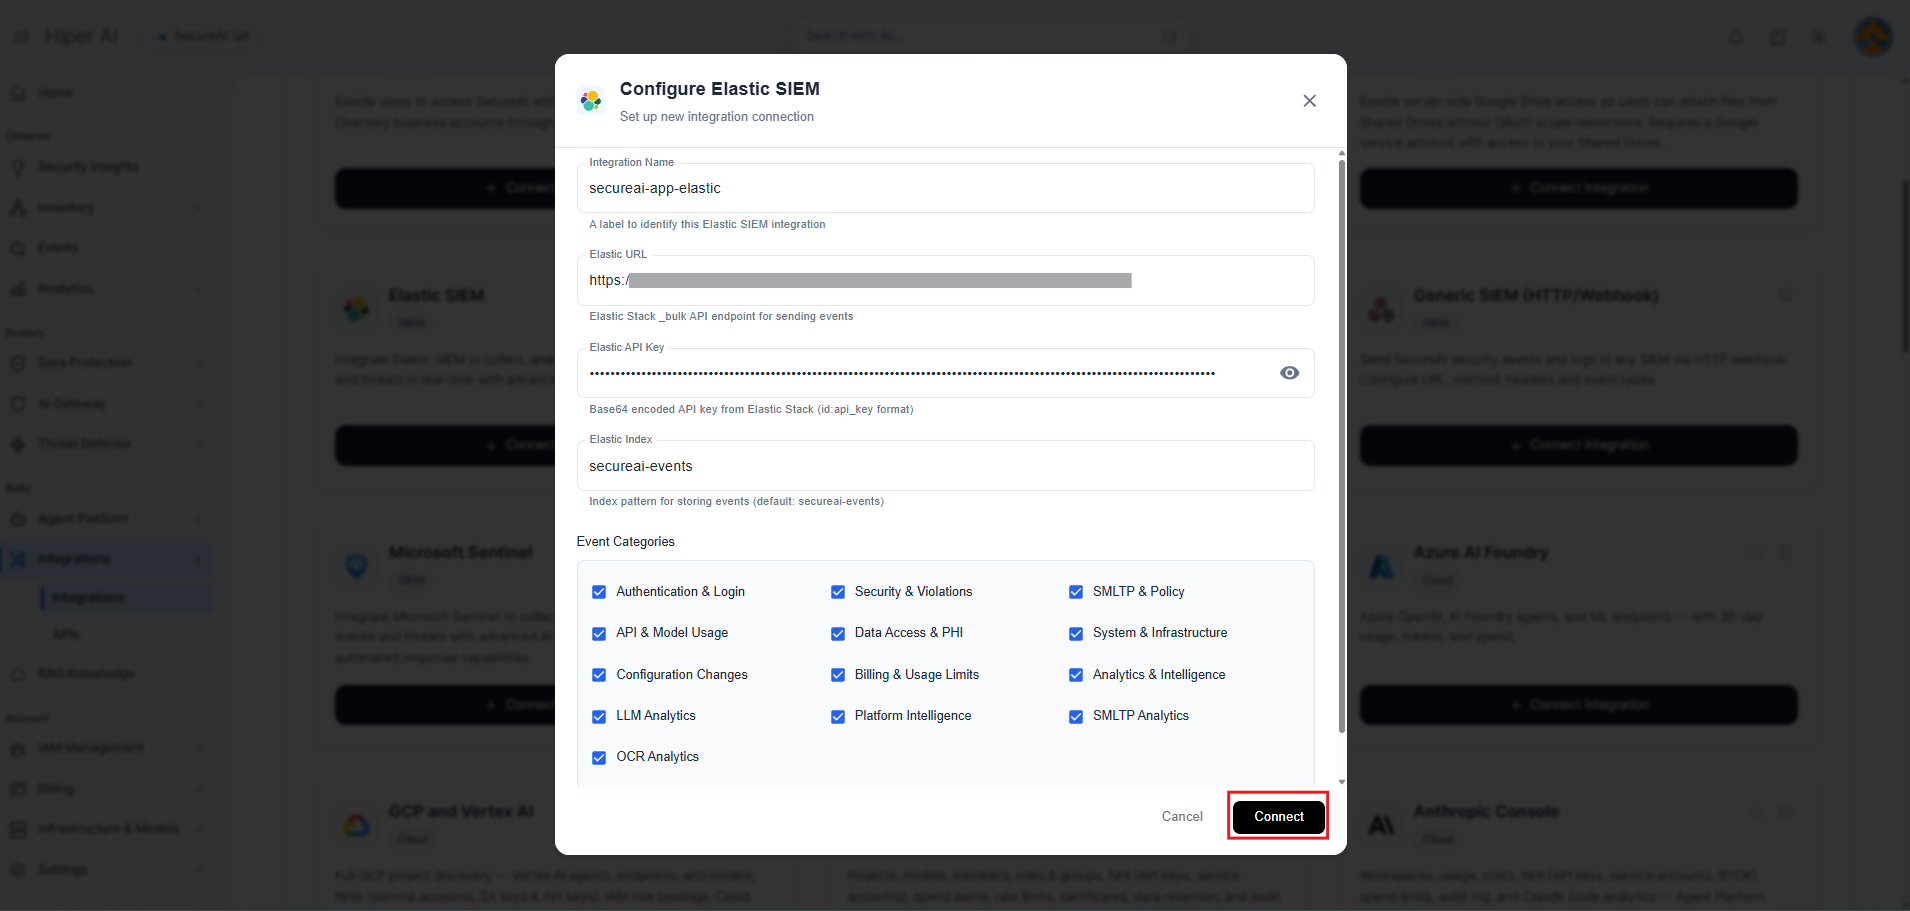
- In the SecureAI console, navigate to Integrations and select the Elastic SIEM integration.
- Set the destination URL to the Elastic Agent listener, including the URL path you configured, for example
http://<agent-host>:8089/hiperai/events. - Set the authentication header to the Secret Header and Secret Value you configured in step 4. Both are required, and SecureAI must send this header on every request.
- Select the event categories you want to forward.
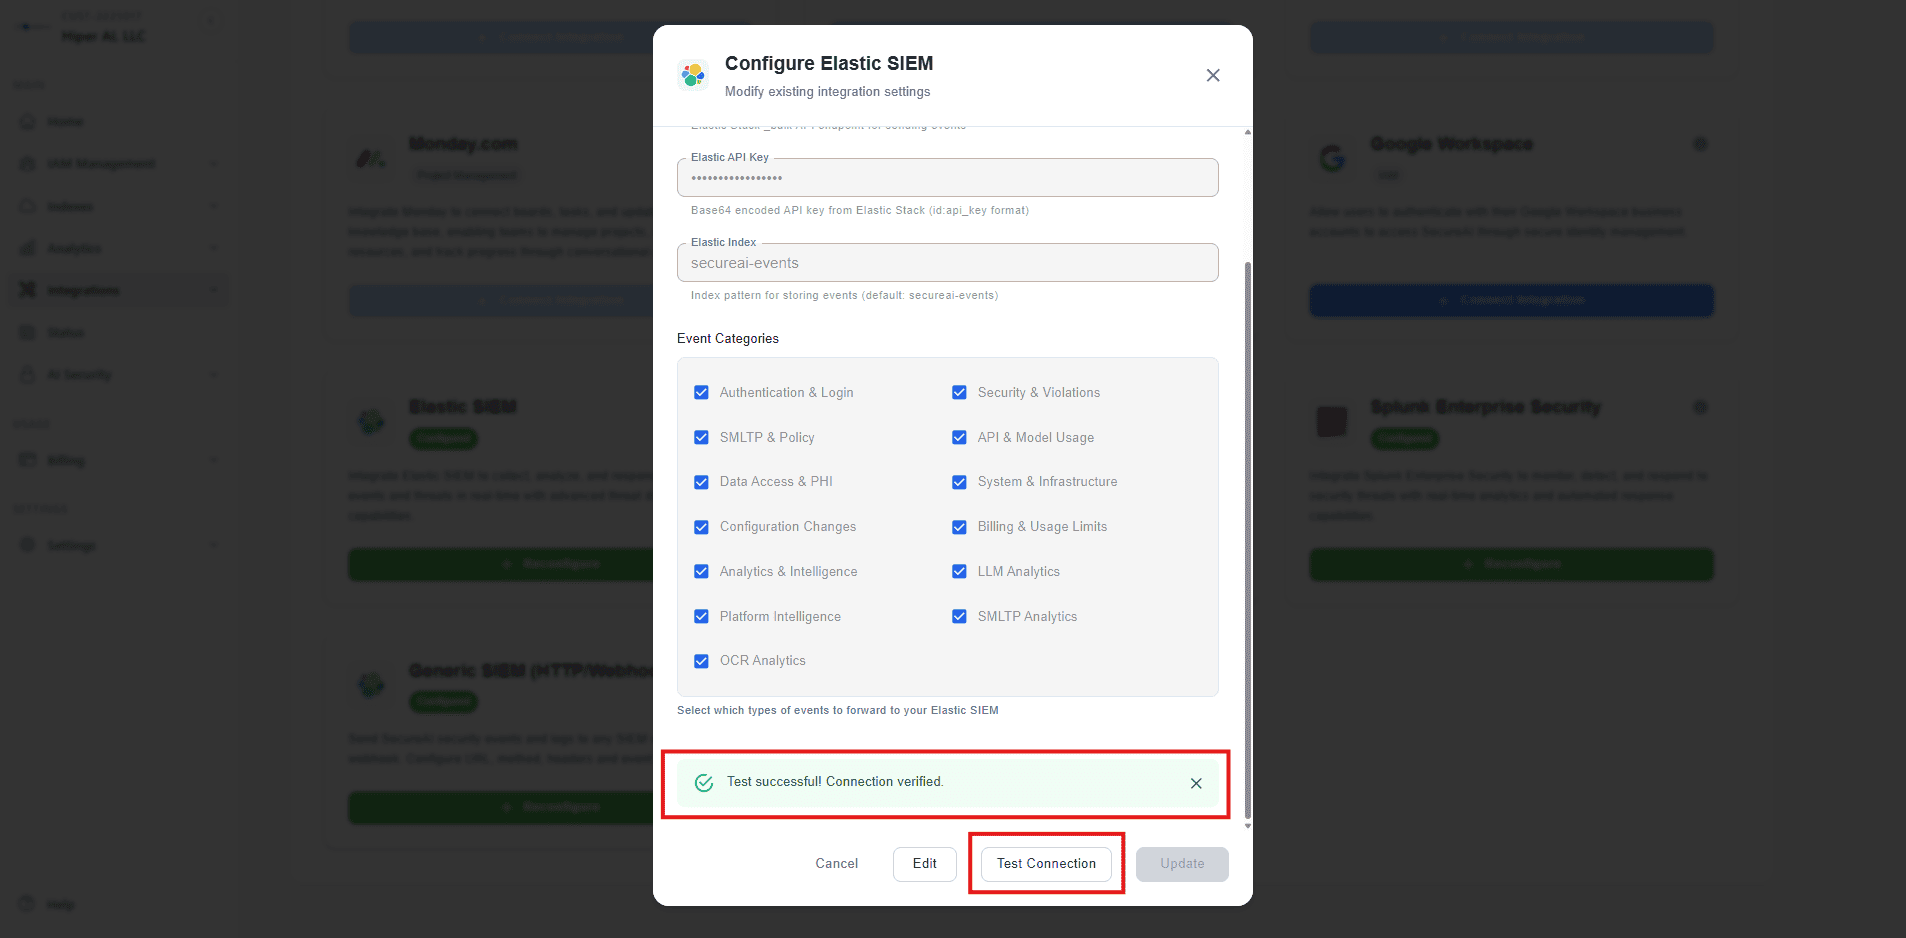
- Click Test Connection, then save the configuration.
SecureAI can also write events directly to Elasticsearch instead of going through an Elastic Agent. In this mode you still install this integration's assets, because the index template, ingest pipeline, and field mappings are what normalize the events. Configure SecureAI with your Elasticsearch endpoint, an API key with write privileges for the logs-hiperai.events-* indices, and the index logs-hiperai.events-default.
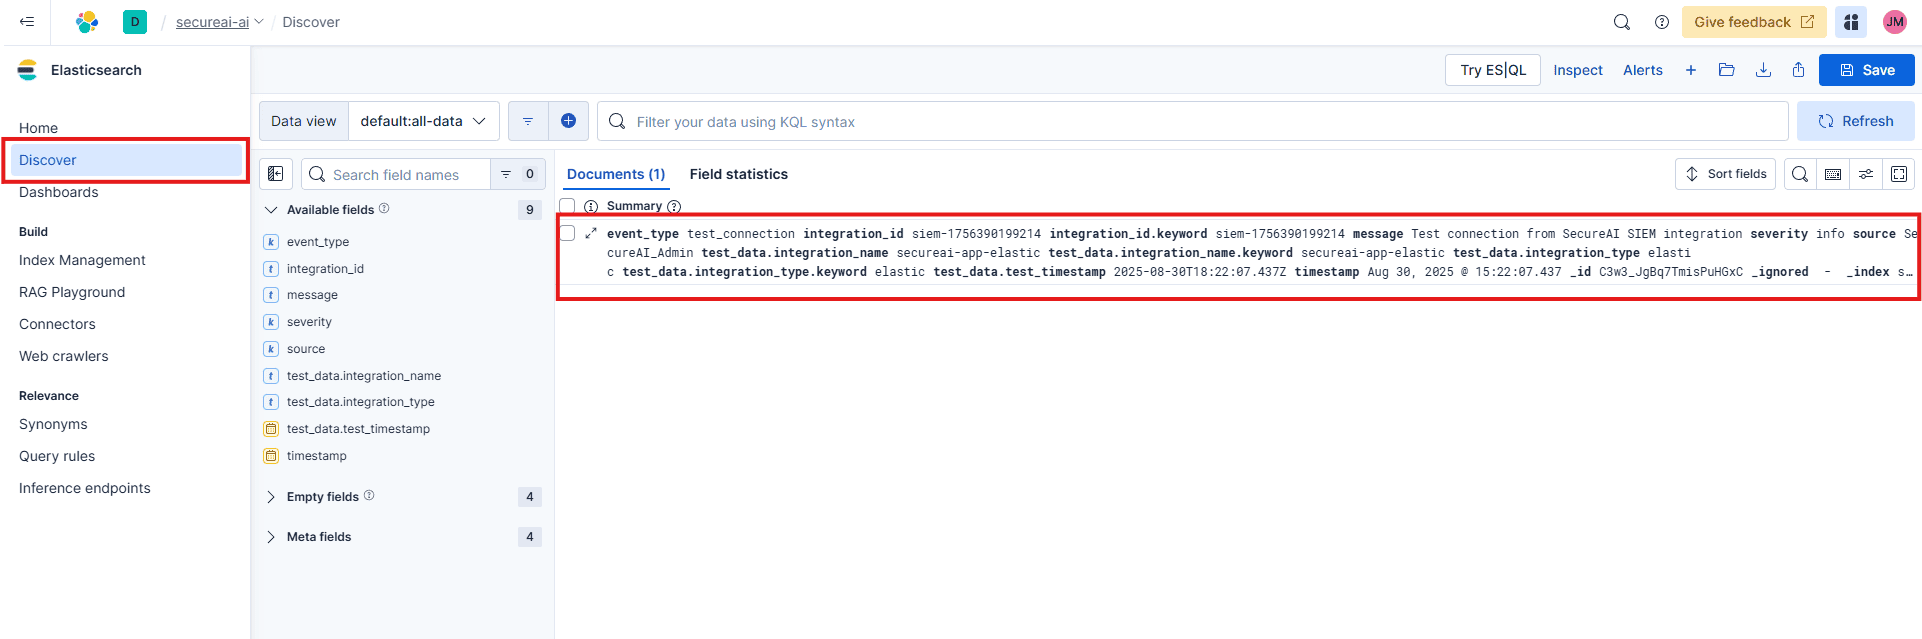
To confirm that events are arriving and are being processed correctly:
- In the SecureAI console, click Test Connection in the Elastic SIEM integration settings, or generate activity such as a login.
- In Kibana, navigate to Analytics > Discover.
- Select the
logs-*data view and filter with the following KQL query:data_stream.dataset : "hiperai.events". - Confirm that documents contain normalized fields such as
event.category,event.action,event.severity, and the SecureAI-specifichiperai.*fields.
For help with Elastic ingest tools, check Common problems.
If events do not appear in Elasticsearch:
- Confirm the listener is reachable from SecureAI. From a host on the same network, send a test request to
http://<agent-host>:<port>/<url-path>and confirm it is not blocked by a firewall or security group. - Confirm the secret matches. If SecureAI sends a header value that differs from Secret Value, or omits the header, the listener rejects the request. SecureAI reports this as a failed connection test.
- Confirm the URL path matches. A request sent to the host and port but to a different path than URL Path is not accepted.
- Check the Elastic Agent logs for the
http_endpointinput, which reports binding failures such as a port already in use. - Confirm that the port is not already claimed by another integration on the same agent. Each HTTP listener on a host needs its own port.
If events arrive but fields are missing or wrong:
- Check for documents where
event.kindispipeline_error, and readerror.messageto see which processor failed. - Confirm SecureAI is sending the event types you expect. Events whose type and category are both unrecognized are still ingested, but they are not categorized.
For further assistance with SecureAI, refer to the HiperAI SecureAI documentation.
For more information on architectures that can be used for scaling this integration, check the Ingest Architectures documentation.
Consider the following when planning a deployment:
- Event volume is controlled at the source. Select only the event categories you need in the SecureAI console. Analytics categories in particular can be high volume and are rarely needed for security investigations.
- Scale out by adding listeners. Because delivery is push-based, you scale by running the integration on additional agents and distributing SecureAI's delivery across them, typically behind a load balancer that terminates TLS.
- The listener applies backpressure. If Elasticsearch slows down, the agent stops accepting new requests, and SecureAI retries according to its own delivery settings.
These inputs can be used with this integration:
http_endpoint
For more details about the HTTP Endpoint input settings, check the Filebeat documentation.
To collect logs via HTTP Endpoint, select Collect logs via HTTP Endpoint and configure the following parameters:
- Listen Address: Bind address for the HTTP listener. Use 0.0.0.0 to listen on all interfaces.
- Listen port: Bind port for the listener.
SecureAI forwards the following event types, which the integration maps to ECS categories:
| Event type | ECS category | Description |
|---|---|---|
login_success |
authentication |
Successful user authentication |
login_failed |
authentication |
Failed authentication attempt |
logout |
session |
User session ended |
chat_completion |
api |
AI model chat completion request |
api_request |
api |
API request processed |
policy_violation |
intrusion_detection |
DLP or security policy violated |
security_incident |
intrusion_detection |
Security incident detected |
smltp_violation |
intrusion_detection |
SMLTP policy violation |
smltp_policy_applied |
intrusion_detection |
SMLTP policy enforcement action |
smltp_entitlement_denied |
intrusion_detection |
Model access denied by entitlement |
audit_log |
configuration |
Administrative or audit action |
data_access |
api |
Data access event |
billing_event |
api |
Billing or usage event |
An event whose type is not listed above is categorized from its SecureAI category instead.
SecureAI severity labels are mapped to event.severity using the Elastic severity scale, so values are comparable with other integrations:
| SecureAI severity | ECS event.severity |
|---|---|
info |
21 |
low |
21 |
medium |
47 |
high |
73 |
critical |
99 |
The events data stream collects all security, governance, and audit events forwarded by the SecureAI platform.
Example
{
    "@timestamp": "2026-09-01T14:30:00.000Z",
    "agent": {
        "ephemeral_id": "ee259cd7-adc3-4d60-bafb-e6c552e06419",
        "id": "7dce5cdd-391d-4434-9900-de09925e1f07",
        "name": "elastic-agent-75207",
        "type": "filebeat",
        "version": "8.19.0"
    },
    "data_stream": {
        "dataset": "hiperai.events",
        "namespace": "98546",
        "type": "logs"
    },
    "ecs": {
        "version": "9.3.0"
    },
    "elastic_agent": {
        "id": "7dce5cdd-391d-4434-9900-de09925e1f07",
        "snapshot": false,
        "version": "8.19.0"
    },
    "event": {
        "action": "login_success",
        "agent_id_status": "verified",
        "category": [
            "authentication"
        ],
        "dataset": "hiperai.events",
        "ingested": "2026-09-22T09:19:52Z",
        "kind": "event",
        "module": "hiperai",
        "original": "{\"action\":\"login_success\",\"activity\":{\"compliance_category\":\"authentication\",\"description\":\"User logged in successfully via SSO\",\"outcome\":\"success\",\"severity\":\"info\",\"type\":\"login_success\"},\"actor\":{\"ip_address\":\"198.51.100.10\",\"user_id\":\"usr-001\",\"username\":\"analyst@example.com\"},\"category\":\"authentication\",\"event_type\":\"login_success\",\"ip\":\"198.51.100.10\",\"message\":\"User logged in successfully\",\"metadata\":{\"auth_method\":\"sso_google\",\"tenant_id\":\"tenant-001\"},\"session_id\":\"sess-abc123\",\"severity\":\"info\",\"source\":\"SecureAI\",\"timestamp\":\"2026-09-01T14:30:00.000Z\",\"user\":\"analyst@example.com\",\"user_agent\":\"Mozilla/5.0 (Windows NT 10.0; Win64; x64) AppleWebKit/537.36 (KHTML, like Gecko) Chrome/120.0.0.0 Safari/537.36\"}",
        "outcome": "success",
        "provider": "secureai",
        "severity": 21,
        "type": [
            "start"
        ]
    },
    "hiperai": {
        "action": "login_success",
        "activity": {
            "compliance_category": "authentication",
            "description": "User logged in successfully via SSO",
            "outcome": "success",
            "severity": "info",
            "type": "login_success"
        },
        "category": "authentication",
        "metadata": {
            "auth_method": "sso_google",
            "tenant_id": "tenant-001"
        },
        "session_id": "sess-abc123",
        "severity": "info"
    },
    "input": {
        "type": "http_endpoint"
    },
    "message": "User logged in successfully",
    "observer": {
        "product": "SecureAI",
        "type": "ai_security_gateway",
        "vendor": "HiperAI"
    },
    "related": {
        "ip": [
            "198.51.100.10"
        ],
        "user": [
            "analyst@example.com"
        ]
    },
    "source": {
        "as": {
            "number": 64501,
            "organization": {
                "name": "Documentation ASN"
            }
        },
        "geo": {
            "city_name": "Amsterdam",
            "continent_name": "Europe",
            "country_iso_code": "NL",
            "country_name": "Netherlands",
            "location": {
                "lat": 52.37404,
                "lon": 4.88969
            },
            "region_iso_code": "NL-NH",
            "region_name": "North Holland"
        },
        "ip": "198.51.100.10"
    },
    "tags": [
        "preserve_original_event",
        "forwarded",
        "hiperai-secureai"
    ],
    "user": {
        "id": "usr-001",
        "name": "analyst@example.com"
    },
    "user_agent": {
        "device": {
            "name": "Other"
        },
        "name": "Chrome",
        "original": "Mozilla/5.0 (Windows NT 10.0; Win64; x64) AppleWebKit/537.36 (KHTML, like Gecko) Chrome/120.0.0.0 Safari/537.36",
        "os": {
            "full": "Windows 10",
            "name": "Windows",
            "version": "10"
        },
        "version": "120.0.0.0"
    }
}
Exported fields
| Field | Description | Type |
|---|---|---|
| @timestamp | Date/time when the event originated. This is the date/time extracted from the event, typically representing when the event was generated by the source. If the event source has no original timestamp, this value is typically populated by the first time the event was received by the pipeline. Required field for all events. | date |
| data_stream.dataset | The field can contain anything that makes sense to signify the source of the data. Examples include nginx.access, prometheus, endpoint etc. For data streams that otherwise fit, but that do not have dataset set we use the value "generic" for the dataset value. event.dataset should have the same value as data_stream.dataset. Beyond the Elasticsearch data stream naming criteria noted above, the dataset value has additional restrictions: * Must not contain - * No longer than 100 characters |
constant_keyword |
| data_stream.namespace | A user defined namespace. Namespaces are useful to allow grouping of data. Many users already organize their indices this way, and the data stream naming scheme now provides this best practice as a default. Many users will populate this field with default. If no value is used, it falls back to default. Beyond the Elasticsearch index naming criteria noted above, namespace value has the additional restrictions: * Must not contain - * No longer than 100 characters |
constant_keyword |
| data_stream.type | An overarching type for the data stream. Currently allowed values are "logs" and "metrics". We expect to also add "traces" and "synthetics" in the near future. | constant_keyword |
| ecs.version | ECS version this event conforms to. ecs.version is a required field and must exist in all events. When querying across multiple indices -- which may conform to slightly different ECS versions -- this field lets integrations adjust to the schema version of the events. |
keyword |
| error.message | Error message. | match_only_text |
| event.action | The action captured by the event. This describes the information in the event. It is more specific than event.category. Examples are group-add, process-started, file-created. The value is normally defined by the implementer. |
keyword |
| event.category | This is one of four ECS Categorization Fields, and indicates the second level in the ECS category hierarchy. event.category represents the "big buckets" of ECS categories. For example, filtering on event.category:process yields all events relating to process activity. This field is closely related to event.type, which is used as a subcategory. This field is an array. This will allow proper categorization of some events that fall in multiple categories. |
keyword |
| event.dataset | Name of the dataset. If an event source publishes more than one type of log or events (e.g. access log, error log), the dataset is used to specify which one the event comes from. It's recommended but not required to start the dataset name with the module name, followed by a dot, then the dataset name. | constant_keyword |
| event.kind | This is one of four ECS Categorization Fields, and indicates the highest level in the ECS category hierarchy. event.kind gives high-level information about what type of information the event contains, without being specific to the contents of the event. For example, values of this field distinguish alert events from metric events. The value of this field can be used to inform how these kinds of events should be handled. They may warrant different retention, different access control, it may also help understand whether the data is coming in at a regular interval or not. |
keyword |
| event.module | Name of the module this data is coming from. If your monitoring agent supports the concept of modules or plugins to process events of a given source (e.g. Apache logs), event.module should contain the name of this module. |
constant_keyword |
| event.original | Raw text message of entire event. Used to demonstrate log integrity or where the full log message (before splitting it up in multiple parts) may be required, e.g. for reindex. This field is not indexed and doc_values are disabled. It cannot be searched, but it can be retrieved from _source. If users wish to override this and index this field, please see Field data types in the Elasticsearch Reference. |
keyword |
| event.outcome | This is one of four ECS Categorization Fields, and indicates the lowest level in the ECS category hierarchy. event.outcome simply denotes whether the event represents a success or a failure from the perspective of the entity that produced the event. Note that when a single transaction is described in multiple events, each event may populate different values of event.outcome, according to their perspective. Also note that in the case of a compound event (a single event that contains multiple logical events), this field should be populated with the value that best captures the overall success or failure from the perspective of the event producer. Further note that not all events will have an associated outcome. For example, this field is generally not populated for metric events, events with event.type:info, or any events for which an outcome does not make logical sense. |
keyword |
| event.provider | Source of the event. Event transports such as Syslog or the Windows Event Log typically mention the source of an event. It can be the name of the software that generated the event (e.g. Sysmon, httpd), or of a subsystem of the operating system (kernel, Microsoft-Windows-Security-Auditing). | keyword |
| event.severity | The numeric severity of the event according to your event source. What the different severity values mean can be different between sources and use cases. It's up to the implementer to make sure severities are consistent across events from the same source. The Syslog severity belongs in log.syslog.severity.code. event.severity is meant to represent the severity according to the event source (e.g. firewall, IDS). If the event source does not publish its own severity, you may optionally copy the log.syslog.severity.code to event.severity. |
long |
| event.type | This is one of four ECS Categorization Fields, and indicates the third level in the ECS category hierarchy. event.type represents a categorization "sub-bucket" that, when used along with the event.category field values, enables filtering events down to a level appropriate for single visualization. This field is an array. This will allow proper categorization of some events that fall in multiple event types. |
keyword |
| hiperai.action | The specific action within SecureAI that triggered this event (e.g., chat_completion, login_success, smltp_violation, smltp_policy_applied, entitlement_denied). | keyword |
| hiperai.activity | Detailed activity object from SecureAI containing additional context about the event, including type, description, severity, outcome, reason, resource_id, resource_type, and compliance_category. | flattened |
| hiperai.category | SecureAI event category. One of: authentication, security, smltp, api, data_access, system, configuration, billing, analytics. | keyword |
| hiperai.metadata | Additional metadata about the event, including tenant information, model parameters, integration context, and any other contextual data provided by SecureAI. | flattened |
| hiperai.session_id | The SecureAI session identifier associated with the event. | keyword |
| hiperai.severity | SecureAI severity label. One of: info, low, medium, high, critical. | keyword |
| input.type | Type of Filebeat input. | keyword |
| message | For log events the message field contains the log message, optimized for viewing in a log viewer. For structured logs without an original message field, other fields can be concatenated to form a human-readable summary of the event. If multiple messages exist, they can be combined into one message. | match_only_text |
| observer.product | The product name of the observer. | keyword |
| observer.type | The type of the observer the data is coming from. There is no predefined list of observer types. Some examples are forwarder, firewall, ids, ips, proxy, poller, sensor, APM server. |
keyword |
| observer.vendor | Vendor name of the observer. | keyword |
| related.ip | All of the IPs seen on your event. | ip |
| related.user | All the user names or other user identifiers seen on the event. | keyword |
| source.as.number | Unique number allocated to the autonomous system. The autonomous system number (ASN) uniquely identifies each network on the Internet. | long |
| source.as.organization.name | Organization name. | keyword |
| source.as.organization.name.text | Multi-field of source.as.organization.name. |
match_only_text |
| source.geo.city_name | City name. | keyword |
| source.geo.continent_name | Name of the continent. | keyword |
| source.geo.country_iso_code | Country ISO code. | keyword |
| source.geo.country_name | Country name. | keyword |
| source.geo.location | Longitude and latitude. | geo_point |
| source.geo.region_iso_code | Region ISO code. | keyword |
| source.geo.region_name | Region name. | keyword |
| source.ip | IP address of the source (IPv4 or IPv6). | ip |
| tags | List of keywords used to tag each event. | keyword |
| user.id | Unique identifier of the user. | keyword |
| user.name | Short name or login of the user. | keyword |
| user.name.text | Multi-field of user.name. |
match_only_text |
| user_agent.device.name | Name of the device. | keyword |
| user_agent.name | Name of the user agent. | keyword |
| user_agent.original | Unparsed user_agent string. | keyword |
| user_agent.original.text | Multi-field of user_agent.original. |
match_only_text |
| user_agent.os.full | Operating system name, including the version or code name. | keyword |
| user_agent.os.full.text | Multi-field of user_agent.os.full. |
match_only_text |
| user_agent.os.name | Operating system name, without the version. | keyword |
| user_agent.os.name.text | Multi-field of user_agent.os.name. |
match_only_text |
| user_agent.os.version | Operating system version as a raw string. | keyword |
| user_agent.version | Version of the user agent. | keyword |
This integration includes one or more Kibana dashboards that visualizes the data collected by the integration. The screenshots below illustrate how the ingested data is displayed.
Changelog
| Version | Details | Minimum Kibana version |
|---|---|---|
| 1.0.0 | Enhancement (View pull request) Initial release of HiperAI SecureAI integration. |
9.1.0 8.19.0 |