Vercel OpenTelemetry Assets
| Version | 0.4.1
|
| Subscription level What's this? |
Basic |
| Developed by What's this? |
Elastic |
| Minimum Kibana version(s) | 9.4.0 |
To use pre-release integrations, go to the Integrations page in Kibana, scroll down, and toggle on the Display beta integrations option.
Vercel is a cloud platform for deploying and hosting frontend applications on a globally distributed edge network.
The Vercel OpenTelemetry assets provide dashboards for Vercel logs, audit logs, Web Analytics, and Speed Insights forwarded through Vercel Drains into an Elastic Cloud managed endpoint, covering server-side health, user experience, traffic and engagement, and team governance.
The Vercel OpenTelemetry assets have been tested with Vercel Drains delivering to the Vercel path (/inputs/vercel/_default_) of the Elastic Cloud managed endpoint.
You need Elasticsearch for storing and searching your data and Kibana for visualizing and managing it. You can use our hosted Elasticsearch Service on Elastic Cloud, which is recommended, or self-manage the Elastic Stack on your own hardware.
The managed endpoint used by these assets is available on Elastic Cloud Serverless and Elastic Cloud Hosted. It is not available for self-managed, ECE, or ECK clusters. Refer to Managed inputs.
Vercel data reaches Elasticsearch through a Vercel drain that posts to an Elastic Cloud managed endpoint. Elastic operates the endpoint, so you do not need to install or run an OpenTelemetry Collector.
Setup has three parts, done in order:
- Enable the Vercel features you want to collect.
- Gather two values from Elastic: a managed endpoint URL and an API key.
- Create the drains in Vercel using those two values.
- Logs and Audit Log: available through Vercel Drains. Log drains require a Pro or Enterprise plan. Audit Log drains require an Enterprise plan.
- Web Analytics: install and enable the @vercel/analytics SDK in your application so page views and custom events are emitted.
- Speed Insights: install and enable the @vercel/speed-insights SDK in your application so Web Vitals are collected in the browser.
You need an Elastic Cloud Serverless project or an Elastic Cloud Hosted deployment.
In Kibana, go to Add data → More → Vercel and copy the Vercel endpoint. The URL follows this pattern:
https://<managed-endpoint>/inputs/vercel/_default_
For example:
https://abc123.ingest.us-east-1.aws.elastic.cloud/inputs/vercel/_default_
Create an API key next to the endpoint in the same Add data → More → Vercel view, then copy the encoded value. Vercel sends it in an Authorization header that must use the ApiKey scheme, as described in Authentication.
Alternatively, in your Elastic Cloud Serverless project, go to Add data → Applications → OpenTelemetry. That wizard shows the endpoint and generates a pre-configured API key for you.
A Vercel drain carries a single data type, so create a separate drain for each of Logs, Audit Log, Web Analytics, and Speed Insights that you want in Elastic. All of them use the same managed endpoint URL and API key.
For each data type, in Vercel:
- Open your team Drains settings and create a drain for that data type.
- Choose Custom Endpoint as the destination.
- Set the Endpoint URL to the managed endpoint URL for Vercel, for example
https://abc123.ingest.us-east-1.aws.elastic.cloud/inputs/vercel/_default_. - Under Custom Headers, add a header named
Authorizationwith the valueApiKey <your-api-key>, for exampleAuthorization: ApiKey abc123. - Save the drain.
For Logs drains, you can also narrow which sources, environments, and sampling rates are forwarded under Additional configuration for logs. Refer to Log Drains reference.
The managed endpoint URL for Vercel is always your Elastic Cloud public endpoint plus /inputs/vercel/_default_. Do not point the drain at a self-hosted collector for these assets; the supported path is the Elastic Cloud managed endpoint.
Vercel drain payloads are decoded by the Elastic Cloud managed endpoint and written to the data streams below. Each data type has its own payload schema, documented by Vercel, and those fields are what you query in Elastic. For drain configuration on the Vercel side, see Using drains. For managed endpoint behavior, see Managed inputs.
| Signal | Data stream | Fields |
|---|---|---|
| Speed Insights | metrics-vercel.speedinsights.v1.otel-* |
Speed Insights Drains reference |
Speed Insights carries Web Vitals (LCP, INP, CLS, TTFB) and their related attributes, such as route, device, and country.
| Signal | Data stream | Fields |
|---|---|---|
| Logs | logs-vercel.logs.otel-* |
Log Drains reference |
| Audit logs | logs-vercel.auditlog.v1.otel-* |
Audit Log Drains reference |
| Web Analytics | logs-vercel.analytics.v2.otel-* |
Analytics Drains reference |
The Logs data stream holds every source selected on the drain, so it covers build output and static asset requests alongside function output from the lambda and edge runtimes. Use the Log Source filter on the Logs dashboard to focus on a single source.
To see how a payload field is indexed, open the data stream in Discover and inspect a document, or check the data stream mappings in Stack Management → Index Management.
| Dashboard | Description |
|---|---|
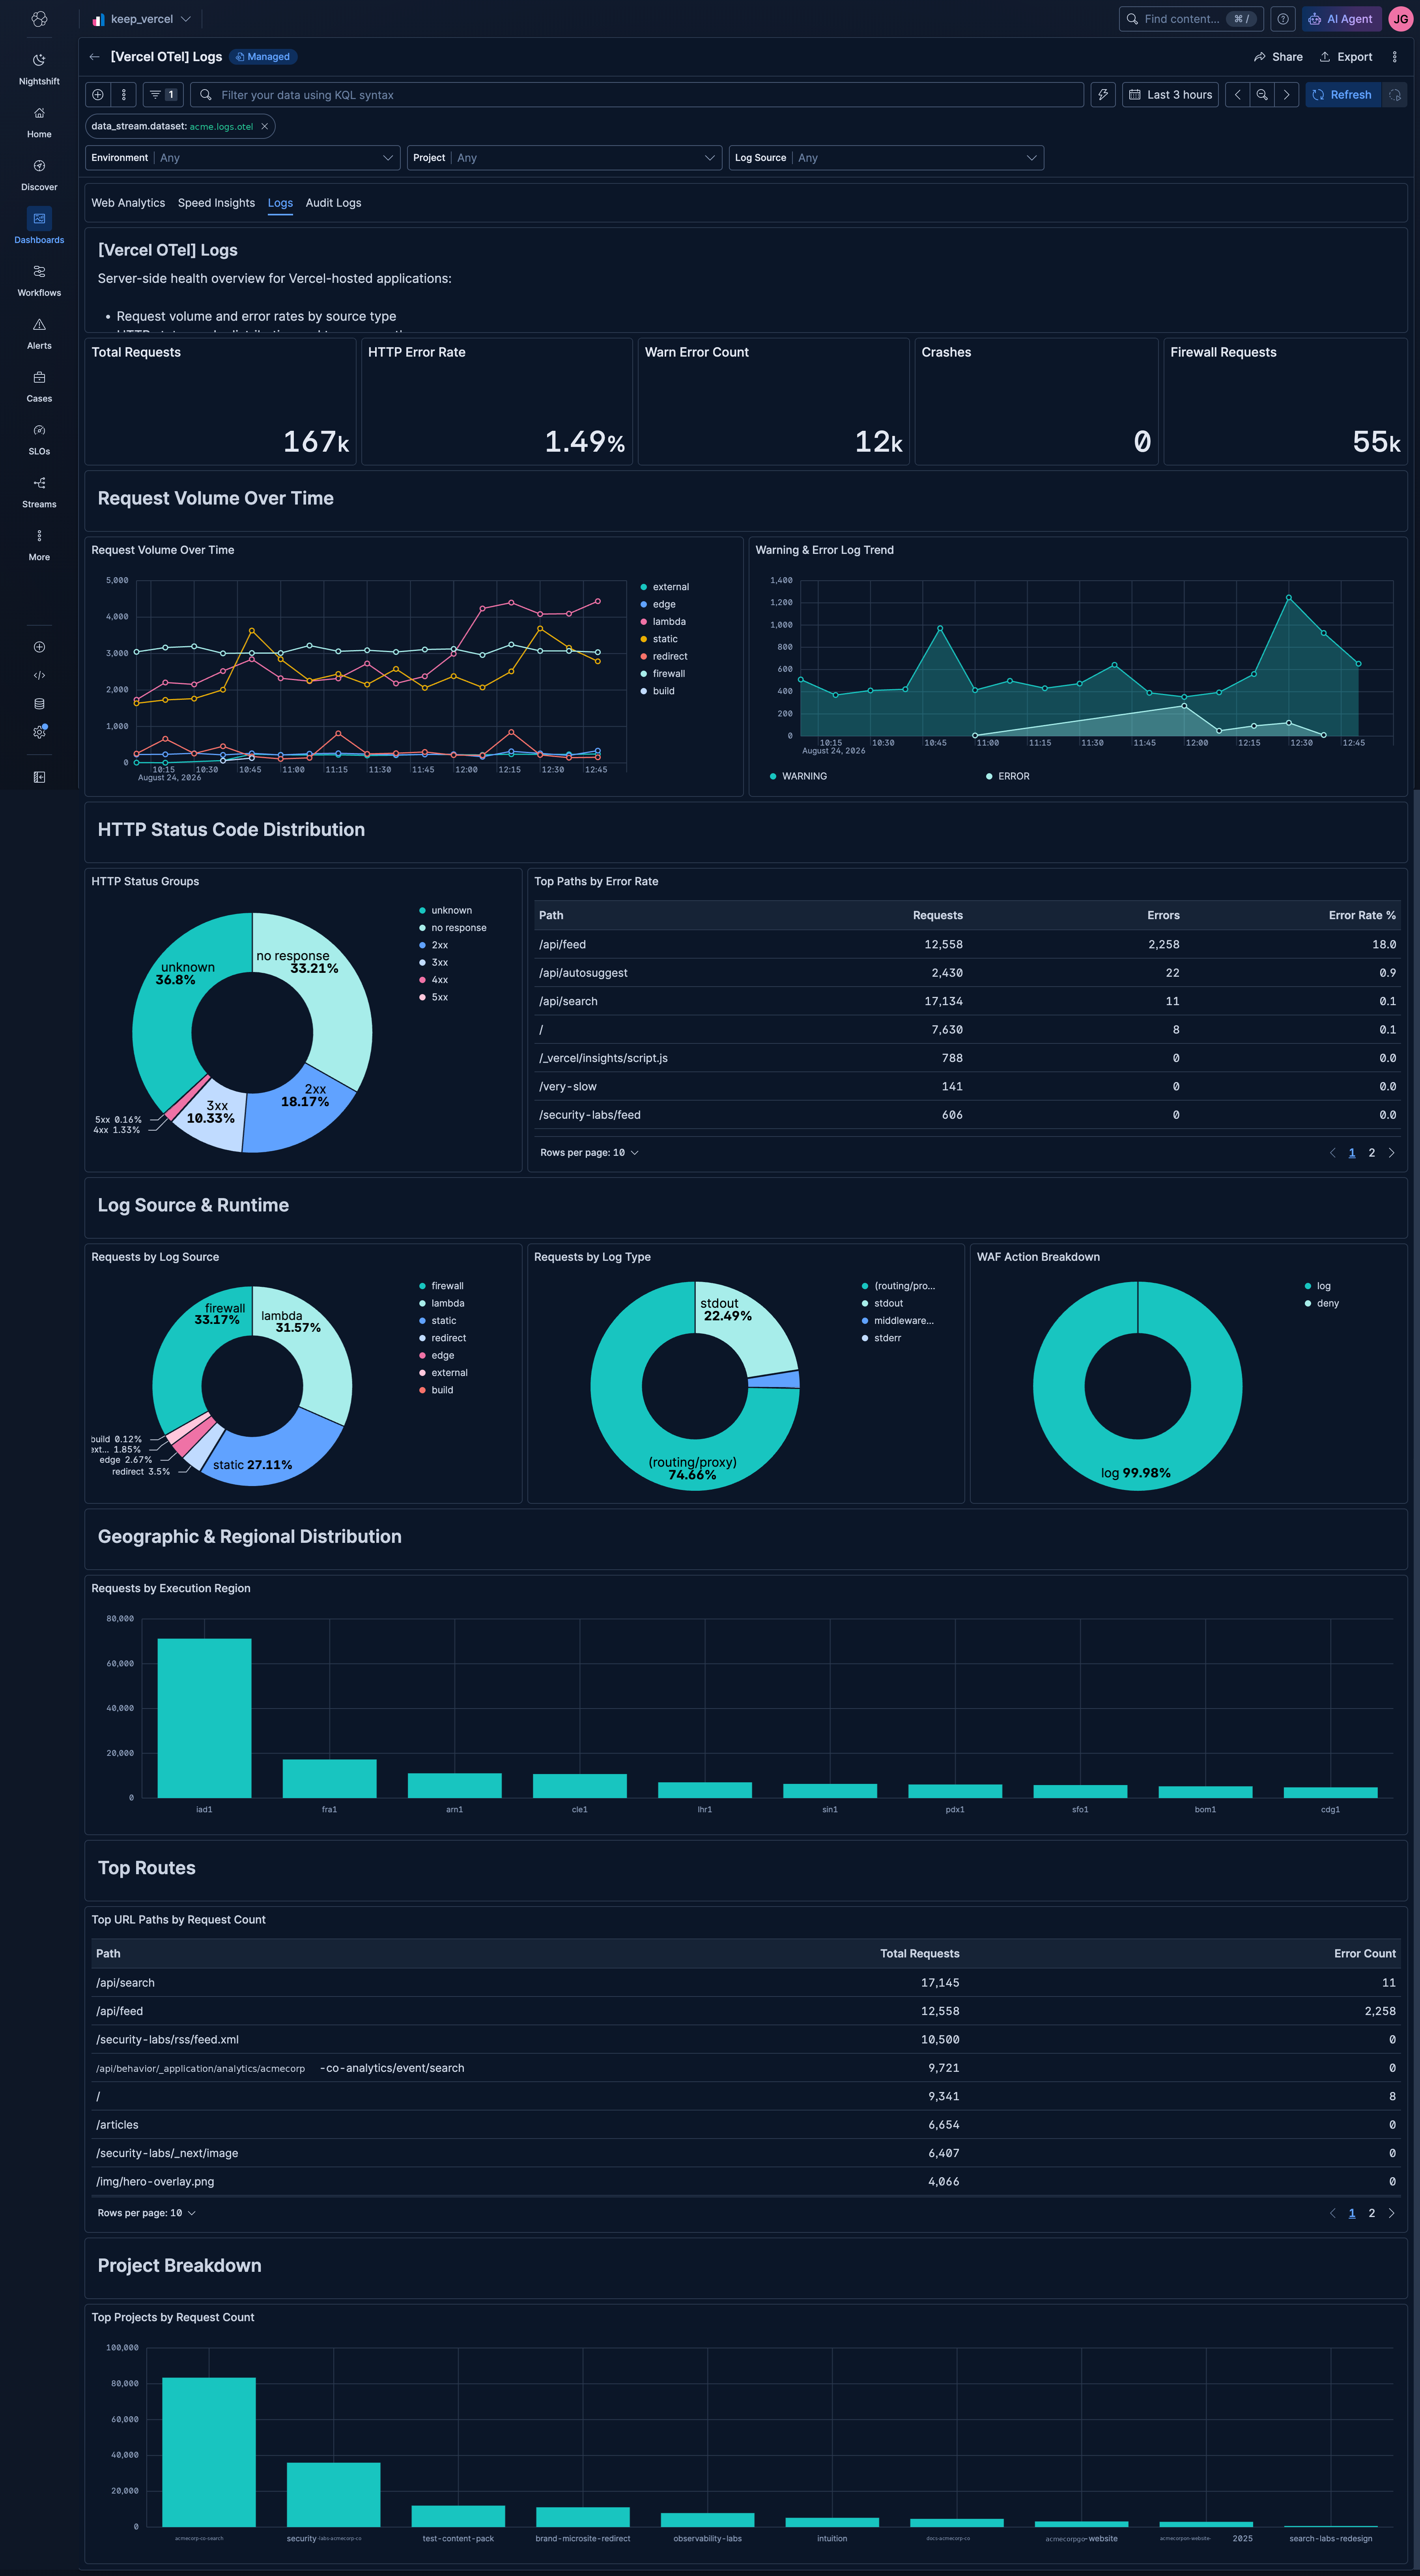
| [Vercel OTel] Logs | Server-side health overview covering request volume, error rates, HTTP status distribution, log sources, regions, and top routes. |
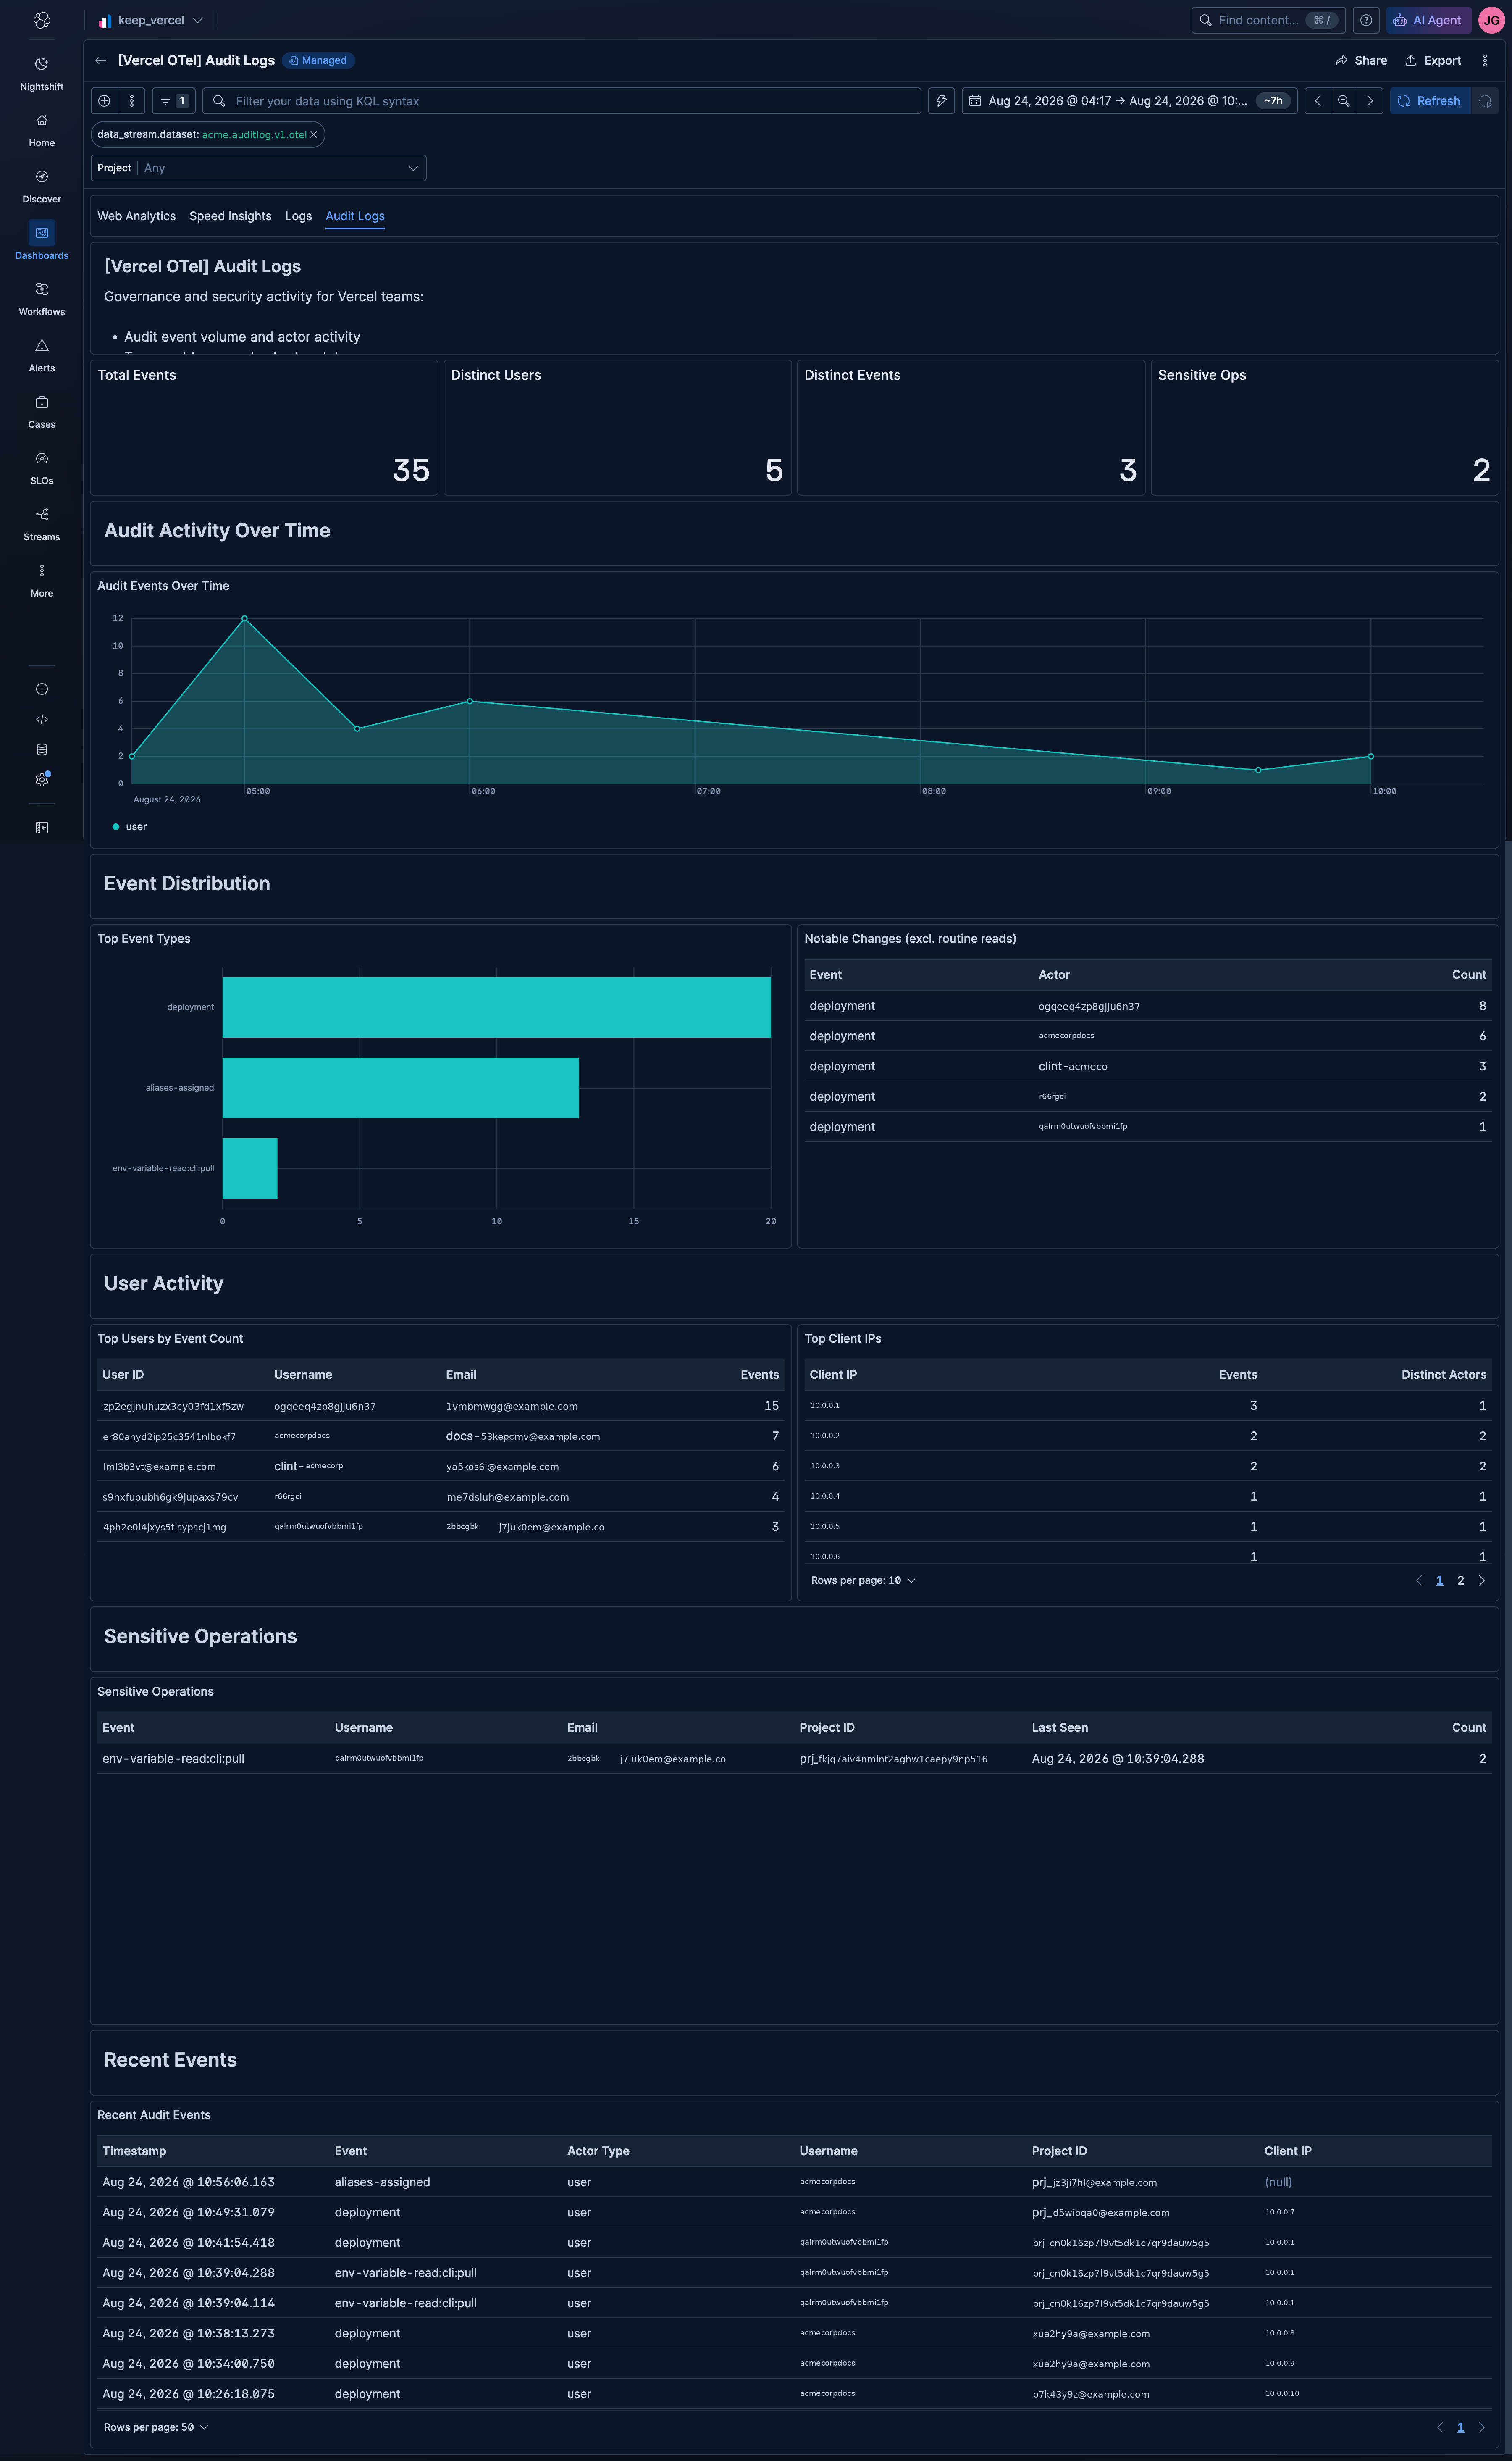
| [Vercel OTel] Audit Logs | Governance and security overview of audit event volume, actors, top event types, user activity, and sensitive operations. |
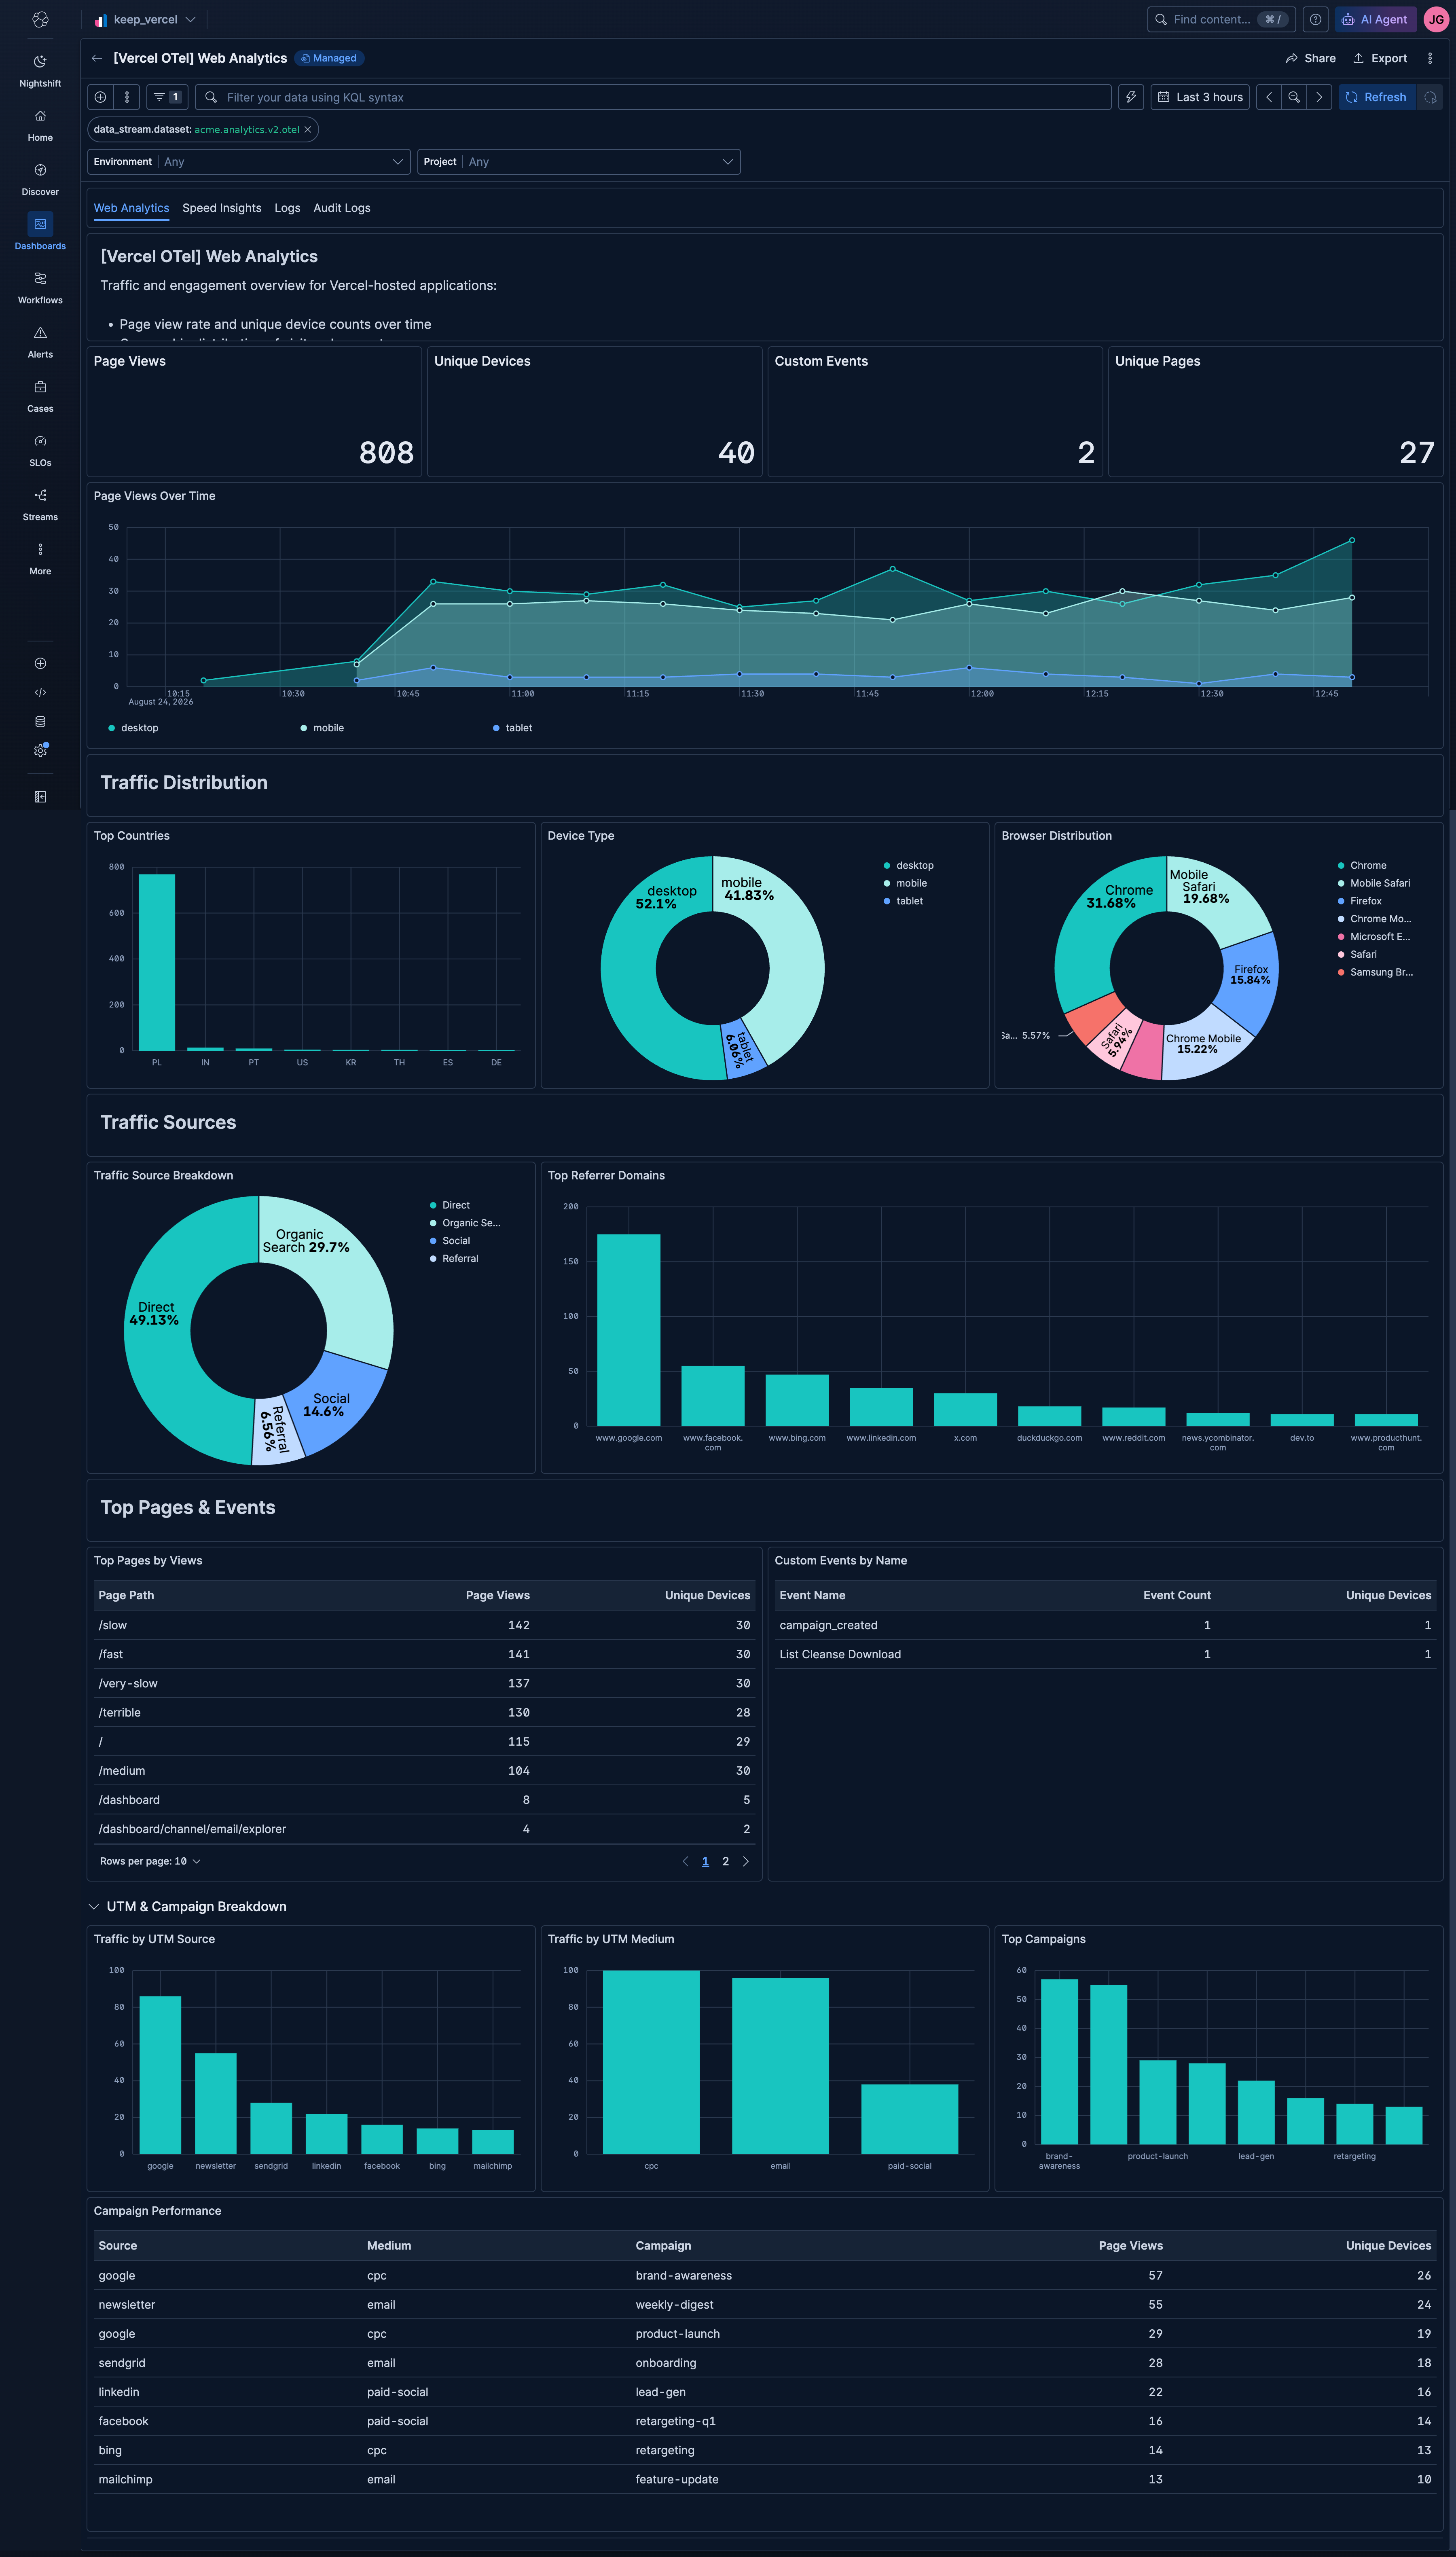
| [Vercel OTel] Web Analytics | Traffic and engagement overview covering page views, geography, devices, top pages, and custom events. |
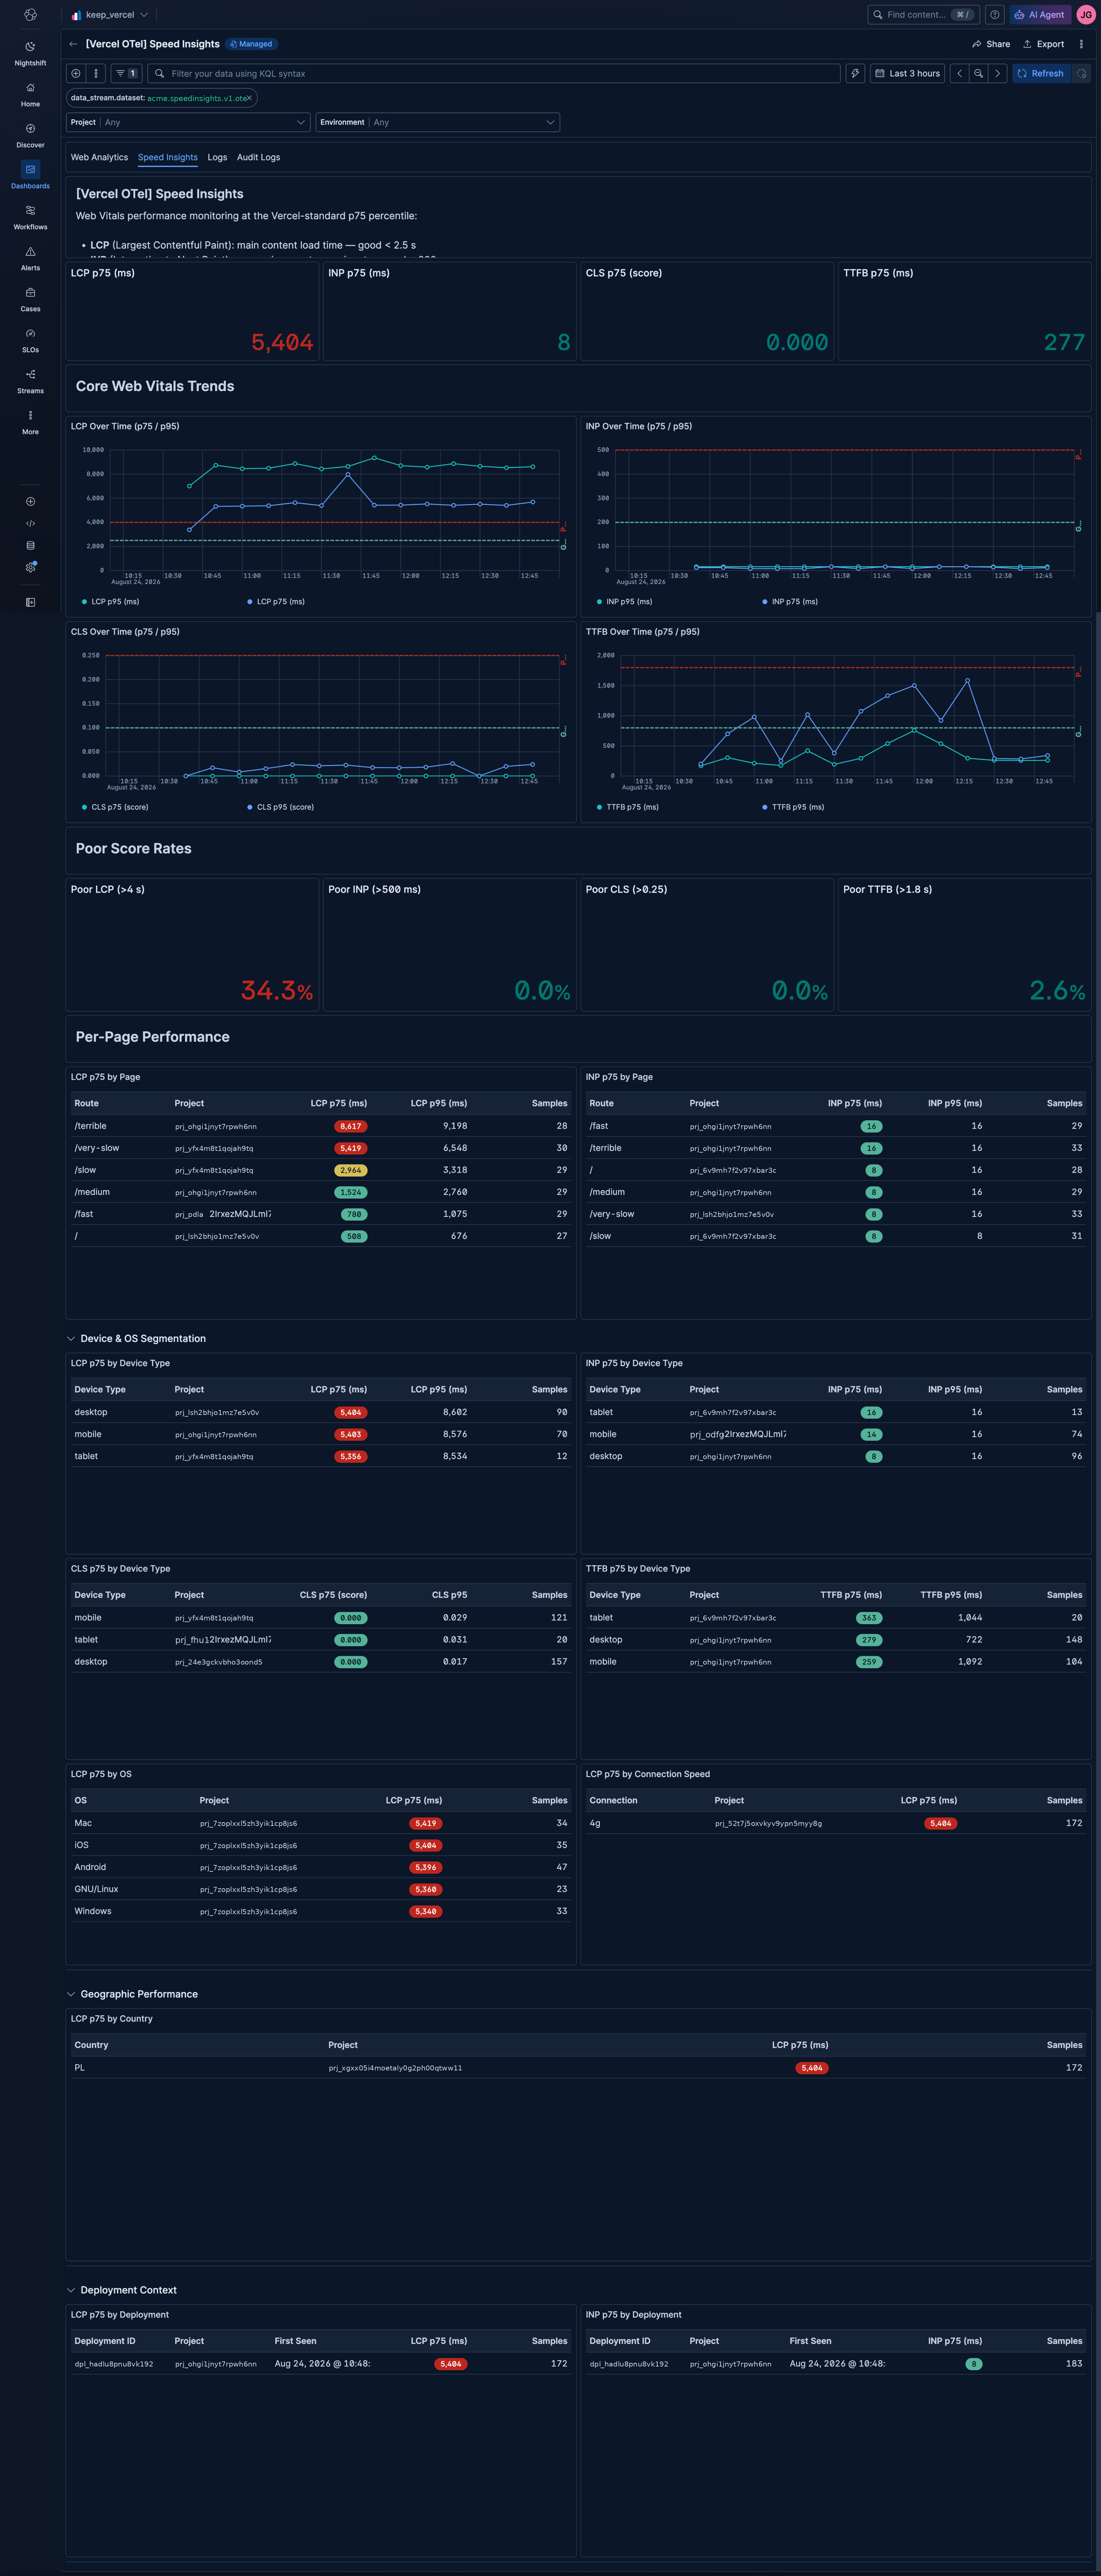
| [Vercel OTel] Speed Insights | Web Vitals performance overview tracking LCP, INP, CLS, and TTFB at the p75 benchmark over time and per page. |
Alert rule templates provide pre-defined configurations for creating alert rules in Kibana.
For more information, refer to the Elastic documentation.
Alert rule templates require Elastic Stack version 9.2.0 or later.
The following alert rule templates are available:
View the alert rule templates
| Name | Description |
|---|---|
| [Vercel OTel] Elevated ERROR/WARNING log rate by source | Alerts when the proportion of ERROR or WARNING level log entries for a given log source exceeds 10% over a 15-minute window. Catches recoverable issues and caught exceptions that don't necessarily surface as an HTTP 5xx. |
| [Vercel OTel] Elevated TTFB p75 (edge/server latency) | Alerts when the site-wide p75 Time to First Byte (TTFB) exceeds the 'poor' threshold (1800ms) over a 1-hour window. TTFB reflects edge/server responsiveness and directly drives LCP, so a sustained elevation is an early signal of cold starts or edge congestion before it fully manifests as an LCP regression. |
| [Vercel OTel] Firewall deny spike | Alerts when the count of firewall (WAF) requests with a 'deny' action exceeds 100 in a 10-minute window. An elevated deny rate can indicate an active attack (DDoS, credential stuffing, crawling) or an overly restrictive firewall rule change blocking legitimate traffic. |
| [Vercel OTel] High HTTP 5xx error rate by log source | Alerts when the HTTP 5xx error rate for lambda or edge requests exceeds 2% over a 15-minute window, evaluated separately per log source. This is the primary server-side health signal for a Vercel deployment. |
| [Vercel OTel] Lambda/edge function crash rate elevated | Alerts when the proportion of lambda/edge invocations that crash before returning any HTTP response (http.response.status_code == -1) exceeds 1% over a 15-minute window. These hard failures are excluded from standard HTTP error-rate calculations but represent the most severe class of runtime defect. |
| [Vercel OTel] Page view rate drop | Alerts when Web Analytics page view volume drops by more than 50% in the most recent 15 minutes compared to the preceding 15 minutes, per project. Complements the server-side request-rate-drop rule with a client-side/user-facing engagement view. |
| [Vercel OTel] Poor Core Web Vitals (p75) by route | Alerts when the p75 value of LCP, INP, or CLS for a given route exceeds the 'poor' Web Vitals threshold over a 1-hour window. p75 is the standard Vercel Speed Insights benchmark. Catches per-route regressions in perceived load speed, interactivity, or visual stability, typically introduced by a recent deployment. |
| [Vercel OTel] Regional error rate skew | Alerts when the HTTP 5xx error rate in a single Vercel execution region exceeds 5% over a 15-minute window, even if the global error rate looks healthy. A regional error concentration typically indicates edge/lambda infrastructure issues localized to that region rather than a global code defect. |
| [Vercel OTel] Request rate drop (traffic collapse) | Alerts when server-side request volume (Logs) drops by more than 50% in the most recent 15 minutes compared to the preceding 15 minutes, per project. A sudden traffic collapse can indicate a broken deployment, DNS misconfiguration, or an authentication barrier blocking users. |
| [Vercel OTel] Sensitive audit activity spike by actor | Alerts when a single actor performs more than 5 sensitive audit actions (env variable reads, drain/webhook/token/domain/team configuration changes, project transfers) within a 1-hour window. Unusual volumes of sensitive actions from a given actor may indicate automated abuse, a compromised credential, or unintentional misconfiguration. |
SLO templates provide pre-defined configurations for creating SLOs in Kibana.
For more information, refer to the Elastic documentation.
SLO templates require Elastic Stack version 9.4.0 or later.
The following SLO templates are available:
View the SLO templates
| Name | Description |
|---|---|
| [Vercel OTel] Cumulative layout shift p75 99.5% rolling 30 days | Tracks the 75th-percentile Cumulative Layout Shift (CLS) reported by Speed Insights for production page loads, targeting 99.5% of hourly windows with a p75 CLS score under 0.1 (Vercel's 'good' threshold) over a rolling 30-day window. A breach signals a layout-shifting regression — such as a newly introduced ad slot, web-font swap, or dynamically injected content — that visually destabilises the page for real users and risks accidental mis-clicks. |
| [Vercel OTel] Interaction to next paint p75 99.5% rolling 30 days | Tracks the 75th-percentile Interaction to Next Paint (INP) reported by Speed Insights for production page loads, targeting 99.5% of hourly windows with a p75 INP under 200ms (Vercel's 'good' threshold) over a rolling 30-day window. A breach signals that heavy JavaScript execution or main-thread blocking introduced by a recent deployment is making the page feel sluggish to interact with, directly affecting users' ability to complete clicks, taps, and form input. |
| [Vercel OTel] Largest contentful paint p75 99.5% rolling 30 days | Tracks the 75th-percentile Largest Contentful Paint (LCP) reported by Speed Insights for production page loads, targeting 99.5% of hourly windows with a p75 LCP under 2500ms (Vercel's 'good' threshold) over a rolling 30-day window. A breach signals a page-load regression — commonly an unoptimised image, a blocking resource, or elevated server response time introduced by a recent deployment — that visibly slows how quickly a page's main content appears to real users. |
| [Vercel OTel] Server-side error rate 99% rolling 30 days | Tracks the proportion of production lambda and edge requests that complete without an HTTP 5xx response, targeting 99% success over a rolling 30-day window. A breach signals that a serverless function or edge middleware defect is causing real requests to fail, degrading the core request-serving experience for end users. Requests where the function crashed before returning any response (http.response.status_code = -1) are excluded from both good and total counts, since no HTTP response was actually served. |
| [Vercel OTel] Time to first byte p75 99.5% rolling 30 days | Tracks the 75th-percentile Time to First Byte (TTFB) reported by Speed Insights for production page loads, targeting 99.5% of hourly windows with a p75 TTFB under 800ms (Vercel's 'good' threshold) over a rolling 30-day window. A breach signals cold starts, edge congestion, or regional capacity issues are slowing the server/edge response before rendering can begin — a leading indicator that also drives downstream Largest Contentful Paint regressions. |
This integration includes one or more Kibana dashboards that visualizes the data collected by the integration. The screenshots below illustrate how the ingested data is displayed.
Changelog
| Version | Details | Minimum Kibana version |
|---|---|---|
| 0.4.1 | Bug fix (View pull request) Point users to the Kibana Add data view to copy the managed endpoint URL for Vercel instead of the Elastic Cloud Console. |
9.4.0 |
| 0.4.0 | Enhancement (View pull request) Improve dashboard readability |
9.4.0 |
| 0.3.0 | Enhancement (View pull request) Add 10 alert rule templates (errors, traffic, saturation, latency, and audit governance) and 5 SLO templates (server-side error rate and Core Web Vitals p75) with dashboard links. |
9.4.0 |
| 0.2.1 | Bug fix (View pull request) Update managed endpoint path |
9.4.0 |
| 0.2.0 | Enhancement (View pull request) Add the Speed Insights dashboard and the vercel.speedinsights.v1.otel dataset |
9.4.0 |
| 0.1.0 | Enhancement (View pull request) Initial release of the Vercel content package |
9.4.0 |