CrowdSec
| Version | 0.1.0
|
| Subscription level What's this? |
Basic |
| Developed by What's this? |
Community |
| Ingestion method(s) | File, Webhook |
| Minimum Kibana version(s) | 9.1.0 8.19.0 |
To use pre-release integrations, go to the Integrations page in Kibana, scroll down, and toggle on the Display beta integrations option.
CrowdSec is an open-source, collaborative intrusion prevention system. It parses logs, detects aggressive behavior with scenarios from the CrowdSec Hub, and issues remediation decisions such as banning a source IP. Decisions are shared with the CrowdSec community network, so a source that attacked one participant can be blocked by the others before it reaches them.
This integration collects CrowdSec alerts. Each alert is one detection: the scenario that fired, the source it fired on, how many events contributed to it, and the remediation decisions attached. One Elasticsearch document is created per alert.
This integration has been tested against CrowdSec 1.8.x. The alert structure is stable across 1.x releases, so earlier 1.x versions are expected to work.
Both the CrowdSec Security Engine running on a host and one running in a container are supported — the integration consumes the notification output, not the engine's internal state.
CrowdSec's notification-http plugin POSTs alerts to an HTTP endpoint as soon as
a scenario overflows. The Elastic Agent runs that endpoint, and because CrowdSec
sends a JSON array of alerts, the http_endpoint input splits it into one
event per array element without any additional configuration.
A second input reads alerts from a file, one JSON alert object per line. It is disabled by default and is intended for replaying captured alerts or for environments where the Agent cannot expose a listener.
The integration collects one data stream:
| Data stream | Type | Description |
|---|---|---|
alert |
logs | CrowdSec alerts, including the scenario, the source, alert-level metadata and the remediation decisions. |
Alerts are mapped to ECS. The scenario becomes rule.name, the source becomes
source.ip / source.geo.* / source.as.*, the primary remediation becomes
event.action, and everything CrowdSec emits that has no ECS equivalent is kept
under the crowdsec.* namespace.
- Monitor which scenarios fire most often and which sources trigger them, to tell broad internet background noise apart from a targeted campaign.
- See where blocked traffic originates, by country and by autonomous system.
- Track ban rate over time and identify repeat offenders that keep returning after a decision expires.
- Correlate CrowdSec decisions with the web server logs that produced them, using
source.ipandrelated.ip.
- An Elastic Stack deployment — self-managed, Elastic Cloud or Elastic Cloud Serverless — and an Elastic Agent enrolled in Fleet.
- A CrowdSec Security Engine 1.8.x or later with the
notification-httpplugin available. The plugin ships with the standard CrowdSec packages. - Permission to edit
/etc/crowdsec/notifications/http.yamland/etc/crowdsec/profiles.yamlon the CrowdSec host, and to restart the service. - Network access from the CrowdSec host to the Elastic Agent on the port the
listener binds to (default
7822).
No CrowdSec API credentials, bouncer key or LAPI access are required — CrowdSec pushes to the Agent rather than the Agent polling CrowdSec.
For step-by-step instructions on installing the Elastic Agent and adding an integration, refer to the Getting started guide.
Fleet-managed and standalone Elastic Agent deployments are both supported. Elastic Managed (agentless) deployment is not supported: CrowdSec pushes to a listener, which requires an Agent reachable from the CrowdSec host.
- In Kibana, go to Management → Integrations, search for CrowdSec, and click Add CrowdSec.
- Configure the HTTP endpoint input:
- Listen address —
0.0.0.0to accept from any interface, or the specific address CrowdSec will reach the Agent on. The defaultlocalhostonly works when CrowdSec runs on the same host as the Agent. - Listen port — default
7822. - URL path — default
/crowdsec. - Secret header name and Secret header value — optional. If set, the Agent rejects requests that do not carry the header.
- Listen address —
- Select or create an agent policy and save.
Then configure CrowdSec to push to it:
Edit
/etc/crowdsec/notifications/http.yaml:type: http name: http_default url: http://<agent-host>:7822/crowdsec method: POST headers: Content-Type: application/json format: | {{.|toJson}}The
formatline must serialize the whole object so that complete alerts are sent. If a secret header was configured above, add it underheaders.In
/etc/crowdsec/profiles.yaml, add the notification to the profiles whose alerts should be collected:notifications: - http_defaultRestart CrowdSec:
sudo systemctl restart crowdsec
Refer to the CrowdSec notification plugin documentation for the authoritative configuration reference.
Trigger an alert from a host CrowdSec watches, for example by requesting several non-existent paths against a web server CrowdSec parses logs for.
Confirm CrowdSec raised the alert:
sudo cscli alerts listConfirm the plugin delivered it:
sudo journalctl -u crowdsec -n 50 | grep -i notificationIn Kibana, open Discover and query
data_stream.dataset: "crowdsec.alert", or open the [Logs CrowdSec] Alerts overview dashboard.
No documents arrive, and CrowdSec reports no error.
CrowdSec only sends to profiles that reference the notification. Check that
http_default is listed under notifications: in /etc/crowdsec/profiles.yaml
for the profile that matched, and restart CrowdSec after editing it — the plugin
configuration is not reloaded on SIGHUP.
CrowdSec logs a connection error.
Confirm the Agent host allows inbound traffic on the listener port. A host
firewall that drops the port is the most common cause: tcpdump on the Agent
will show the packets arriving while nothing reaches the listener.
Documents arrive but every field except @timestamp is missing.
The format in http.yaml is not serializing the full object. It must be
{{.|toJson}}; a format that renders a human-readable string produces a
body the pipeline cannot decode, and the document is tagged pipeline_error.
source.geo.* is empty.
The GeoIP database does not resolve private or reserved addresses. For public
addresses it is missing only when no GeoIP database is installed, in which case
the pipeline falls back to the country and coordinates CrowdSec supplies, which
are present only when CrowdSec itself has a GeoIP database.
Alerts appear twice.
More than one CrowdSec profile references the notification and both matched the
same event. Alerts carry a stable crowdsec.alert.uuid, which can be used to
confirm this.
For CrowdSec-side issues, refer to the CrowdSec troubleshooting documentation.
The http_endpoint input is push-based, so throughput is bounded by how fast
CrowdSec raises alerts rather than by a polling interval. Alerts are aggregated
events — a scenario overflow that consumed hundreds of log lines produces one
alert — so volume is modest even on a busy host, typically well under one
document per second.
For several CrowdSec engines, point them all at one Agent listener; the events
carry crowdsec.machine_id and observer.name to tell them apart. Scale out by
running more Agents behind a load balancer only if a single engine's alert rate
saturates one listener, which is unlikely in practice.
The file input reads at whatever rate the file grows and is suitable for bulk replay of captured alerts.
For guidance on sizing the Elastic Stack itself, refer to Elastic Agent scaling.
| Input | Purpose | Enabled by default |
|---|---|---|
http_endpoint |
Receives alerts pushed by the CrowdSec notification-http plugin. |
yes |
logfile |
Reads alerts from a file, one JSON alert object per line. | no |
The alert data stream collects CrowdSec alerts.
Example
{
    "@timestamp": "2026-09-06T07:03:17.445Z",
    "crowdsec": {
        "alert": {
            "paths": [
                "/search?q=<script>alert(1)</script>",
                "/search?q=<script>alert(2)</script>",
                "/search?q=<script>alert(3)</script>",
                "/search?q=<script>alert(4)</script>",
                "/search?q=<script>alert(5)</script>",
                "/search?q=<script>alert(6)</script>",
                "/search?q=<script>alert(7)</script>",
                "/search?q=<script>alert(8)</script>",
                "/search?q=<script>alert(9)</script>",
                "/search?q=<script>alert(10)</script>",
                "/search?q=<script>alert(11)</script>"
            ],
            "target_uri": [
                "/search?q=<script>alert(1)</script>",
                "/search?q=<script>alert(2)</script>",
                "/search?q=<script>alert(3)</script>",
                "/search?q=<script>alert(4)</script>",
                "/search?q=<script>alert(5)</script>",
                "/search?q=<script>alert(6)</script>",
                "/search?q=<script>alert(7)</script>",
                "/search?q=<script>alert(8)</script>",
                "/search?q=<script>alert(9)</script>",
                "/search?q=<script>alert(10)</script>",
                "/search?q=<script>alert(11)</script>"
            ],
            "uuid": "4ab4ca28-83b1-4aa3-adb3-09a9f7f1c51e"
        },
        "capacity": 10,
        "decision": {
            "duration": "4h",
            "origin": "crowdsec",
            "scope": "Ip",
            "type": "ban"
        },
        "decisions": [
            {
                "duration": "4h",
                "origin": "crowdsec",
                "scenario": "crowdsecurity/http-probing",
                "scope": "Ip",
                "type": "ban",
                "uuid": "78d34306-8fe8-4916-8907-15c1c000b792",
                "value": "198.51.100.23"
            }
        ],
        "events_count": 11,
        "kind": "crowdsec",
        "leakspeed": "10s",
        "machine_id": "localhost",
        "remediation": true,
        "scenario": {
            "author": "crowdsecurity",
            "hash": "4b16f896af400e006c28b1476bf5989c748186f2b3756ed9ad7d1559480d278c",
            "name": "crowdsecurity/http-probing",
            "title": "http-probing",
            "version": "0.4"
        },
        "simulated": false,
        "source": {
            "scope": "Ip"
        }
    },
    "data_stream": {
        "dataset": "crowdsec.alert",
        "namespace": "default",
        "type": "logs"
    },
    "ecs": {
        "version": "9.3.0"
    },
    "event": {
        "action": "ban",
        "category": [
            "intrusion_detection"
        ],
        "end": "2026-09-06T07:03:17.514Z",
        "id": "4ab4ca28-83b1-4aa3-adb3-09a9f7f1c51e",
        "kind": "alert",
        "reason": "Ip 198.51.100.23 performed 'crowdsecurity/http-probing' (11 events over 68.174919ms) at 2026-09-06 07:03:17.514053916 +0000 UTC",
        "start": "2026-09-06T07:03:17.445Z",
        "type": [
            "denied"
        ]
    },
    "http": {
        "request": {
            "method": [
                "GET"
            ]
        },
        "response": {
            "status_code": [
                404
            ]
        }
    },
    "observer": {
        "name": "localhost",
        "product": "CrowdSec",
        "type": "ips",
        "vendor": "CrowdSec"
    },
    "related": {
        "ip": [
            "198.51.100.23"
        ]
    },
    "rule": {
        "name": "crowdsecurity/http-probing",
        "ruleset": "CrowdSec Hub",
        "version": "0.4"
    },
    "source": {
        "address": "198.51.100.23",
        "as": {
            "number": 64501,
            "organization": {
                "name": "Documentation ASN"
            }
        },
        "geo": {
            "city_name": "Amsterdam",
            "continent_name": "Europe",
            "country_iso_code": "NL",
            "country_name": "Netherlands",
            "location": {
                "lat": 52.37404,
                "lon": 4.88969
            },
            "region_iso_code": "NL-NH",
            "region_name": "North Holland"
        },
        "ip": "198.51.100.23"
    },
    "tags": [
        "crowdsec-alert",
        "forwarded"
    ],
    "user_agent": {
        "original": [
            "sqlmap/1.7"
        ]
    }
}
Exported fields
| Field | Description | Type |
|---|---|---|
| @timestamp | Date/time when the event originated. This is the date/time extracted from the event, typically representing when the event was generated by the source. If the event source has no original timestamp, this value is typically populated by the first time the event was received by the pipeline. Required field for all events. | date |
| crowdsec.alert.paths | Distinct request paths collected from the alert's events. | keyword |
| crowdsec.alert.target_uri | Distinct request URIs seen across the events that contributed to the alert. | keyword |
| crowdsec.alert.uuid | Unique identifier of the alert. | keyword |
| crowdsec.capacity | The bucket capacity of the scenario that fired, i.e. how many events it holds before overflowing. | long |
| crowdsec.decision.duration | How long the primary remediation lasts, for example 4h. |
keyword |
| crowdsec.decision.origin | Origin of the primary decision, for example crowdsec or CAPI. |
keyword |
| crowdsec.decision.scope | Scope of the primary decision, for example Ip or Range. |
keyword |
| crowdsec.decision.type | Type of the primary remediation, for example ban or captcha. |
keyword |
| crowdsec.decisions | The full list of remediation decisions carried by the alert. | flattened |
| crowdsec.events_count | Number of events that contributed to the alert. | long |
| crowdsec.kind | The kind of object CrowdSec emitted. Always crowdsec for an alert. |
keyword |
| crowdsec.leakspeed | The rate at which the scenario bucket leaks events, for example 10s. |
keyword |
| crowdsec.machine_id | Identifier of the CrowdSec machine that raised the alert. | keyword |
| crowdsec.remediation | Whether the alert carries a remediation decision. | boolean |
| crowdsec.scenario.author | Author namespace of the Hub scenario, for example crowdsecurity for official scenarios or a community handle. |
keyword |
| crowdsec.scenario.hash | Hash of the scenario definition at the time it fired. | keyword |
| crowdsec.scenario.name | Name of the scenario that fired, for example crowdsecurity/http-probing. |
keyword |
| crowdsec.scenario.title | Scenario name without its author prefix, for example http-probing. Used for display. |
keyword |
| crowdsec.scenario.version | Version of the scenario. | keyword |
| crowdsec.simulated | Whether the alert was produced in simulation mode and carries no enforced decision. | boolean |
| crowdsec.source.range | The CIDR range the source belongs to, when CrowdSec resolved one. | keyword |
| crowdsec.source.scope | Scope of the alert source, for example Ip, Range or Country. |
keyword |
| data_stream.dataset | The field can contain anything that makes sense to signify the source of the data. Examples include nginx.access, prometheus, endpoint etc. For data streams that otherwise fit, but that do not have dataset set we use the value "generic" for the dataset value. event.dataset should have the same value as data_stream.dataset. Beyond the Elasticsearch data stream naming criteria noted above, the dataset value has additional restrictions: * Must not contain - * No longer than 100 characters |
constant_keyword |
| data_stream.namespace | A user defined namespace. Namespaces are useful to allow grouping of data. Many users already organize their indices this way, and the data stream naming scheme now provides this best practice as a default. Many users will populate this field with default. If no value is used, it falls back to default. Beyond the Elasticsearch index naming criteria noted above, namespace value has the additional restrictions: * Must not contain - * No longer than 100 characters |
constant_keyword |
| data_stream.type | An overarching type for the data stream. Currently allowed values are "logs" and "metrics". We expect to also add "traces" and "synthetics" in the near future. | constant_keyword |
| ecs.version | ECS version this event conforms to. ecs.version is a required field and must exist in all events. When querying across multiple indices -- which may conform to slightly different ECS versions -- this field lets integrations adjust to the schema version of the events. |
keyword |
| error.message | Error message. | match_only_text |
| event.action | The action captured by the event. This describes the information in the event. It is more specific than event.category. Examples are group-add, process-started, file-created. The value is normally defined by the implementer. |
keyword |
| event.category | This is one of four ECS Categorization Fields, and indicates the second level in the ECS category hierarchy. event.category represents the "big buckets" of ECS categories. For example, filtering on event.category:process yields all events relating to process activity. This field is closely related to event.type, which is used as a subcategory. This field is an array. This will allow proper categorization of some events that fall in multiple categories. |
keyword |
| event.dataset | Name of the dataset. If an event source publishes more than one type of log or events (e.g. access log, error log), the dataset is used to specify which one the event comes from. It's recommended but not required to start the dataset name with the module name, followed by a dot, then the dataset name. | constant_keyword |
| event.end | event.end contains the date when the event ended or when the activity was last observed. |
date |
| event.id | Unique ID to describe the event. | keyword |
| event.kind | This is one of four ECS Categorization Fields, and indicates the highest level in the ECS category hierarchy. event.kind gives high-level information about what type of information the event contains, without being specific to the contents of the event. For example, values of this field distinguish alert events from metric events. The value of this field can be used to inform how these kinds of events should be handled. They may warrant different retention, different access control, it may also help understand whether the data is coming in at a regular interval or not. |
keyword |
| event.module | Name of the module this data is coming from. If your monitoring agent supports the concept of modules or plugins to process events of a given source (e.g. Apache logs), event.module should contain the name of this module. |
constant_keyword |
| event.original | Raw text message of entire event. Used to demonstrate log integrity or where the full log message (before splitting it up in multiple parts) may be required, e.g. for reindex. This field is not indexed and doc_values are disabled. It cannot be searched, but it can be retrieved from _source. If users wish to override this and index this field, please see Field data types in the Elasticsearch Reference. |
keyword |
| event.reason | Reason why this event happened, according to the source. This describes the why of a particular action or outcome captured in the event. Where event.action captures the action from the event, event.reason describes why that action was taken. For example, a web proxy with an event.action which denied the request may also populate event.reason with the reason why (e.g. blocked site). |
keyword |
| event.start | event.start contains the date when the event started or when the activity was first observed. |
date |
| event.type | This is one of four ECS Categorization Fields, and indicates the third level in the ECS category hierarchy. event.type represents a categorization "sub-bucket" that, when used along with the event.category field values, enables filtering events down to a level appropriate for single visualization. This field is an array. This will allow proper categorization of some events that fall in multiple event types. |
keyword |
| http.request.method | HTTP request method. The value should retain its casing from the original event. For example, GET, get, and GeT are all considered valid values for this field. |
keyword |
| http.response.status_code | HTTP response status code. | long |
| input.type | Type of the Elastic Agent input that collected the alert. | keyword |
| log.file.path | Path to the log file the alert was read from. | keyword |
| log.offset | Log offset. | long |
| message | For log events the message field contains the log message, optimized for viewing in a log viewer. For structured logs without an original message field, other fields can be concatenated to form a human-readable summary of the event. If multiple messages exist, they can be combined into one message. | match_only_text |
| observer.name | Custom name of the observer. This is a name that can be given to an observer. This can be helpful for example if multiple firewalls of the same model are used in an organization. If no custom name is needed, the field can be left empty. | keyword |
| observer.product | The product name of the observer. | keyword |
| observer.type | The type of the observer the data is coming from. There is no predefined list of observer types. Some examples are forwarder, firewall, ids, ips, proxy, poller, sensor, APM server. |
keyword |
| observer.vendor | Vendor name of the observer. | keyword |
| related.ip | All of the IPs seen on your event. | ip |
| rule.name | The name of the rule or signature generating the event. | keyword |
| rule.ruleset | Name of the ruleset, policy, group, or parent category in which the rule used to generate this event is a member. | keyword |
| rule.version | The version / revision of the rule being used for analysis. | keyword |
| source.address | Some event source addresses are defined ambiguously. The event will sometimes list an IP, a domain or a unix socket. You should always store the raw address in the .address field. Then it should be duplicated to .ip or .domain, depending on which one it is. |
keyword |
| source.as.number | Unique number allocated to the autonomous system. The autonomous system number (ASN) uniquely identifies each network on the Internet. | long |
| source.as.organization.name | Organization name. | keyword |
| source.as.organization.name.text | Multi-field of source.as.organization.name. |
match_only_text |
| source.geo.city_name | City name. | keyword |
| source.geo.continent_name | Name of the continent. | keyword |
| source.geo.country_iso_code | Country ISO code. | keyword |
| source.geo.country_name | Country name. | keyword |
| source.geo.location | Longitude and latitude. | geo_point |
| source.geo.region_iso_code | Region ISO code. | keyword |
| source.geo.region_name | Region name. | keyword |
| source.ip | IP address of the source (IPv4 or IPv6). | ip |
| tags | List of keywords used to tag each event. | keyword |
| user_agent.original | Unparsed user_agent string. | keyword |
| user_agent.original.text | Multi-field of user_agent.original. |
match_only_text |
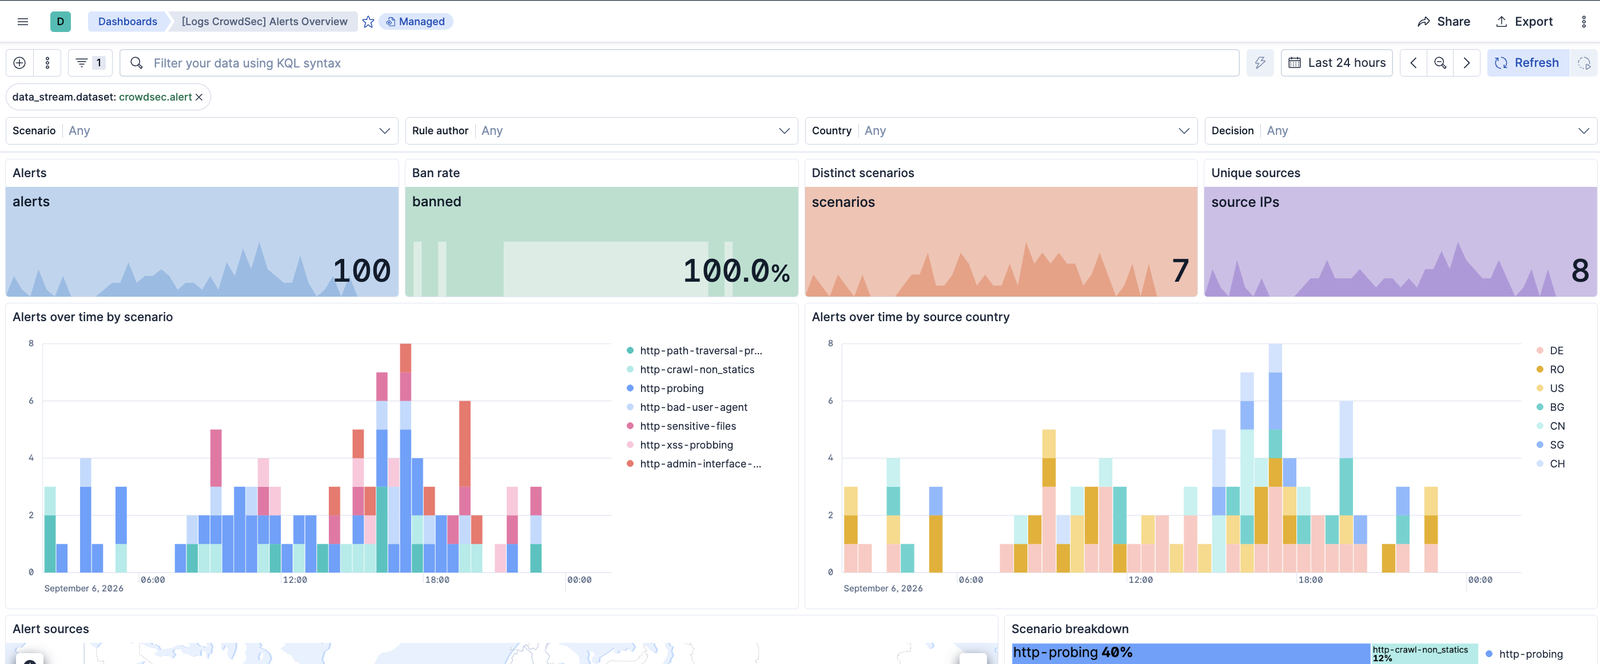
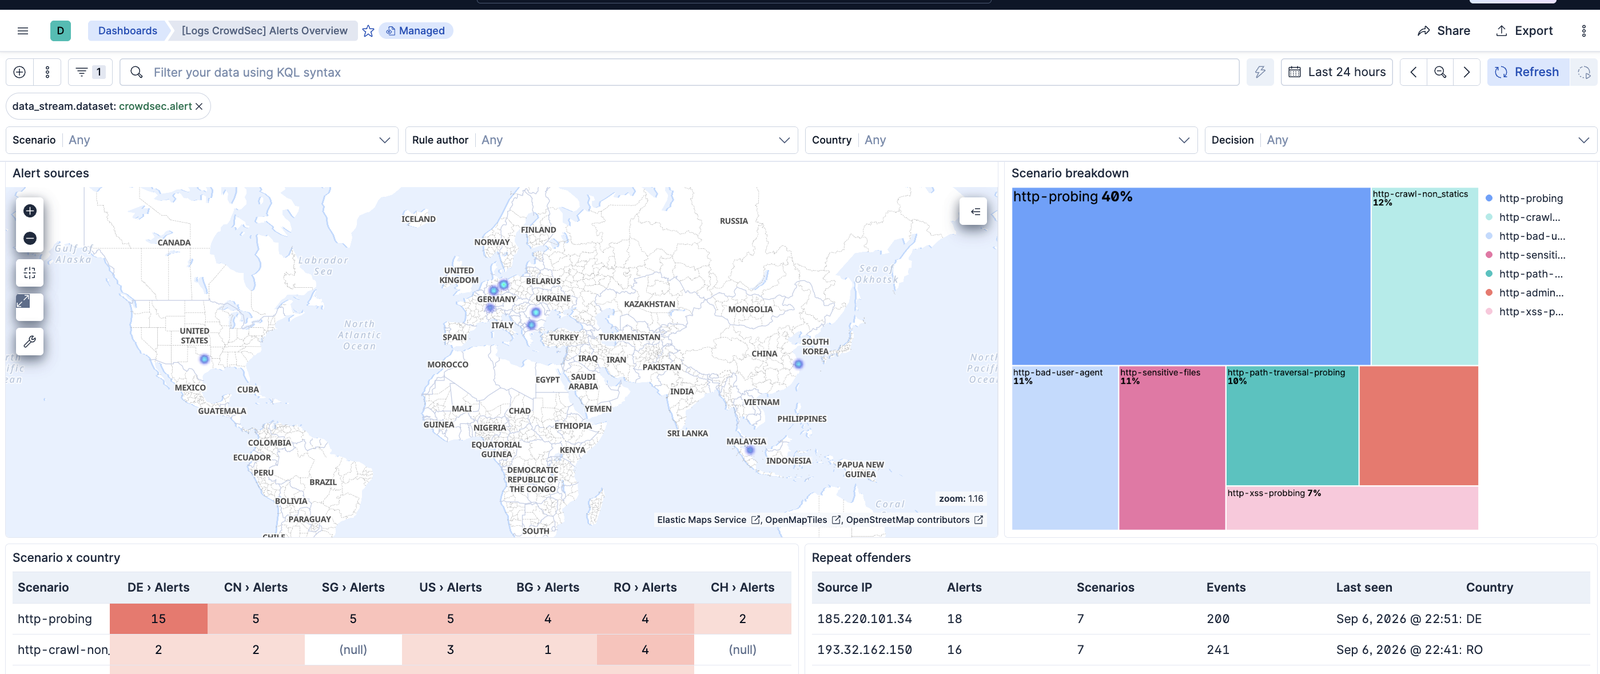
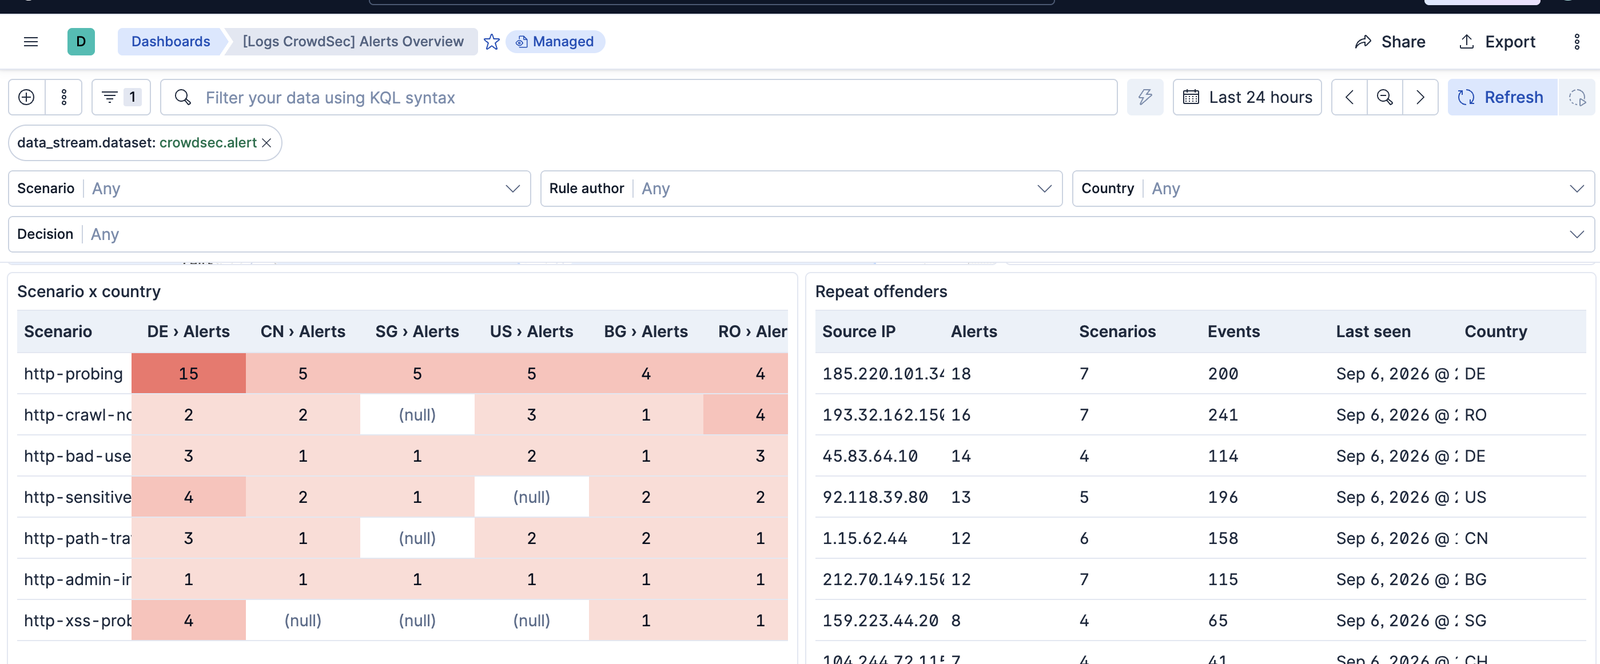
This integration includes one or more Kibana dashboards that visualizes the data collected by the integration. The screenshots below illustrate how the ingested data is displayed.
Changelog
| Version | Details | Minimum Kibana version |
|---|---|---|
| 0.1.0 | Enhancement (View pull request) Initial release. Collects CrowdSec alerts via the notification-http plugin or from a file, maps them to ECS with a crowdsec.* namespace, and ships the Alerts Overview dashboard. |
9.1.0 8.19.0 |