AWS ELB Metrics OpenTelemetry Assets
| Version | 0.12.0
|
| Subscription level What's this? |
Basic |
| Developed by What's this? |
Elastic |
| Minimum Kibana version(s) | 9.5.0 |
To use pre-release integrations, go to the Integrations page in Kibana, scroll down, and toggle on the Display beta integrations option.
This package contains Kibana assets for monitoring ELB load balancers with AWS CloudWatch metrics collected by the OpenTelemetry Collector.
The package is content only. It provides a curated metrics dashboard, but it does not configure data collection. Use the AWS CloudWatch OpenTelemetry Input Package (aws_cloudwatch_input_otel) to configure the OpenTelemetry Collector CloudWatch receiver and collect the required AWS service metrics into Elasticsearch.
- CloudWatch metrics collected by the OpenTelemetry Collector AWS CloudWatch receiver.
- Documents indexed into the
metrics-aws.elb.otel-*data stream. - The relevant AWS dimensions for this service, such as resource name, region, and service-specific identifiers.
Requires Kibana ^9.5.0.
This package includes one pre-built Kibana dashboard:
| Name | Description |
|---|---|
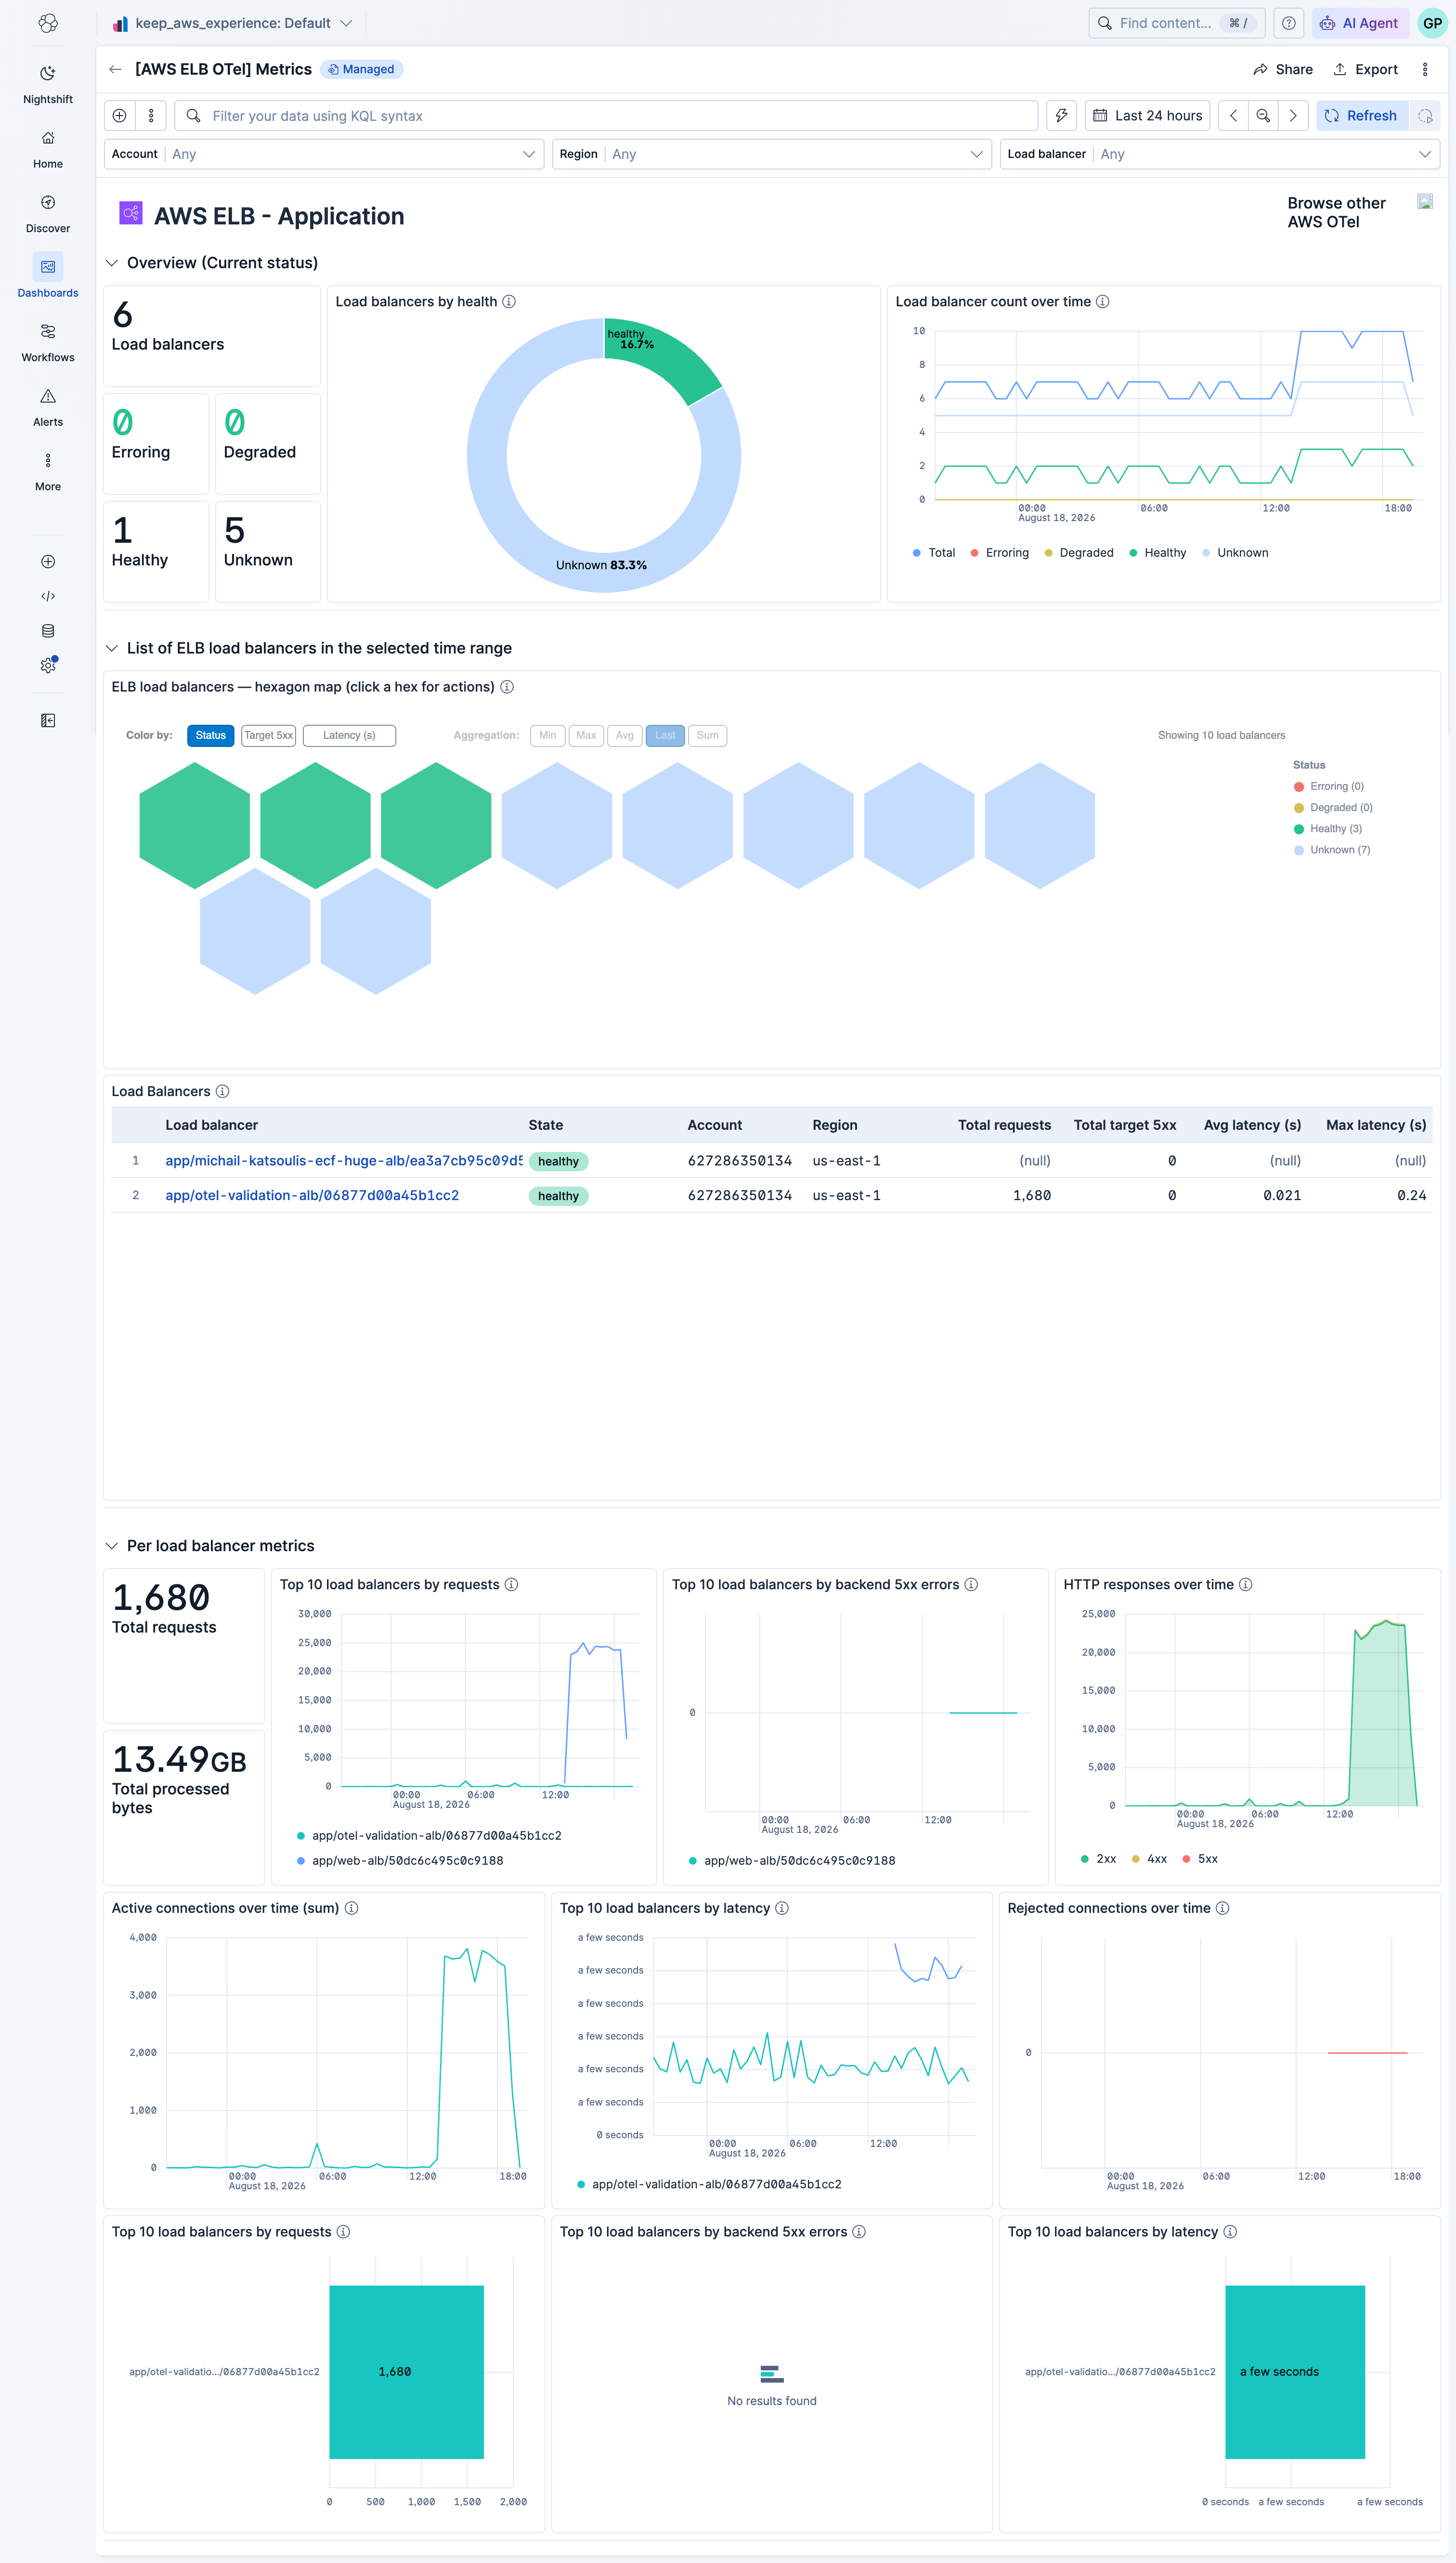
| [AWS ELB OTel] Metrics | AWS ELB metrics dashboard for CloudWatch metrics collected by the OpenTelemetry Collector. |
Alert rule templates provide pre-defined configurations for creating alert rules in Kibana.
For more information, refer to the Elastic documentation.
Alert rule templates require Elastic Stack version 9.2.0 or later.
The following alert rule templates are available:
View the alert rule templates
| Name | Description |
|---|---|
| [AWS ELB OTel] High Application Load Balancer 5XX error rate | Alerts when load-balancer-generated 5XX error rate exceeds a tunable threshold. Indicates edge/infrastructure failures such as no healthy targets, connection timeouts, or LB capacity issues. |
| [AWS ELB OTel] Application Load Balancer rejected connections detected | Alerts when the ALB rejects connections because it reached its connection ceiling. A hard capacity-class failure requiring immediate attention. |
| [AWS ELB OTel] High Application Load Balancer target 5XX error rate | Alerts when target-generated 5XX error rate exceeds a tunable threshold for any load balancer target group. Indicates application or backend failures behind the ALB. |
| [AWS ELB OTel] High Application Load Balancer target response time (average) | Alerts when average target response time exceeds a tunable threshold. Indicates typical backend latency degradation even when error rates remain low. |
| [AWS ELB OTel] High Application Load Balancer target response time (tail) | Alerts when peak (maximum) target response time exceeds a tunable threshold. Serves as a tail-latency proxy where CloudWatch percentiles are unavailable. |
| [AWS ELB OTel] Application Load Balancer unhealthy targets detected | Alerts when any target in a target group is failing health checks (UnHealthyHostCount > 0). Early warning before healthy capacity collapses to zero. |
SLO templates provide pre-defined configurations for creating SLOs in Kibana.
For more information, refer to the Elastic documentation.
SLO templates require Elastic Stack version 9.4.0 or later.
The following SLO templates are available:
View the SLO templates
| Name | Description |
|---|---|
| [AWS ELB OTel] Application Load Balancer request availability 99.5% rolling 30 days | Tracks Application Load Balancer request availability by keeping the combined ELB-generated and target-generated 5XX error rate below 0.5% in each 1-minute interval. Scoped per load balancer and region; aggregates all target groups behind the load balancer. A rolling 30-day target of 99.5% ensures users receive successful responses at the edge. |
| [AWS ELB OTel] Application Load Balancer target response time average 99.5% rolling 30 days | Tracks typical backend latency for Application Load Balancer target groups by keeping average TargetResponseTime below 1 second in each 1-minute interval. Scoped per target group, load balancer, and region. A rolling 30-day target of 99.5% ensures users experience responsive service even when errors are absent. |
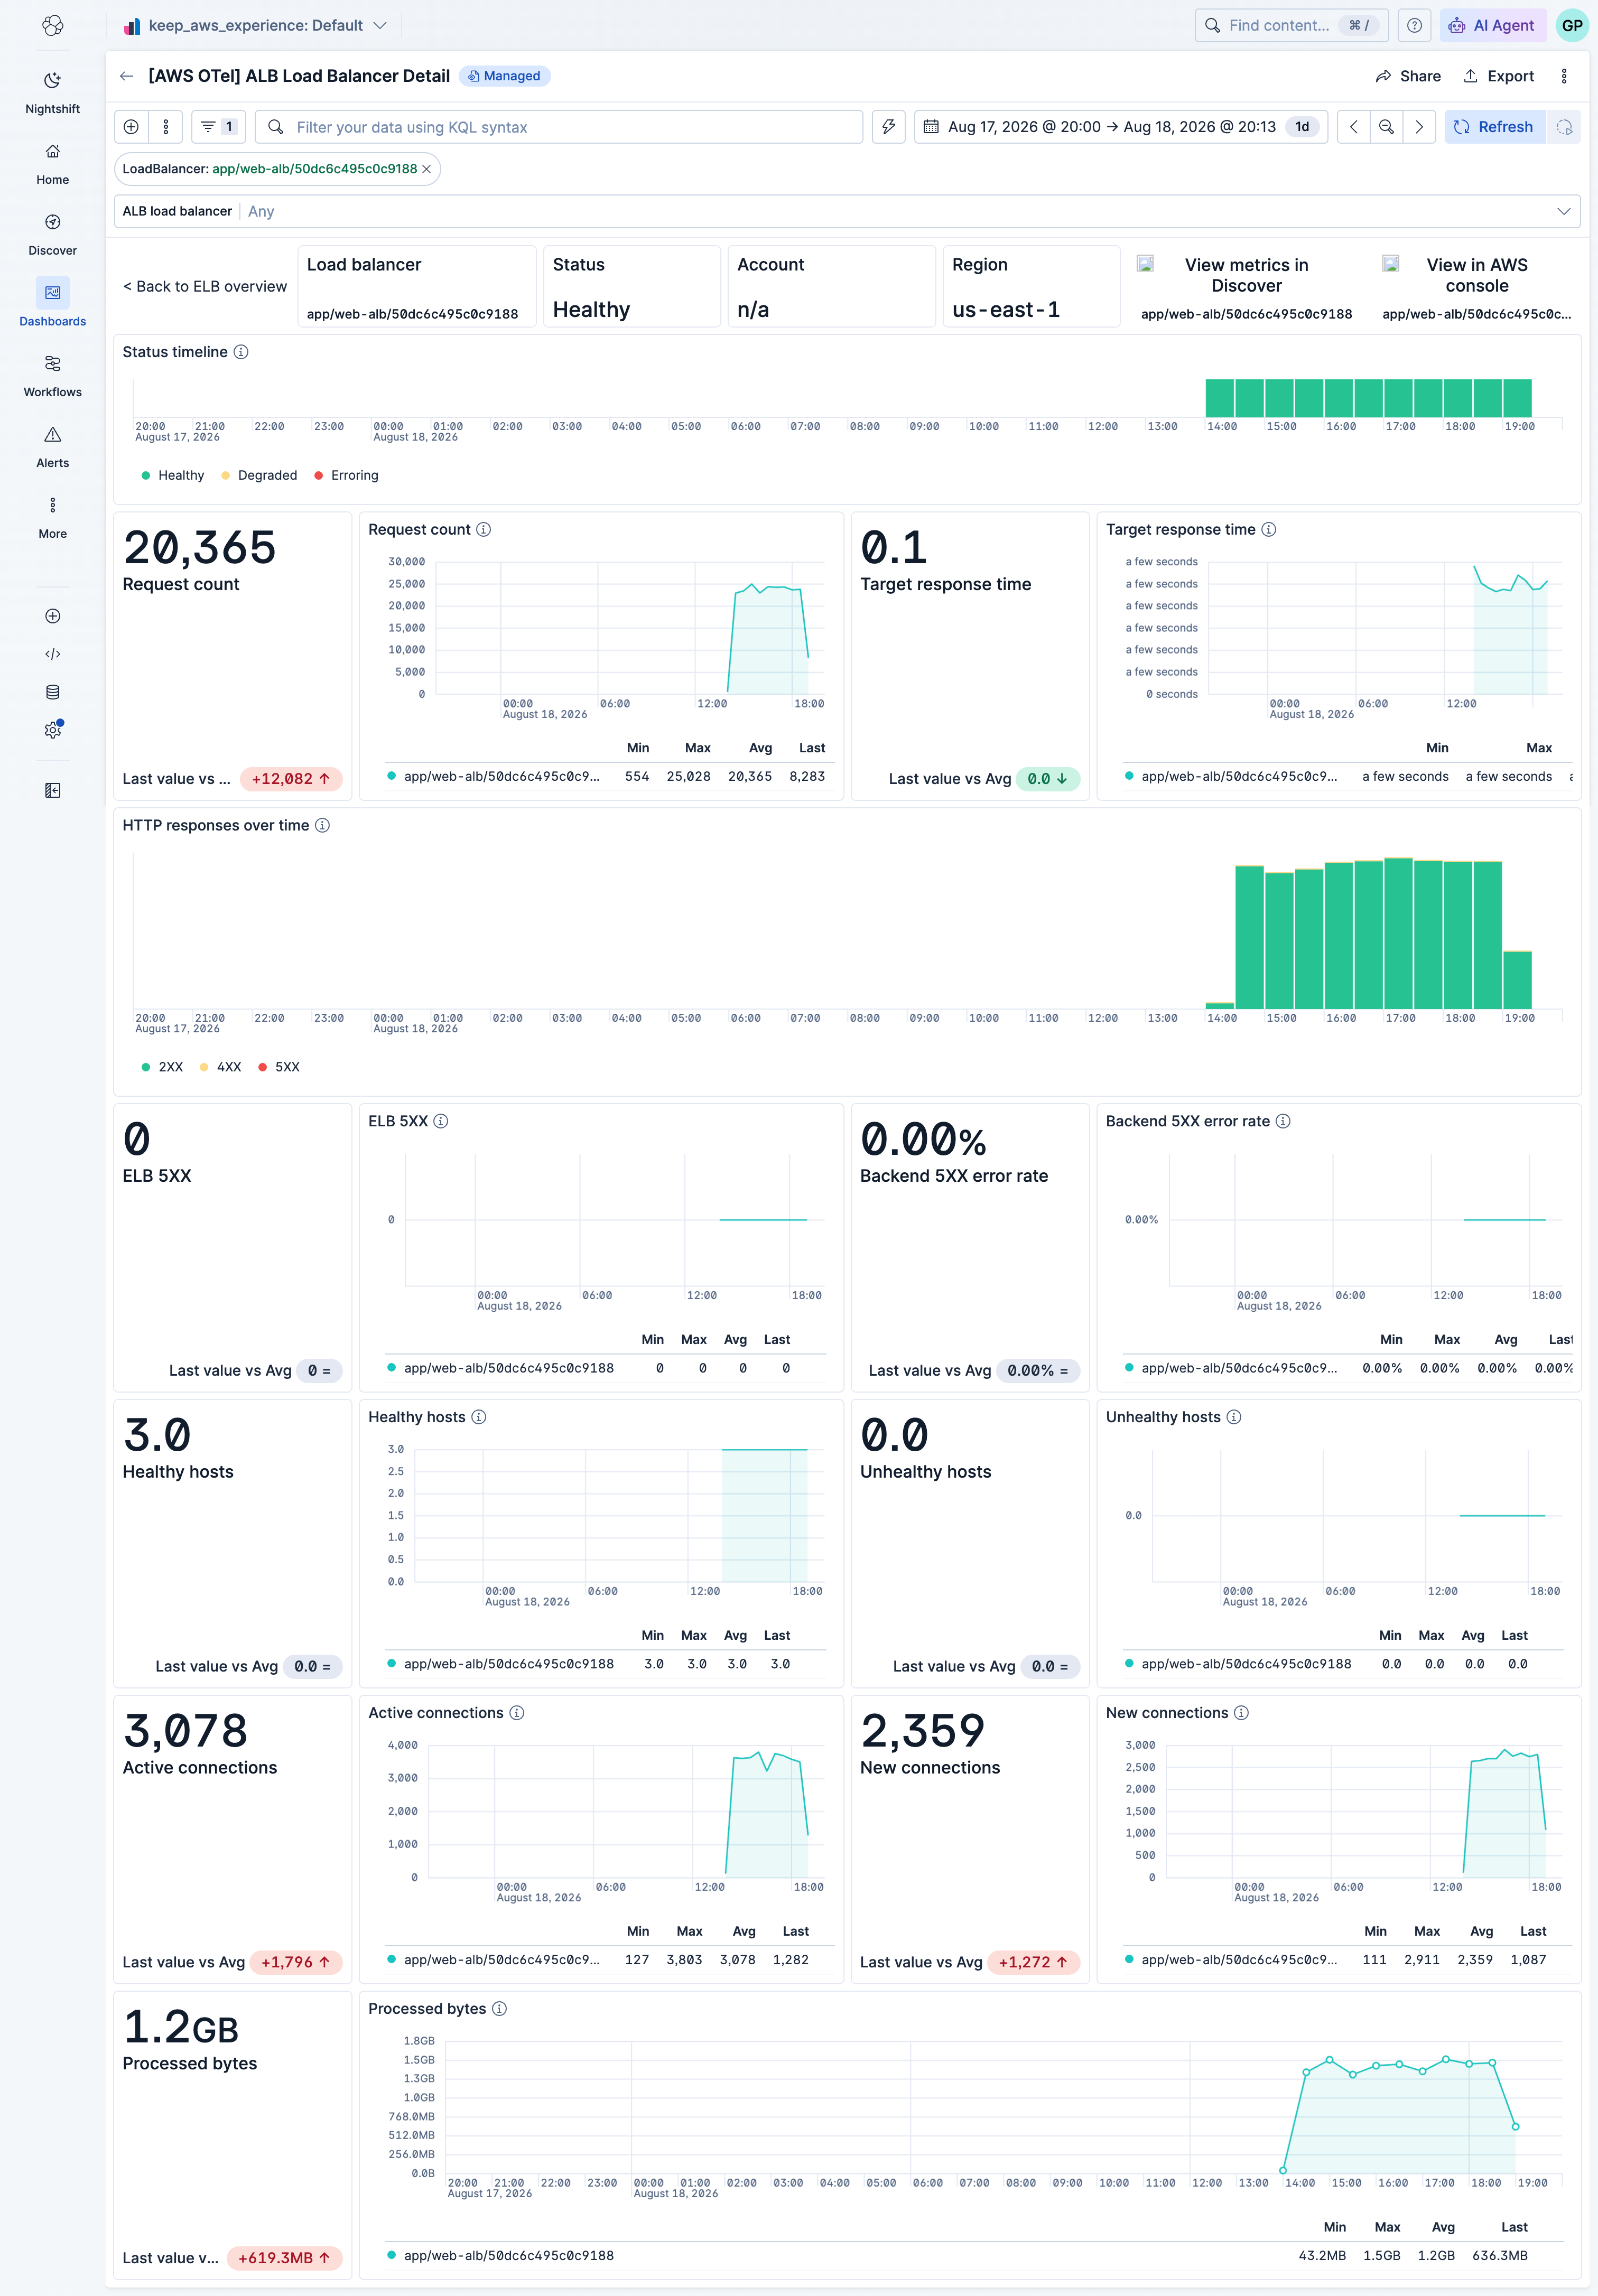
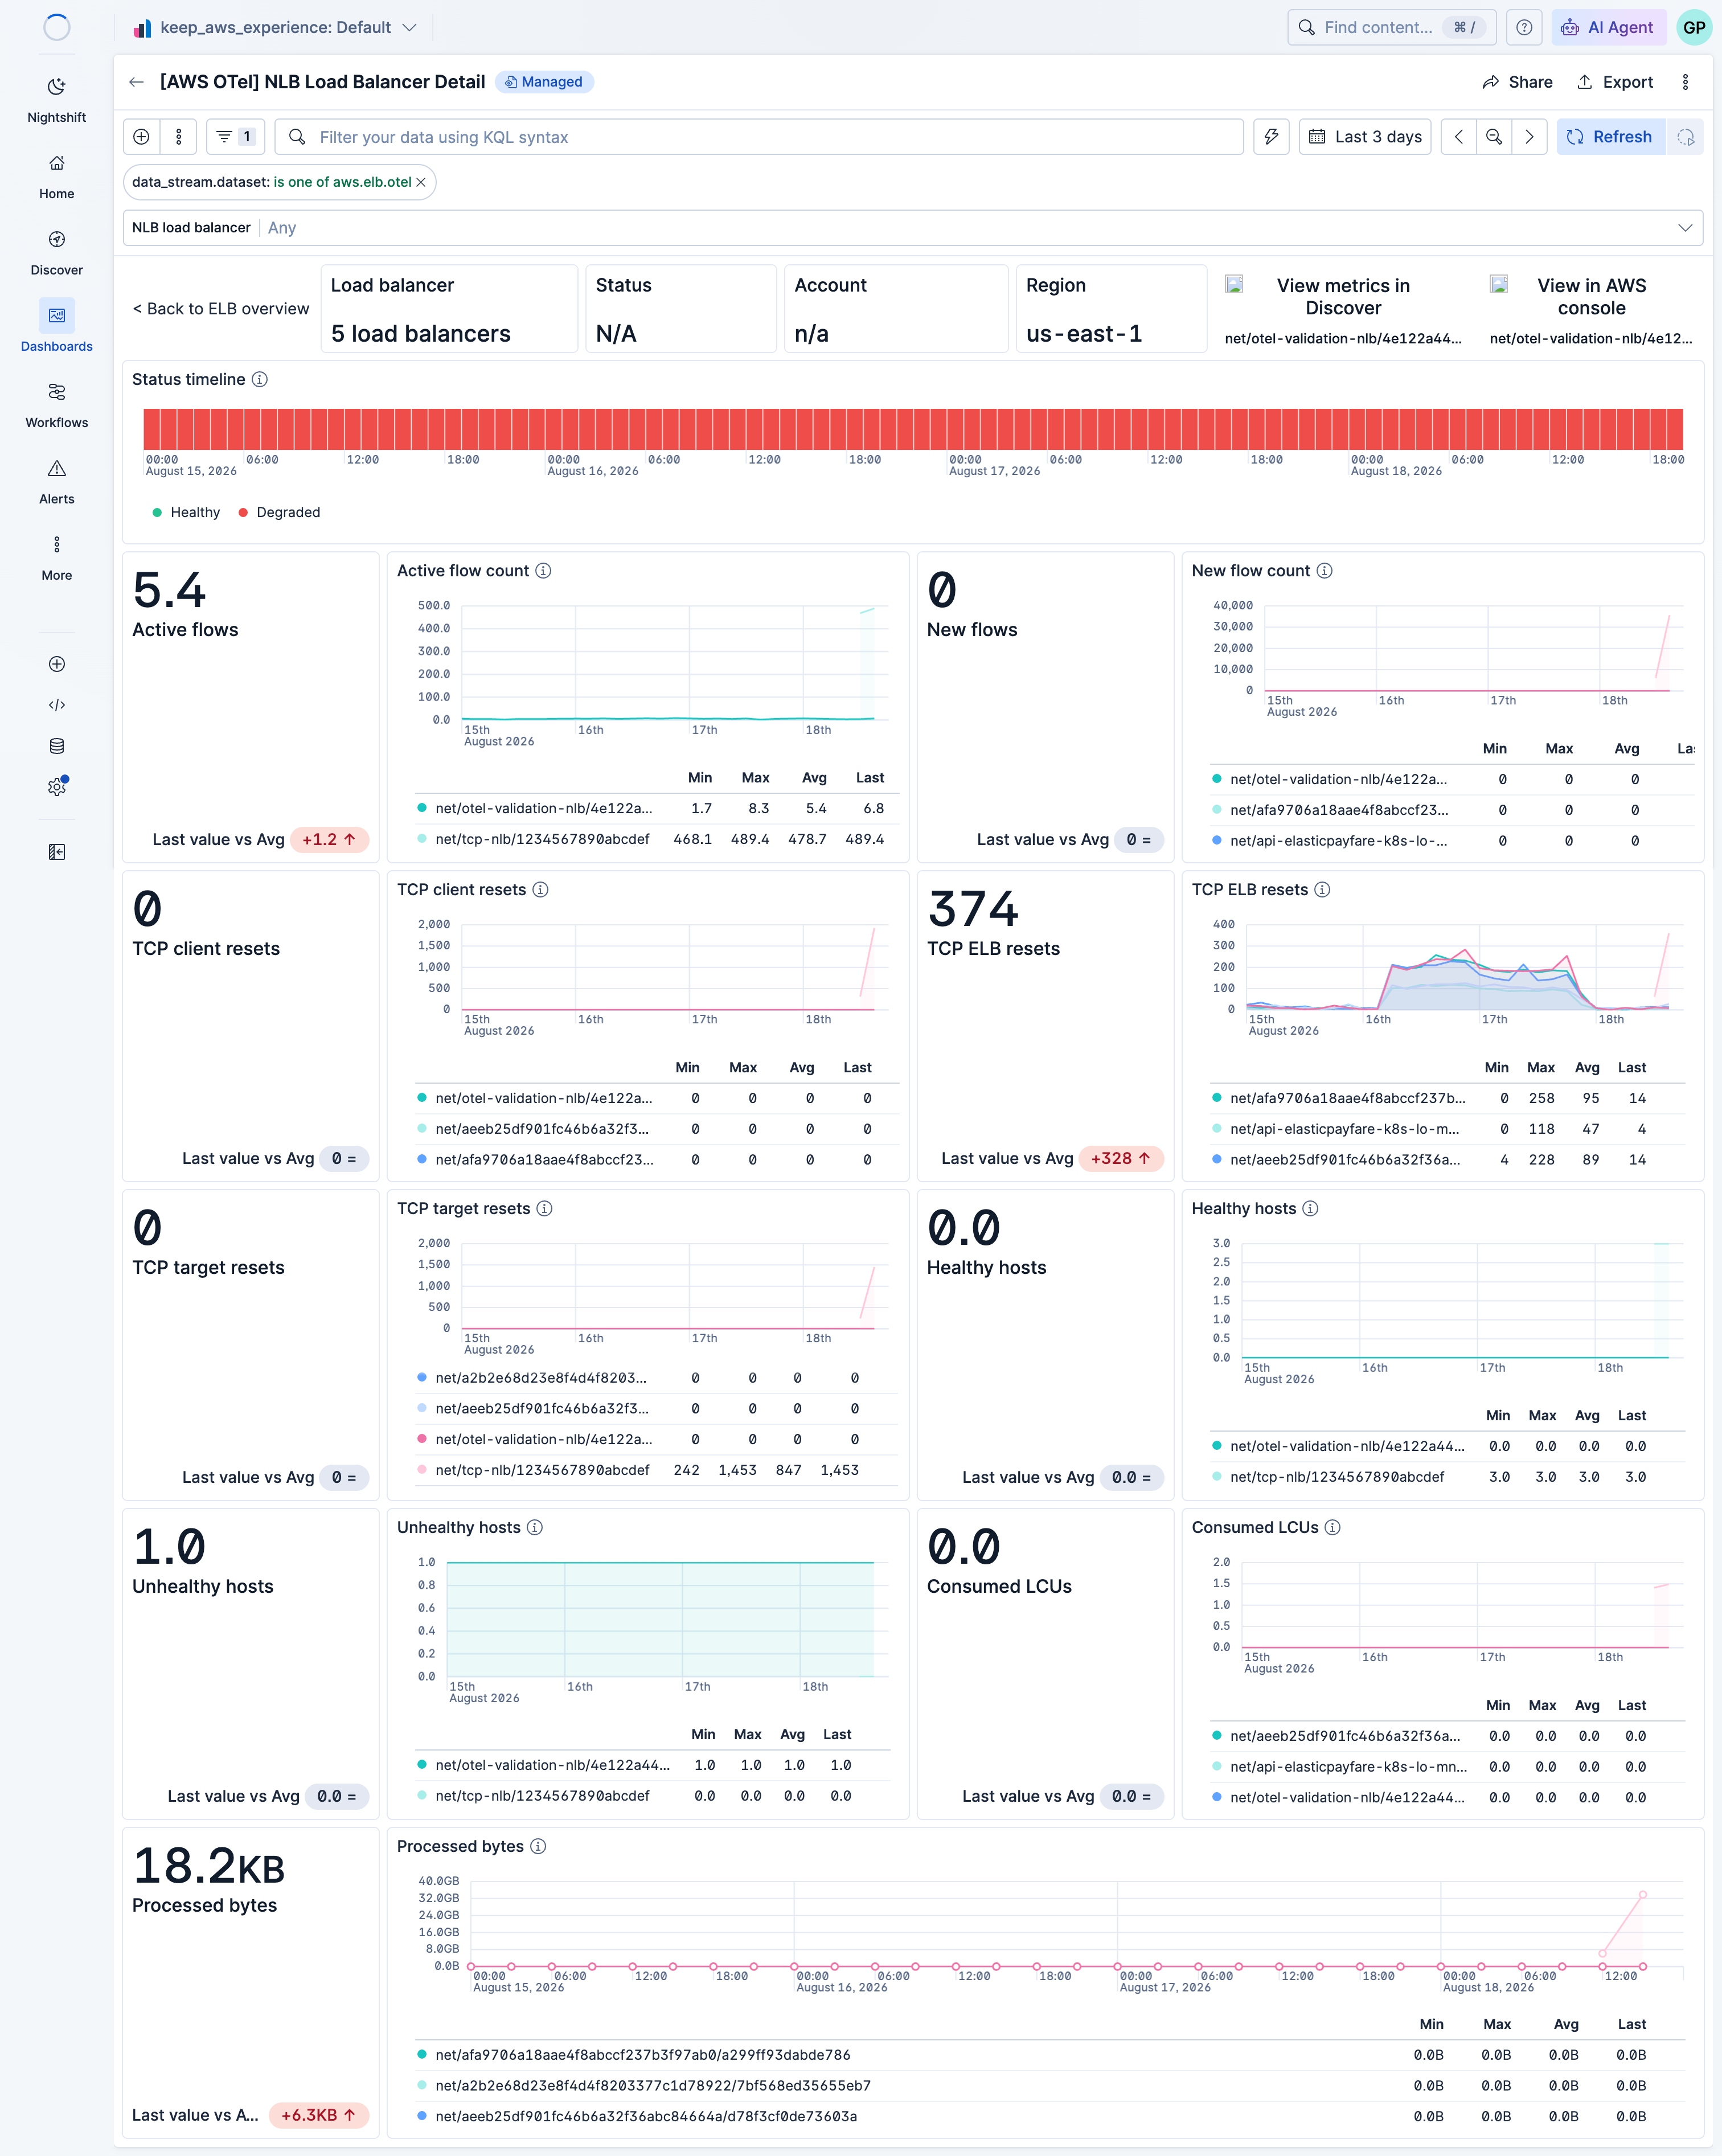
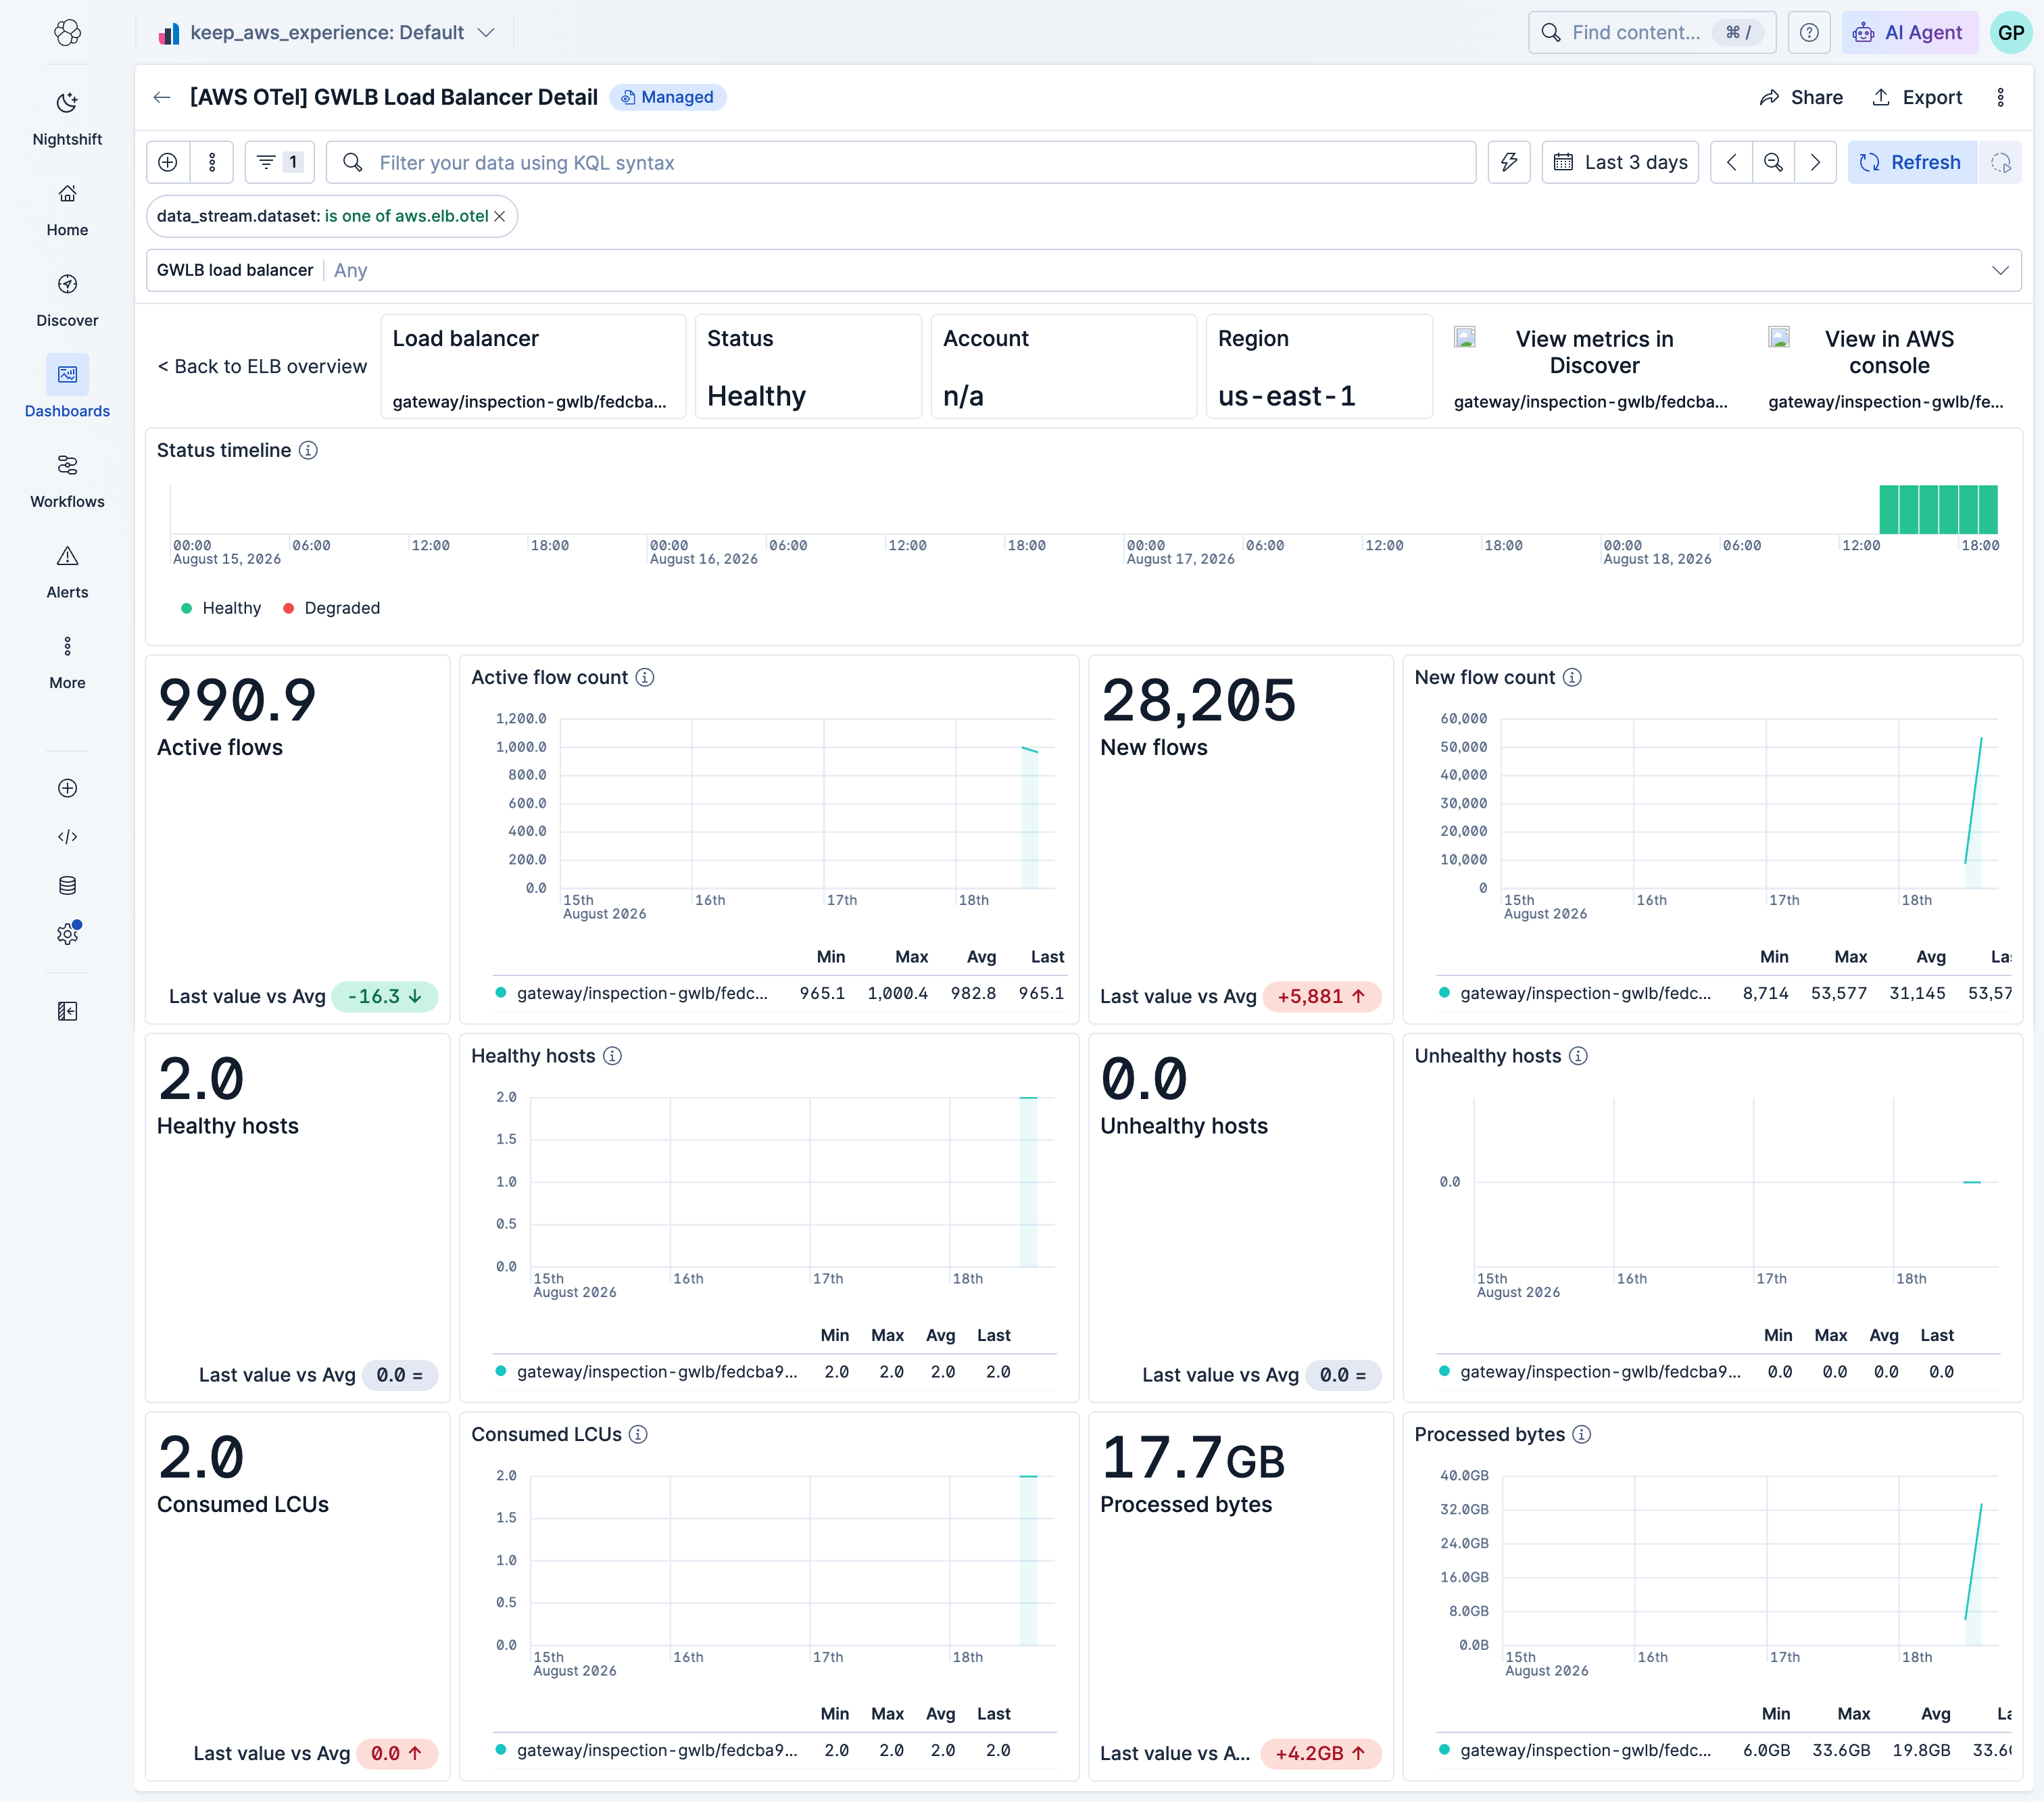
This integration includes one or more Kibana dashboards that visualizes the data collected by the integration. The screenshots below illustrate how the ingested data is displayed.
Changelog
| Version | Details | Minimum Kibana version |
|---|---|---|
| 0.12.0 | Bug fix (View pull request) Replace the deprecated popout icon with external so dashboard navigation cards render correctly. |
9.5.0 |
| 0.11.0 | Enhancement (View pull request) Add ALB, NLB, and GWLB load balancer detail dashboards with drilldowns from the overview dashboard. |
9.5.0 |
| 0.10.0 | Enhancement (View pull request) Add ML anomaly detection modules for ALB target health (response time, unhealthy hosts) and request errors (5XX, rejected connections). Enhancement (View pull request) Add ml_module to the Kibana asset tags. |
9.5.0 |
| 0.9.0 | Enhancement (View pull request) Add tags to Kibana assets |
9.5.0 |
| 0.8.1 | Enhancement (View pull request) Rename the dashboard to "[AWS ELB OTel] Metrics". |
9.5.0 |
| 0.8.0 | Enhancement (View pull request) Remove the idle status and rename "no data" to "Unknown" across ELB dashboard panels. |
9.5.0 |
| 0.7.0 | Enhancement (View pull request) Improve ESQL queries in dashboards |
9.5.0 |
| 0.6.0 | Enhancement (View pull request) Add _dev/build/docs/README.md |
9.5.0 |
| 0.5.0 | Enhancement (View pull request) Improve dashboard queries and visualizations |
9.5.0 |
| 0.4.0 | Enhancement (View pull request) Update aggregation function and remove division by zero in SLO metric filter. |
9.5.0 |
| 0.3.0 | Enhancement (View pull request) Add alert rules and SLOs to README |
9.5.0 |
| 0.2.1 | Enhancement (View pull request) Standardize the package title and description to the AWS <service> <signal> OpenTelemetry Assets naming convention. |
9.5.0 |
| 0.2.0 | Enhancement (View pull request) move assets to aws_elb_metrics_otel |
9.5.0 |
| 0.1.0 | Enhancement (View pull request) Initial AWS ELB metrics OpenTelemetry dashboard package |
9.5.0 |