GCP Cloud Run OpenTelemetry Assets
| Version | 0.3.0
|
| Subscription level What's this? |
Basic |
| Developed by What's this? |
Elastic |
| Minimum Kibana version(s) | 9.6.0 |
To use pre-release integrations, go to the Integrations page in Kibana, scroll down, and toggle on the Display beta integrations option.
This package contains Kibana assets for monitoring Cloud Run services with Google Cloud Monitoring metrics collected by the OpenTelemetry Collector.
The package is content only. It does not configure data collection. Use the Google Cloud Monitoring (OpenTelemetry) input package (googlecloudmonitor_input_otel) to collect Cloud Run metrics into Elasticsearch.
You need Elasticsearch for storing and searching your data and Kibana for visualizing and managing it. You can use our hosted Elasticsearch Service on Elastic Cloud, which is recommended, or self-manage the Elastic Stack on your own hardware.
Install the Google Cloud Monitoring OpenTelemetry Input package (googlecloudmonitor_input_otel) and configure it to collect Cloud Run Cloud Monitoring metrics (for example, run.googleapis.com/request_count). This content package provides assets that visualize data collected by that input.
When configuring the input package, set the dataset name to gcp.cloudrun.otel so that data is written to the metrics-gcp.cloudrun.otel-default data stream, which these dashboards query.
| Dashboard | Description |
|---|---|
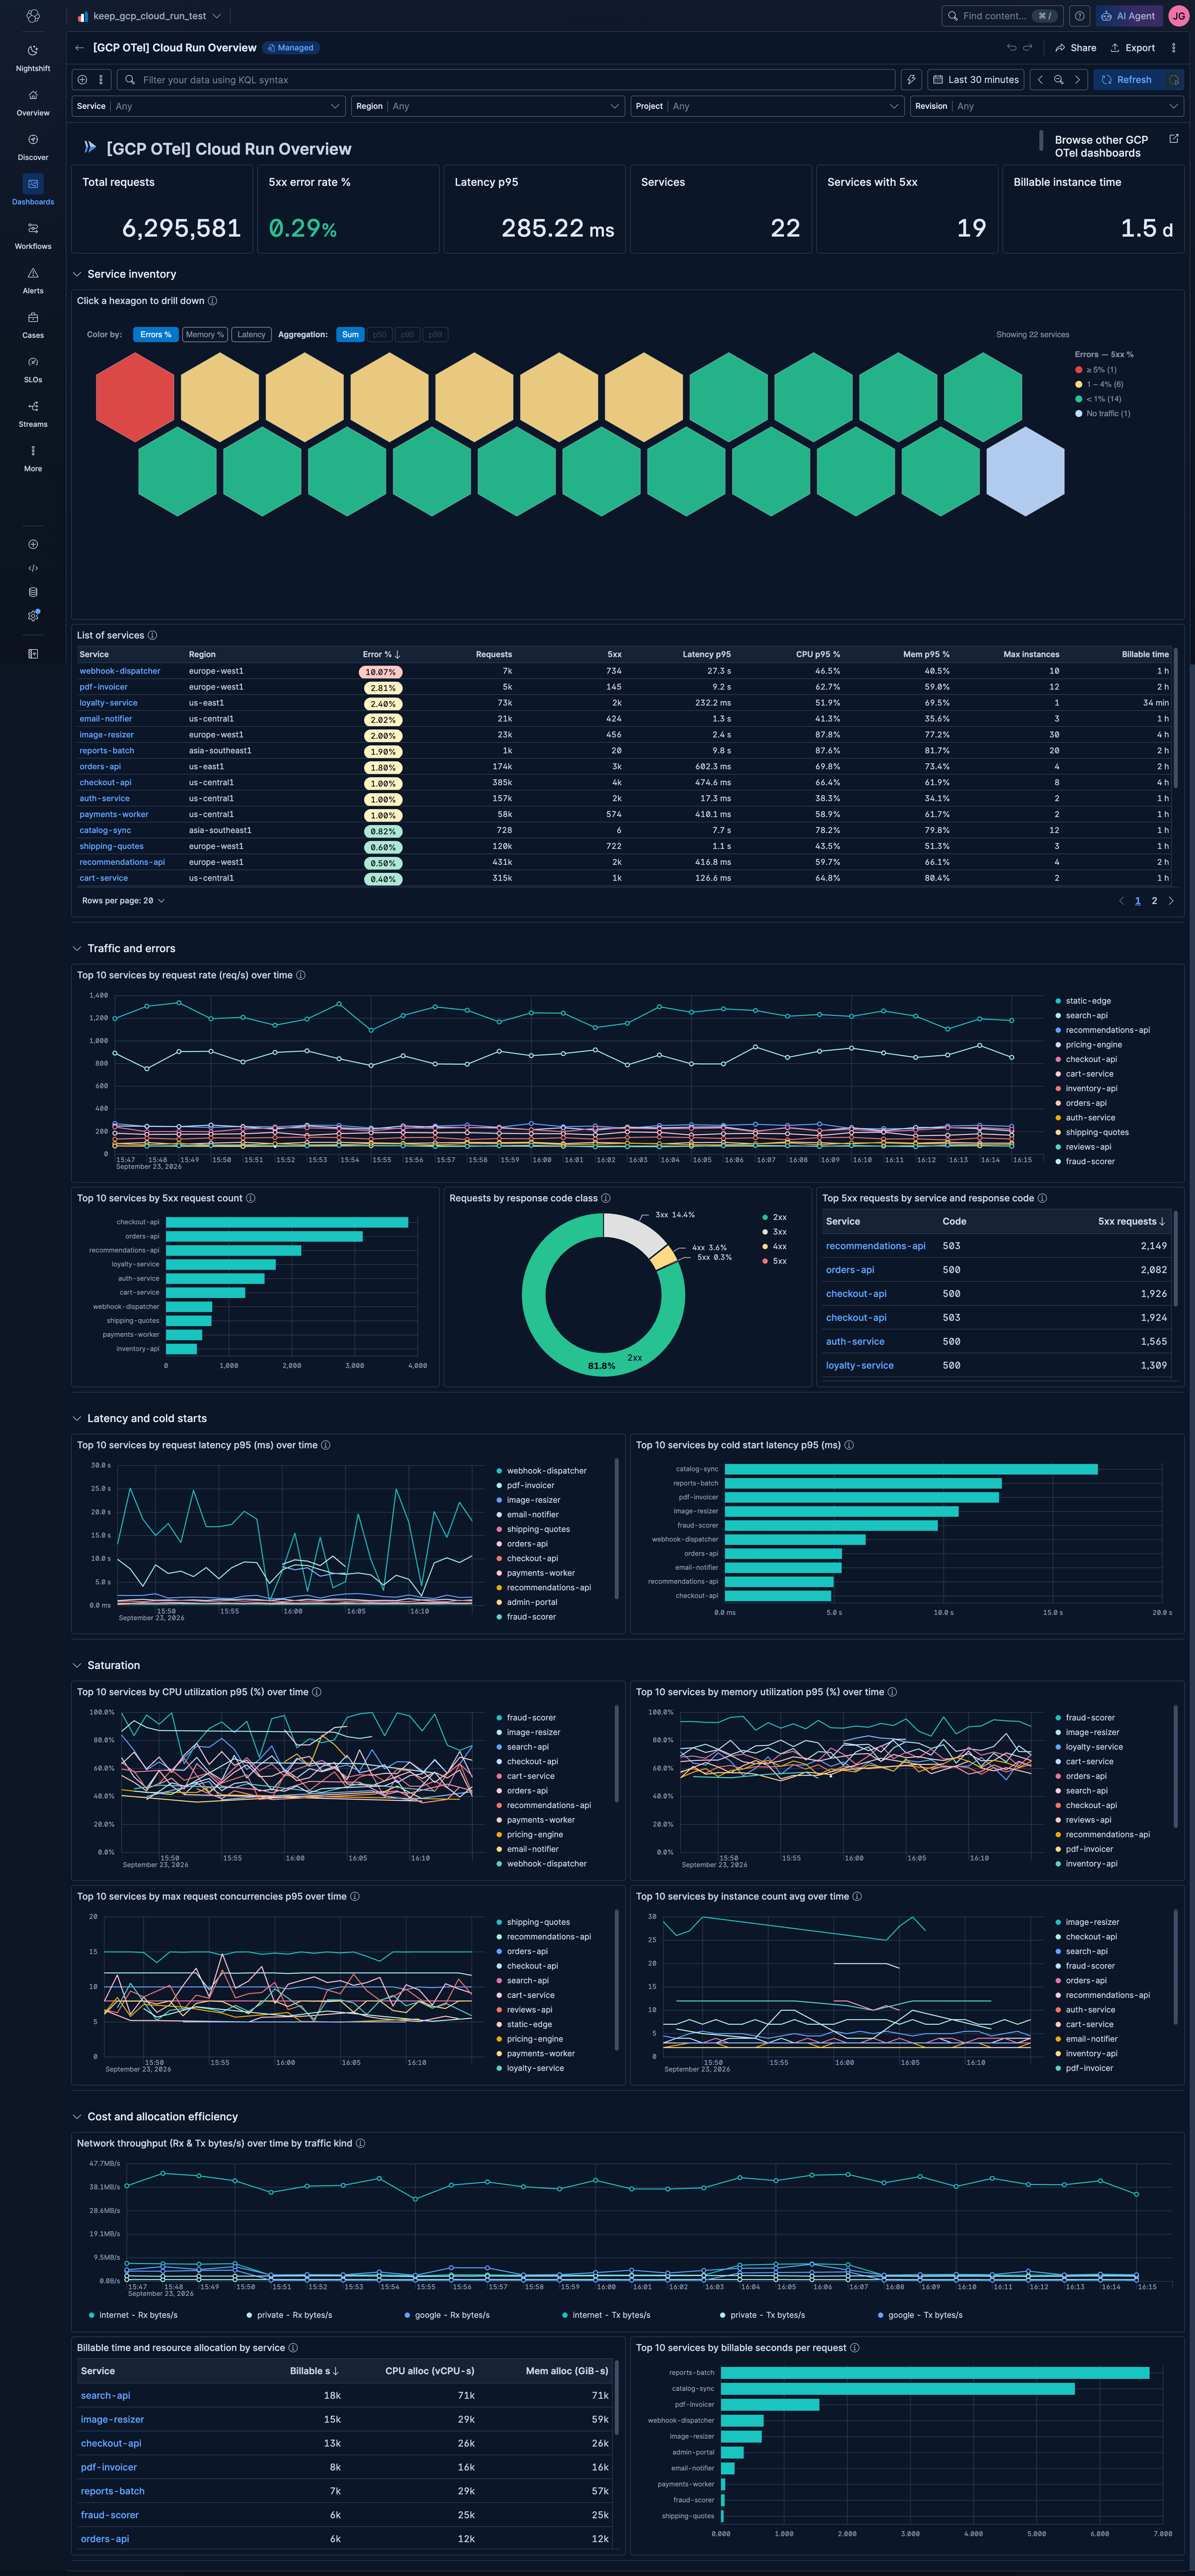
| [GCP OTel] Cloud Run Overview | Overview of all Cloud Run services. Golden signals across the fleet: traffic, errors, latency, saturation, and cost/allocation efficiency. |
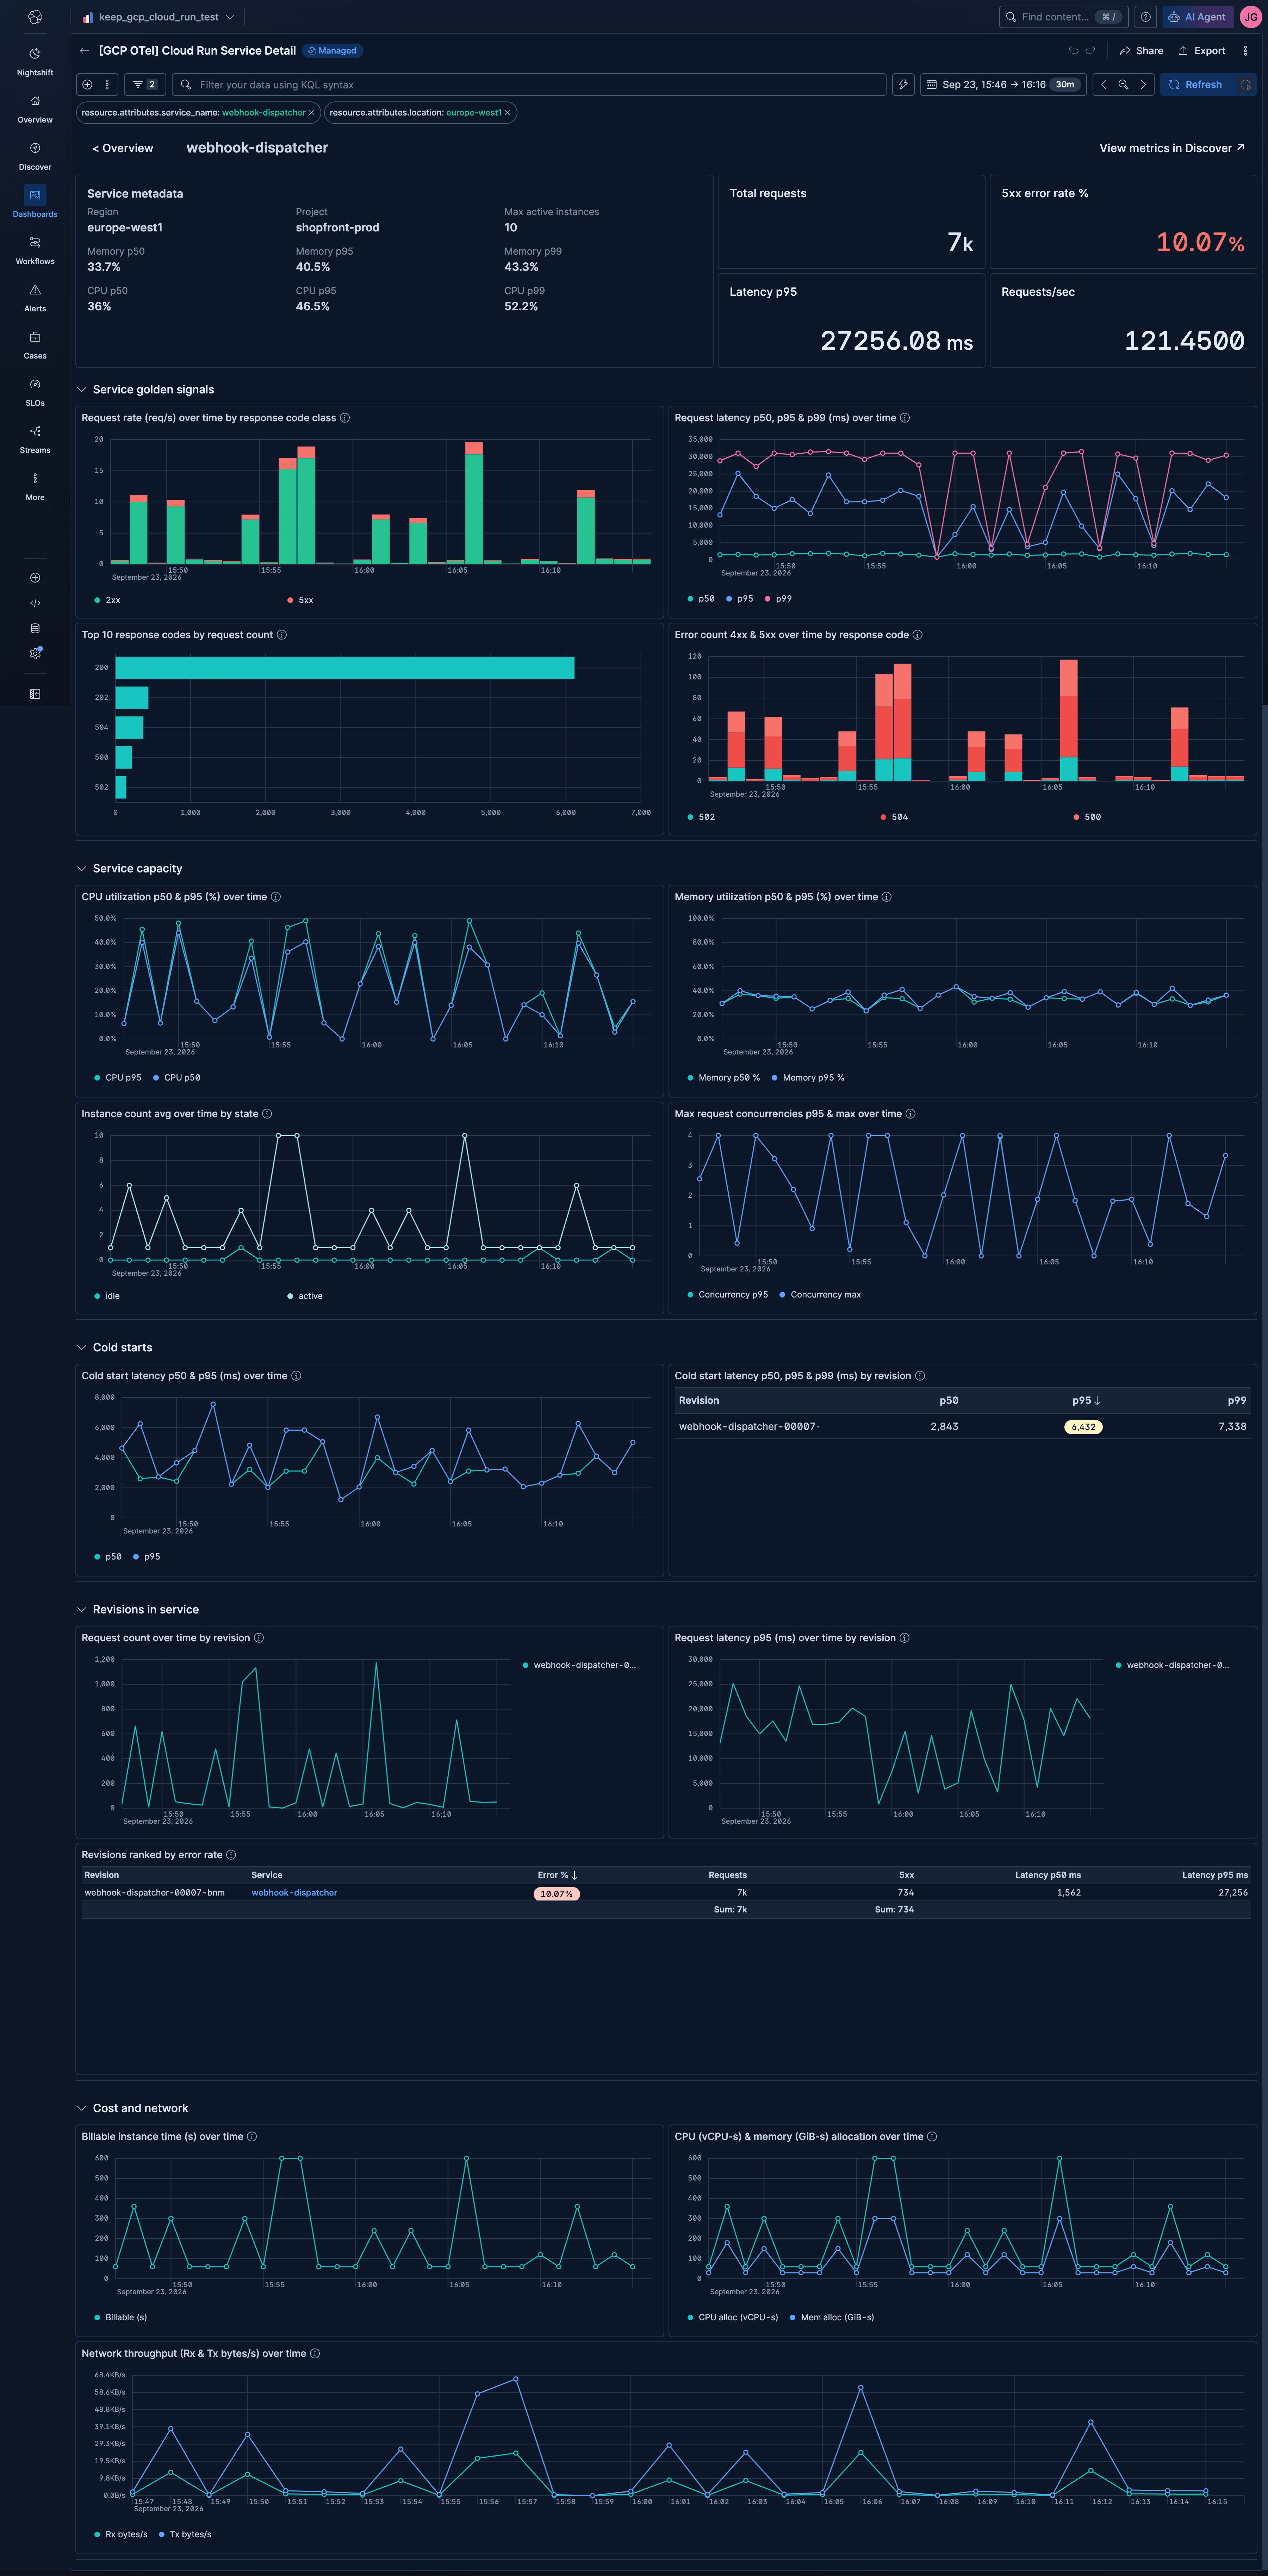
| [GCP OTel] Cloud Run Service Detail | Detail view of a single Cloud Run service. Covers golden signals, capacity and saturation, cold starts, revision rollouts, and cost. |
This integration includes one or more Kibana dashboards that visualizes the data collected by the integration. The screenshots below illustrate how the ingested data is displayed.
Changelog
| Version | Details | Minimum Kibana version |
|---|---|---|
| 0.3.0 | Enhancement (View pull request) Add a "View in Google Console" row action to the service and revision tables, open "View metrics in Discover" in the same tab, fix request rate and network throughput charts that were inflated by the display bucket length by charting totals per time bucket, show total requests in the former requests/sec tile, count sent bytes and CPU and memory allocation from documents that lack the filtered metric, show latency percentiles in the service and revision tables, sum instance counts across revisions, and sort services without memory data last in the saturation summary. |
9.6.0 |
| 0.2.0 | Enhancement (View pull request) Fix the service inventory "View metrics" link to open Discover with the metrics-* data view, and sort null percentiles last in the top 10 latency, CPU, memory and concurrency panels. |
9.6.0 |
| 0.1.0 | Enhancement (View pull request) Initial draft of the GCP Cloud Run OpenTelemetry Assets package. |
9.6.0 |