Elastic GovCloud Integration
| Version | 0.1.0
|
| Subscription level What's this? |
Platinum |
| Developed by What's this? |
Elastic |
| Minimum Kibana version(s) | 9.1.0 8.19.0 |
To use pre-release integrations, go to the Integrations page in Kibana, scroll down, and toggle on the Display beta integrations option.
The Elastic GovCloud integration installs Elasticsearch mappings, an ingest pipeline, and a Kibana dashboard for logs that Elastic GovCloud Hosted pushes into a destination deployment. The first data stream is organization API audit logs from the Self-serving Audit Service. This package does not collect data with Elastic Agent.
Use it to search and visualize Elastic GovCloud Console and API activity for deployments, members, API keys, and other organization-scoped API calls.
This integration is compatible with:
- Elastic GovCloud Hosted organizations on a Platinum or Enterprise subscription
- Destination Elastic Stack 8.19+ or 9.1+ (see package conditions)
It is not a replacement for Elasticsearch or Kibana xpack.security.audit logging, or the ECE Adminconsole ece integration.
- You install this package’s Elasticsearch and Kibana assets on the destination deployment.
- An organization owner enables audit-log delivery with the Elastic Cloud API and an explicit
logs-elastic_govcloud.org_audit-*data stream name. - Elastic Cloud Audit Service writes one JSON document per completed API request.
- The package ingest pipeline maps the flat landing fields to Elastic Common Schema (ECS), enriches the caller IP with GeoIP/ASN, and attaches the default dashboard.
There is no Elastic Agent input, poll interval, or webhook listener.
The Elastic GovCloud integration processes the following logs:
- Organization audit — HTTP API request/response audit records for Elastic Cloud API calls (status, method, URL, client IP, organization, user, API key, optional sanitized request payload)
- Monitor Elastic Cloud API volume and method mix over time
- Investigate 4xx/5xx failures by endpoint and caller
- Attribute activity to users (
user.email/user.id), claimed header identity (elastic_govcloud.org_audit.unvalidated_auth_user), and API keys - Review caller IP addresses and geography on the dashboard map when GeoIP is available
- Confirm whether a request included a sanitized payload, without placing payload contents on the default dashboard
These events are restricted (emails, IPs, and possible customer content in URLs or payloads). Limit Kibana and index access accordingly.
- An Elastic GovCloud Hosted organization on Platinum or Enterprise subscription
- A destination deployment in that organization (the cluster that will store the audit logs)
- Organization-owner (or equivalent) permission to call
POST /api/v1/organizations/<ORG_ID>/audit_logs - This package installed on that destination deployment before the first audit document is written
This integration does not use Elastic Agent. Do not add it to an agent policy for collection. Install assets only.
1. Install integration assets
In Kibana on the destination deployment:
- Go to Management → Integrations.
- Search for Elastic GovCloud.
- Click Add Elastic GovCloud.
- Click Install assets only (no agent policy needed).
- Confirm installation.
This installs:
- Index templates for
logs-elastic_govcloud.org_audit-* - Ingest pipeline for the
elastic_govcloud.org_auditdata stream - Field mappings (ECS +
elastic_govcloud.org_audit.api_key.*) - The [Elastic GovCloud] Organization Audit Logs dashboard (uses the stack
logs-*data view)
2. Enable audit-log delivery (API only)
There is no Cloud Console UI for this step. As an organization owner, enable delivery against the destination deployment and pass a logs-elastic_govcloud.org_audit-* data-stream name.
If you omit index, events land on a classic index called elastic-org<ORG_ID>-audit.
POST /api/v1/organizations/<ORG_ID>/audit_logs
Authorization: ApiKey <cloud_api_key>
Content-Type: application/json

{
  "deployment_id": "<DESTINATION_DEPLOYMENT_ID>",
  "index": "logs-elastic_govcloud.org_audit-default"
}
Use a different data-stream namespace if needed (logs-elastic_govcloud.org_audit-<namespace>). The name must match a logs-elastic_govcloud.org_audit-* data stream so Fleet index templates apply.
GET /api/v1/organizations/<ORG_ID>/audit_logs returns the configured deployment_id and index. DELETE turns off delivery and invalidates the writer API key, but does not delete already indexed documents.
3. GeoIP (recommended)
Caller IPs are mapped to client.ip and enriched with client.geo / client.as when the GeoIP databases are available. Enable the downloader if it is not already on:
PUT /_cluster/settings
{
  "persistent": {
    "ingest.geoip.downloader.enabled": true
  }
}
- Generate Elastic Cloud API traffic (for example list deployments or members).
- In Discover, select the
logs-*data view and filter onevent.dataset: elastic_govcloud.org_audit. - Confirm documents have
@timestamp,http.response.status_code,url.full, andevent.dataset: elastic_govcloud.org_audit. - Open [Elastic GovCloud] Organization Audit Logs and confirm panels populate.
If documents appear under elastic-org<ORG_ID>-audit instead, the enable request omitted a logs-elastic_govcloud.org_audit-* index. Re-enable with "index": "logs-elastic_govcloud.org_audit-default" after this package is installed.
For help with Elastic ingest tools, check Common problems.
No events in the dashboard or logs-elastic_govcloud.org_audit-*
- Confirm assets were installed on the destination deployment before enablement.
GET /api/v1/organizations/<ORG_ID>/audit_logsand verifyindexis alogs-elastic_govcloud.org_audit-*name, notelastic-org...-audit.- Confirm organization subscription is Platinum or Enterprise (
POSTis rejected otherwise). - The dashboard filters on
event.dataset: elastic_govcloud.org_audit. Cloud does not sendevent.dataset. The package mapping fillsevent.datasetandevent.module. Documents ingested before this package version need a reindex (or wait for new events).
Events exist but fields are still status_code / request_url
The ingest pipeline did not run. The destination name is not using the package data-stream template. Re-enable with a logs-elastic_govcloud.org_audit-* index after installing this package.
Missing GeoIP fields
Private or documentation-range IPs do not resolve. For public IPs, check GET /_ingest/geoip/stats and wait for the databases to download.
Restricted data
Audit documents include personal data (user.email, user.id, client.ip) and can include customer content in url.full or http.request.body.content. Restrict index and dashboard access. Do not put payload contents on shared boards.
For more information on architectures that can be used for scaling this integration, check the Ingest Architectures documentation.
Delivery is a control-plane push into your destination deployment. There is no customer collector to scale. Retention follows the cluster’s logs data-stream lifecycle / ILM for logs-elastic_govcloud.org_audit-*. The writer does not manage ILM.
The org_audit data stream stores one event per completed Elastic Cloud API request. Optional fields (user.email, API key name, request payload) can be absent on a given event. Sentinel value unknown on user.id or organization.id is left as-is. Sentinel unknown on api_key_id and unvalidated_auth_user is dropped. user.id is the acting user resolved by authorization. elastic_govcloud.org_audit.unvalidated_auth_user is the identity claimed in the request headers and is not copied onto user.id. Host+path request_url values are stored as https:// URLs in url.original and url.full.
Example
{
    "@timestamp": "2026-01-01T12:00:00.000Z",
    "client": {
        "address": "198.51.100.10",
        "as": {
            "number": 64501,
            "organization": {
                "name": "Documentation ASN"
            }
        },
        "geo": {
            "city_name": "Amsterdam",
            "continent_name": "Europe",
            "country_iso_code": "NL",
            "country_name": "Netherlands",
            "location": {
                "lat": 52.37404,
                "lon": 4.88969
            },
            "region_iso_code": "NL-NH",
            "region_name": "North Holland"
        },
        "ip": "198.51.100.10"
    },
    "data_stream": {
        "dataset": "elastic_govcloud.org_audit",
        "namespace": "default",
        "type": "logs"
    },
    "ecs": {
        "version": "9.5.0"
    },
    "event": {
        "category": [
            "api"
        ],
        "dataset": "elastic_govcloud.org_audit",
        "kind": "event",
        "module": "elastic_govcloud",
        "outcome": "success",
        "type": [
            "access"
        ]
    },
    "http": {
        "request": {
            "body": {
                "content": "{\"name\":\"example-deployment\",\"region\":\"gcp-us-central1\"}"
            },
            "method": "POST"
        },
        "response": {
            "status_code": 200
        }
    },
    "log": {
        "level": "INFO"
    },
    "observer": {
        "product": "Elastic GovCloud",
        "vendor": "Elastic"
    },
    "organization": {
        "id": "1000000001"
    },
    "related": {
        "ip": [
            "198.51.100.10"
        ],
        "user": [
            "u_example_abc123def456",
            "user@example.com"
        ]
    },
    "service": {
        "id": "0123456789abcdef0123456789abcdef"
    },
    "url": {
        "domain": "cloud.example.com",
        "full": "https://cloud.example.com/api/v1/deployments/0123456789abcdef0123456789abcdef",
        "path": "/api/v1/deployments/0123456789abcdef0123456789abcdef",
        "scheme": "https",
        "original": "https://cloud.example.com/api/v1/deployments/0123456789abcdef0123456789abcdef"
    },
    "user": {
        "email": "user@example.com",
        "id": "u_example_abc123def456"
    },
    "elastic_govcloud": {
        "org_audit": {
            "api_key": {
                "id": "ak_example_0a1b2c3d4e5f",
                "name": "ci-deploy-key"
            },
            "unvalidated_auth_user": "u_example_abc123def456"
        }
    }
}
Exported fields
| Field | Description | Type |
|---|---|---|
| @timestamp | Date/time when the event originated. This is the date/time extracted from the event, typically representing when the event was generated by the source. If the event source has no original timestamp, this value is typically populated by the first time the event was received by the pipeline. Required field for all events. | date |
| client.address | Some event client addresses are defined ambiguously. The event will sometimes list an IP, a domain or a unix socket. You should always store the raw address in the .address field. Then it should be duplicated to .ip or .domain, depending on which one it is. |
keyword |
| client.as.number | Unique number allocated to the autonomous system. The autonomous system number (ASN) uniquely identifies each network on the Internet. | long |
| client.as.organization.name | Organization name. | keyword |
| client.as.organization.name.text | Multi-field of client.as.organization.name. |
match_only_text |
| client.geo.city_name | City name. | keyword |
| client.geo.continent_name | Name of the continent. | keyword |
| client.geo.country_iso_code | Country ISO code. | keyword |
| client.geo.country_name | Country name. | keyword |
| client.geo.location | Longitude and latitude. | geo_point |
| client.geo.region_iso_code | Region ISO code. | keyword |
| client.geo.region_name | Region name. | keyword |
| client.geo.timezone | The time zone of the location, such as IANA time zone name. | keyword |
| client.ip | IP address of the client (IPv4 or IPv6). | ip |
| data_stream.dataset | The field can contain anything that makes sense to signify the source of the data. Examples include nginx.access, prometheus, endpoint etc. For data streams that otherwise fit, but that do not have dataset set we use the value "generic" for the dataset value. event.dataset should have the same value as data_stream.dataset. Beyond the Elasticsearch data stream naming criteria noted above, the dataset value has additional restrictions: * Must not contain - * No longer than 100 characters |
constant_keyword |
| data_stream.namespace | A user defined namespace. Namespaces are useful to allow grouping of data. Many users already organize their indices this way, and the data stream naming scheme now provides this best practice as a default. Many users will populate this field with default. If no value is used, it falls back to default. Beyond the Elasticsearch index naming criteria noted above, namespace value has the additional restrictions: * Must not contain - * No longer than 100 characters |
constant_keyword |
| data_stream.type | An overarching type for the data stream. Currently allowed values are "logs" and "metrics". We expect to also add "traces" and "synthetics" in the near future. | constant_keyword |
| ecs.version | ECS version this event conforms to. ecs.version is a required field and must exist in all events. When querying across multiple indices -- which may conform to slightly different ECS versions -- this field lets integrations adjust to the schema version of the events. |
keyword |
| elastic_govcloud.org_audit.api_key.id | Identifier of the API key that authenticated the request. Omitted when the request was not API-key authenticated. | keyword |
| elastic_govcloud.org_audit.api_key.name | User-chosen label of the API key. Present only for API-key authenticated requests. | keyword |
| elastic_govcloud.org_audit.unvalidated_auth_user | Identity claimed in the request headers (Basic username, JWT or session-cookie subject) before authorization resolves an acting user. Distinct from user.id. Omitted when the source value is the sentinel unknown. |
keyword |
| error.message | Error message. | match_only_text |
| event.category | This is one of four ECS Categorization Fields, and indicates the second level in the ECS category hierarchy. event.category represents the "big buckets" of ECS categories. For example, filtering on event.category:process yields all events relating to process activity. This field is closely related to event.type, which is used as a subcategory. This field is an array. This will allow proper categorization of some events that fall in multiple categories. |
keyword |
| event.dataset | Name of the dataset. If an event source publishes more than one type of log or events (e.g. access log, error log), the dataset is used to specify which one the event comes from. It's recommended but not required to start the dataset name with the module name, followed by a dot, then the dataset name. | constant_keyword |
| event.kind | This is one of four ECS Categorization Fields, and indicates the highest level in the ECS category hierarchy. event.kind gives high-level information about what type of information the event contains, without being specific to the contents of the event. For example, values of this field distinguish alert events from metric events. The value of this field can be used to inform how these kinds of events should be handled. They may warrant different retention, different access control, it may also help understand whether the data is coming in at a regular interval or not. |
keyword |
| event.module | Name of the module this data is coming from. If your monitoring agent supports the concept of modules or plugins to process events of a given source (e.g. Apache logs), event.module should contain the name of this module. |
constant_keyword |
| event.outcome | This is one of four ECS Categorization Fields, and indicates the lowest level in the ECS category hierarchy. event.outcome simply denotes whether the event represents a success or a failure from the perspective of the entity that produced the event. Note that when a single transaction is described in multiple events, each event may populate different values of event.outcome, according to their perspective. Also note that in the case of a compound event (a single event that contains multiple logical events), this field should be populated with the value that best captures the overall success or failure from the perspective of the event producer. Further note that not all events will have an associated outcome. For example, this field is generally not populated for metric events, events with event.type:info, or any events for which an outcome does not make logical sense. |
keyword |
| event.type | This is one of four ECS Categorization Fields, and indicates the third level in the ECS category hierarchy. event.type represents a categorization "sub-bucket" that, when used along with the event.category field values, enables filtering events down to a level appropriate for single visualization. This field is an array. This will allow proper categorization of some events that fall in multiple event types. |
keyword |
| http.request.body.content | The full HTTP request body. | wildcard |
| http.request.body.content.text | Multi-field of http.request.body.content. |
match_only_text |
| http.request.method | HTTP request method. The value should retain its casing from the original event. For example, GET, get, and GeT are all considered valid values for this field. |
keyword |
| http.response.status_code | HTTP response status code. | long |
| log.level | Original log level of the log event. If the source of the event provides a log level or textual severity, this is the one that goes in log.level. If your source doesn't specify one, you may put your event transport's severity here (e.g. Syslog severity). Some examples are warn, err, i, informational. |
keyword |
| observer.product | The product name of the observer. | keyword |
| observer.vendor | Vendor name of the observer. | keyword |
| organization.id | Unique identifier for the organization. | keyword |
| related.ip | All of the IPs seen on your event. | ip |
| related.user | All the user names or other user identifiers seen on the event. | keyword |
| service.id | Unique identifier of the running service. If the service is comprised of many nodes, the service.id should be the same for all nodes. This id should uniquely identify the service. This makes it possible to correlate logs and metrics for one specific service, no matter which particular node emitted the event. Note that if you need to see the events from one specific host of the service, you should filter on that host.name or host.id instead. |
keyword |
| tags | List of keywords used to tag each event. | keyword |
| url.domain | Domain of the url, such as "www.elastic.co". In some cases a URL may refer to an IP and/or port directly, without a domain name. In this case, the IP address would go to the domain field. If the URL contains a literal IPv6 address enclosed by [ and ] (IETF RFC 2732), the [ and ] characters should also be captured in the domain field. |
keyword |
| url.full | If full URLs are important to your use case, they should be stored in url.full, whether this field is reconstructed or present in the event source. |
wildcard |
| url.full.text | Multi-field of url.full. |
match_only_text |
| url.original | Unmodified original url as seen in the event source. Note that in network monitoring, the observed URL may be a full URL, whereas in access logs, the URL is often just represented as a path. This field is meant to represent the URL as it was observed, complete or not. | wildcard |
| url.original.text | Multi-field of url.original. |
match_only_text |
| url.path | Path of the request, such as "/search". | wildcard |
| url.scheme | Scheme of the request, such as "https". Note: The : is not part of the scheme. |
keyword |
| user.email | User email address. | keyword |
| user.id | Unique identifier of the user. | keyword |
This package has no Elastic Agent inputs.
These Elastic Cloud APIs enable, inspect, and turn off delivery. They are not used by Elastic Agent, and they are not a search API for audit events.
POST /api/v1/organizations/<ORG_ID>/audit_logs— enable or re-enable delivery (deployment_idrequired; passindexaslogs-elastic_govcloud.org_audit-default)GET /api/v1/organizations/<ORG_ID>/audit_logs— status (deployment_id,index)DELETE /api/v1/organizations/<ORG_ID>/audit_logs— turn off delivery
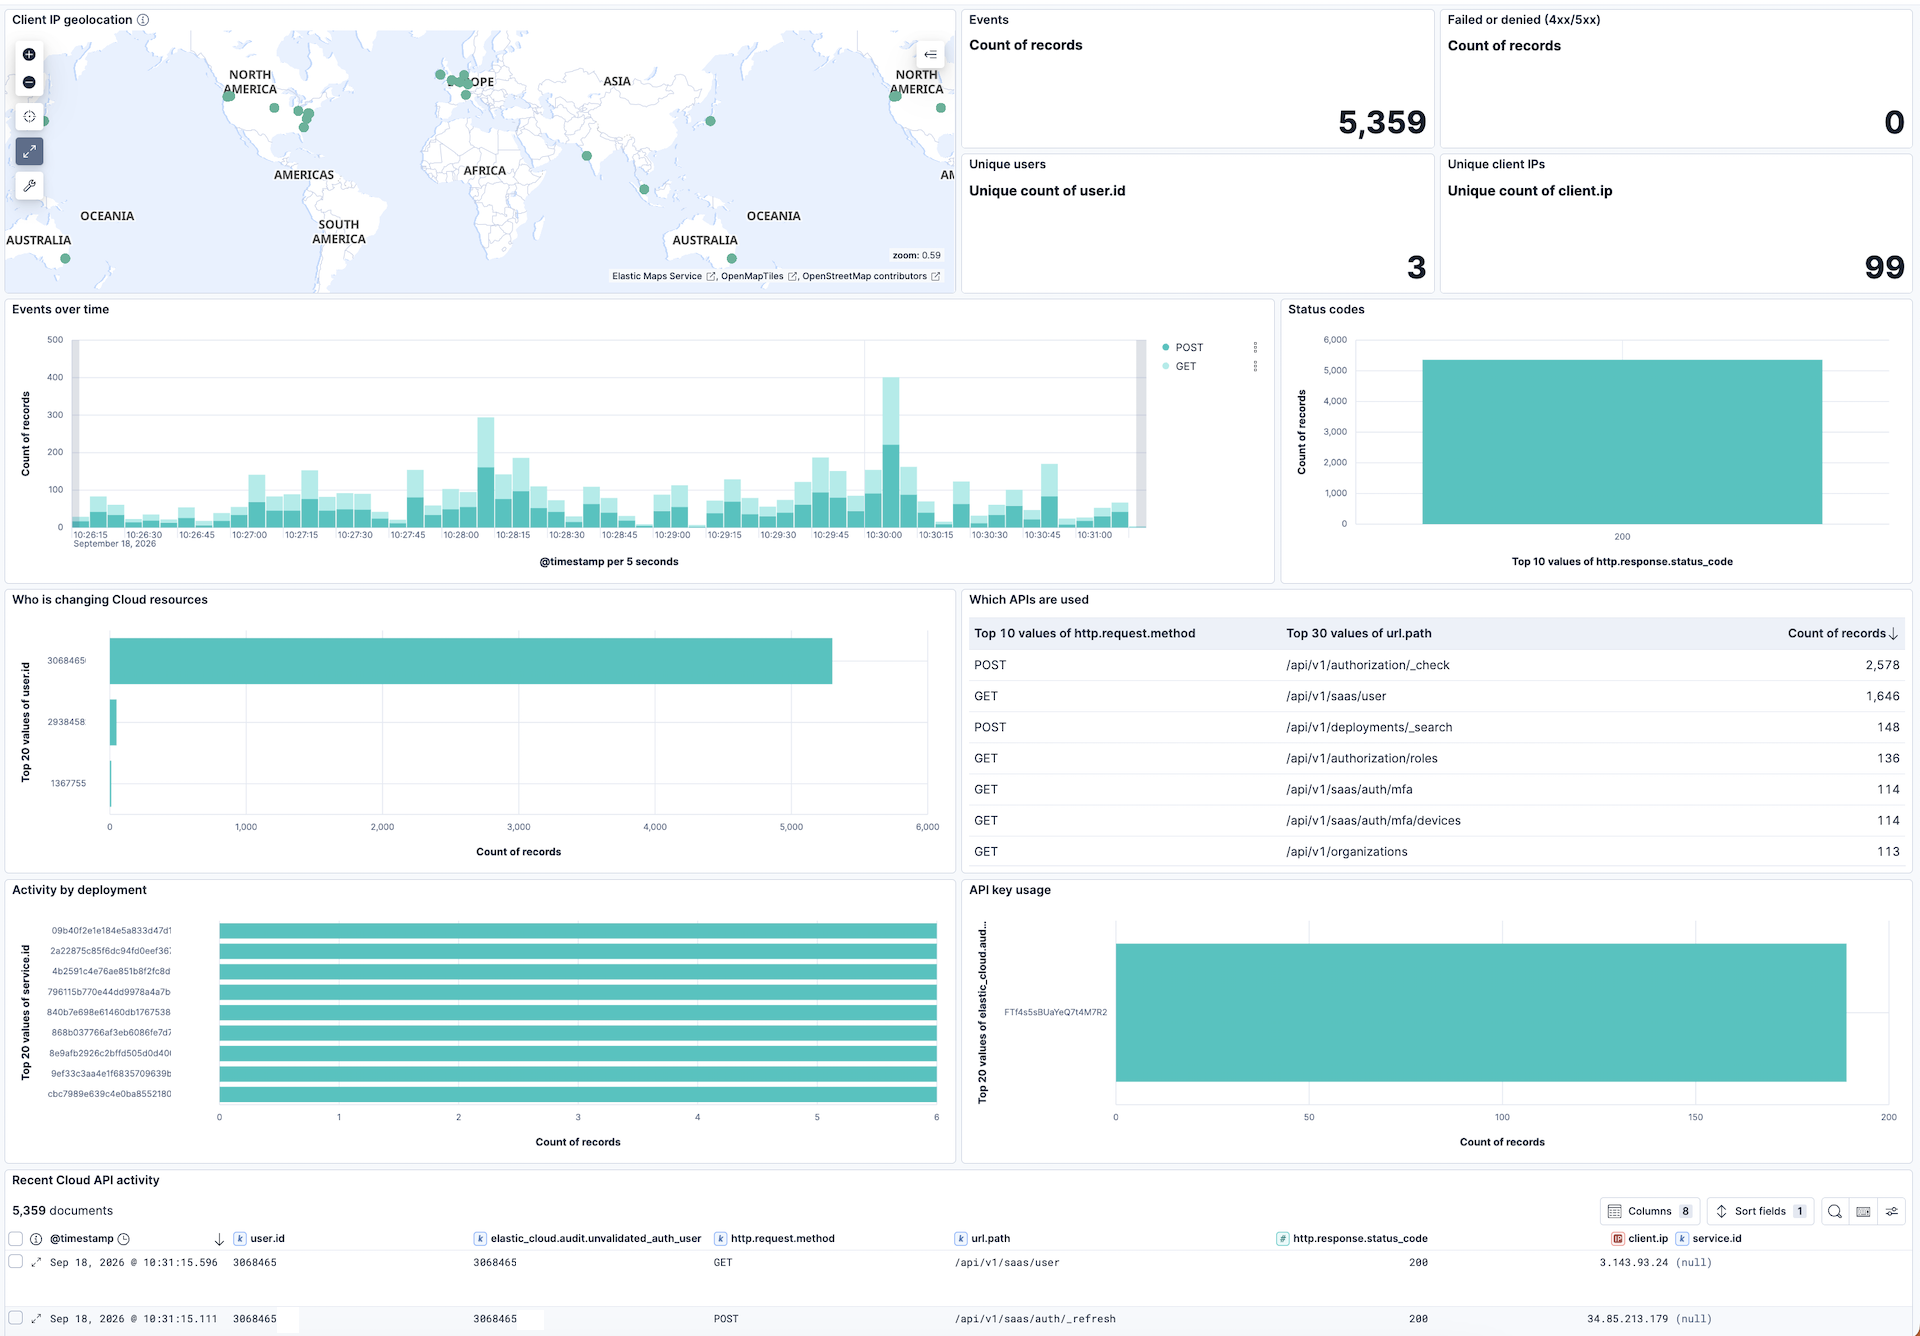
This integration includes one or more Kibana dashboards that visualizes the data collected by the integration. The screenshots below illustrate how the ingested data is displayed.
Changelog
| Version | Details | Minimum Kibana version |
|---|---|---|
| 0.1.0 | Enhancement (View pull request) Initial release of the Elastic GovCloud integration with an assets-only organization audit data stream. |
9.1.0 8.19.0 |