Temporal Cloud OpenTelemetry Assets
| Version | 0.1.0
|
| Subscription level What's this? |
Basic |
| Developed by What's this? |
Elastic |
| Minimum Kibana version(s) | 9.5.0 |
To use pre-release integrations, go to the Integrations page in Kibana, scroll down, and toggle on the Display beta integrations option.
Temporal Cloud is a fully managed Temporal service that provides durable workflow execution, task scheduling, and activity orchestration as a cloud platform. Customer applications connect to Temporal Cloud via gRPC and deploy their own worker processes, which poll Temporal Cloud for tasks and execute workflow and activity code.
This content pack provides dashboards, alert rules, and SLO templates for Temporal Cloud metrics collected via the Temporal integration package.
You need Elasticsearch for storing and searching your data and Kibana for visualizing and managing it. You can use our hosted Elasticsearch Service on Elastic Cloud, which is recommended, or self-manage the Elastic Stack on your own hardware.
Install the Temporal integration package and configure it with your Temporal Cloud credentials. This content pack provides assets that visualize data collected by that integration.
| Dashboard | Description |
|---|---|
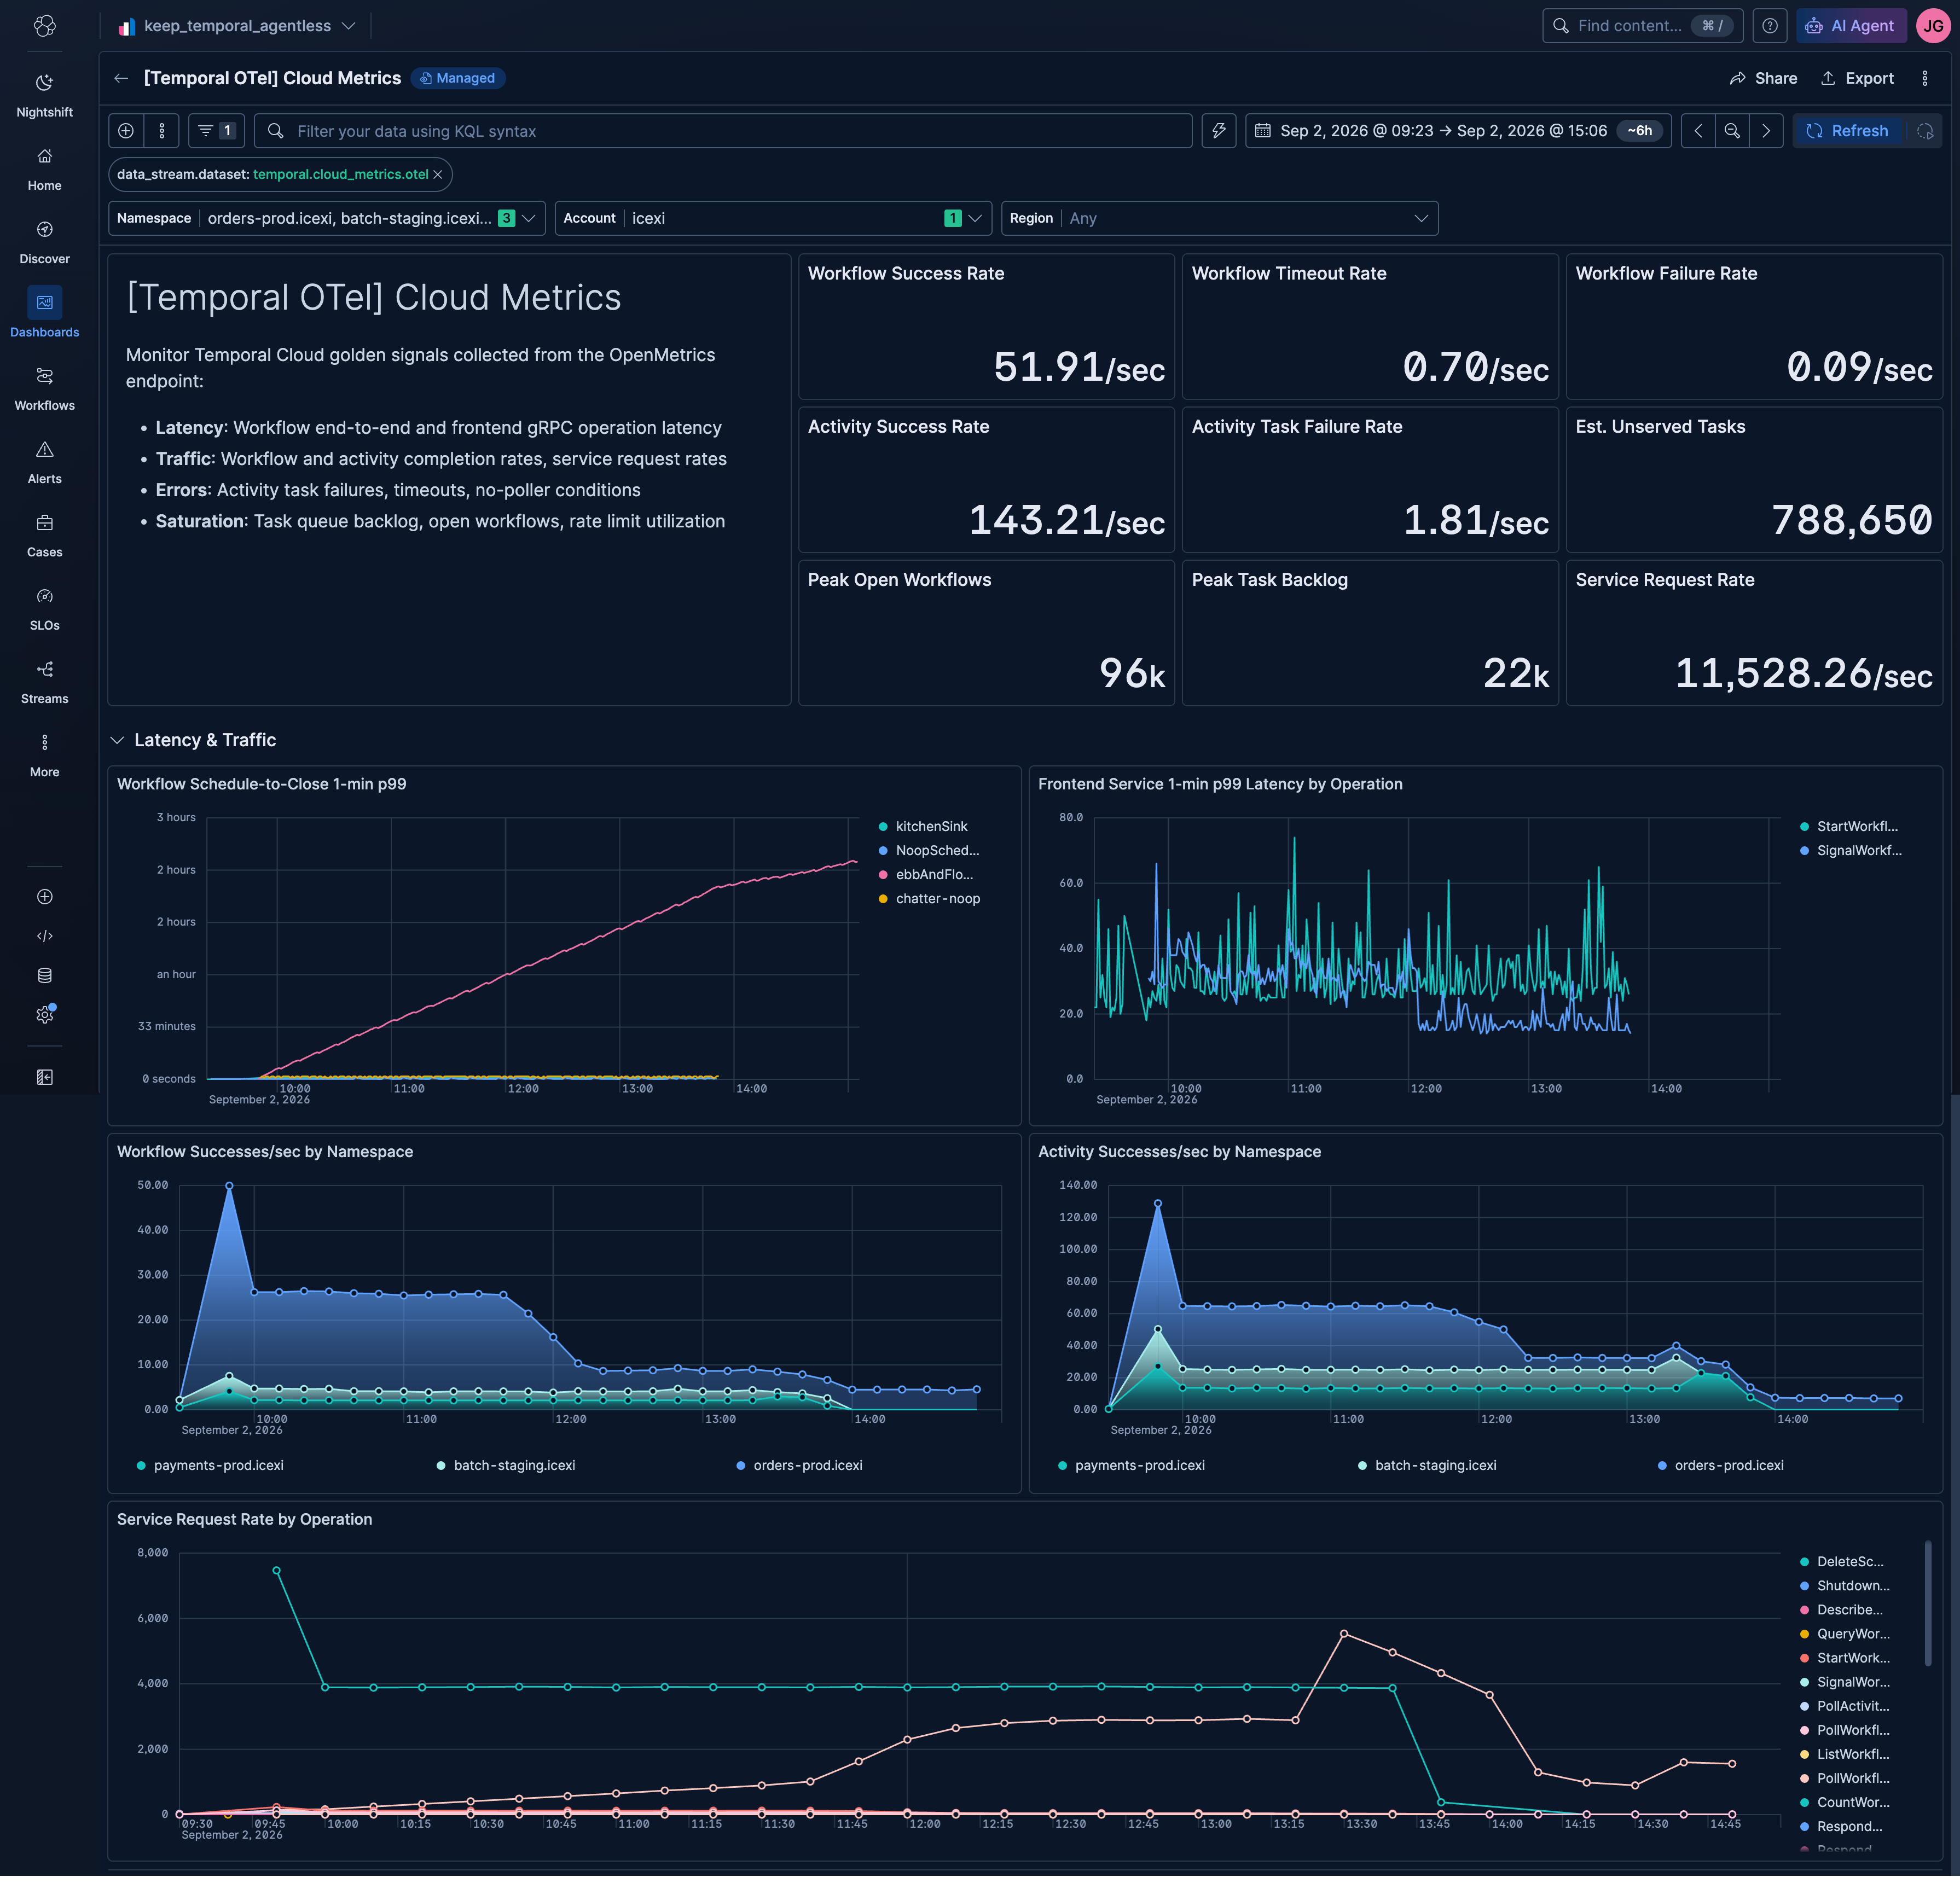
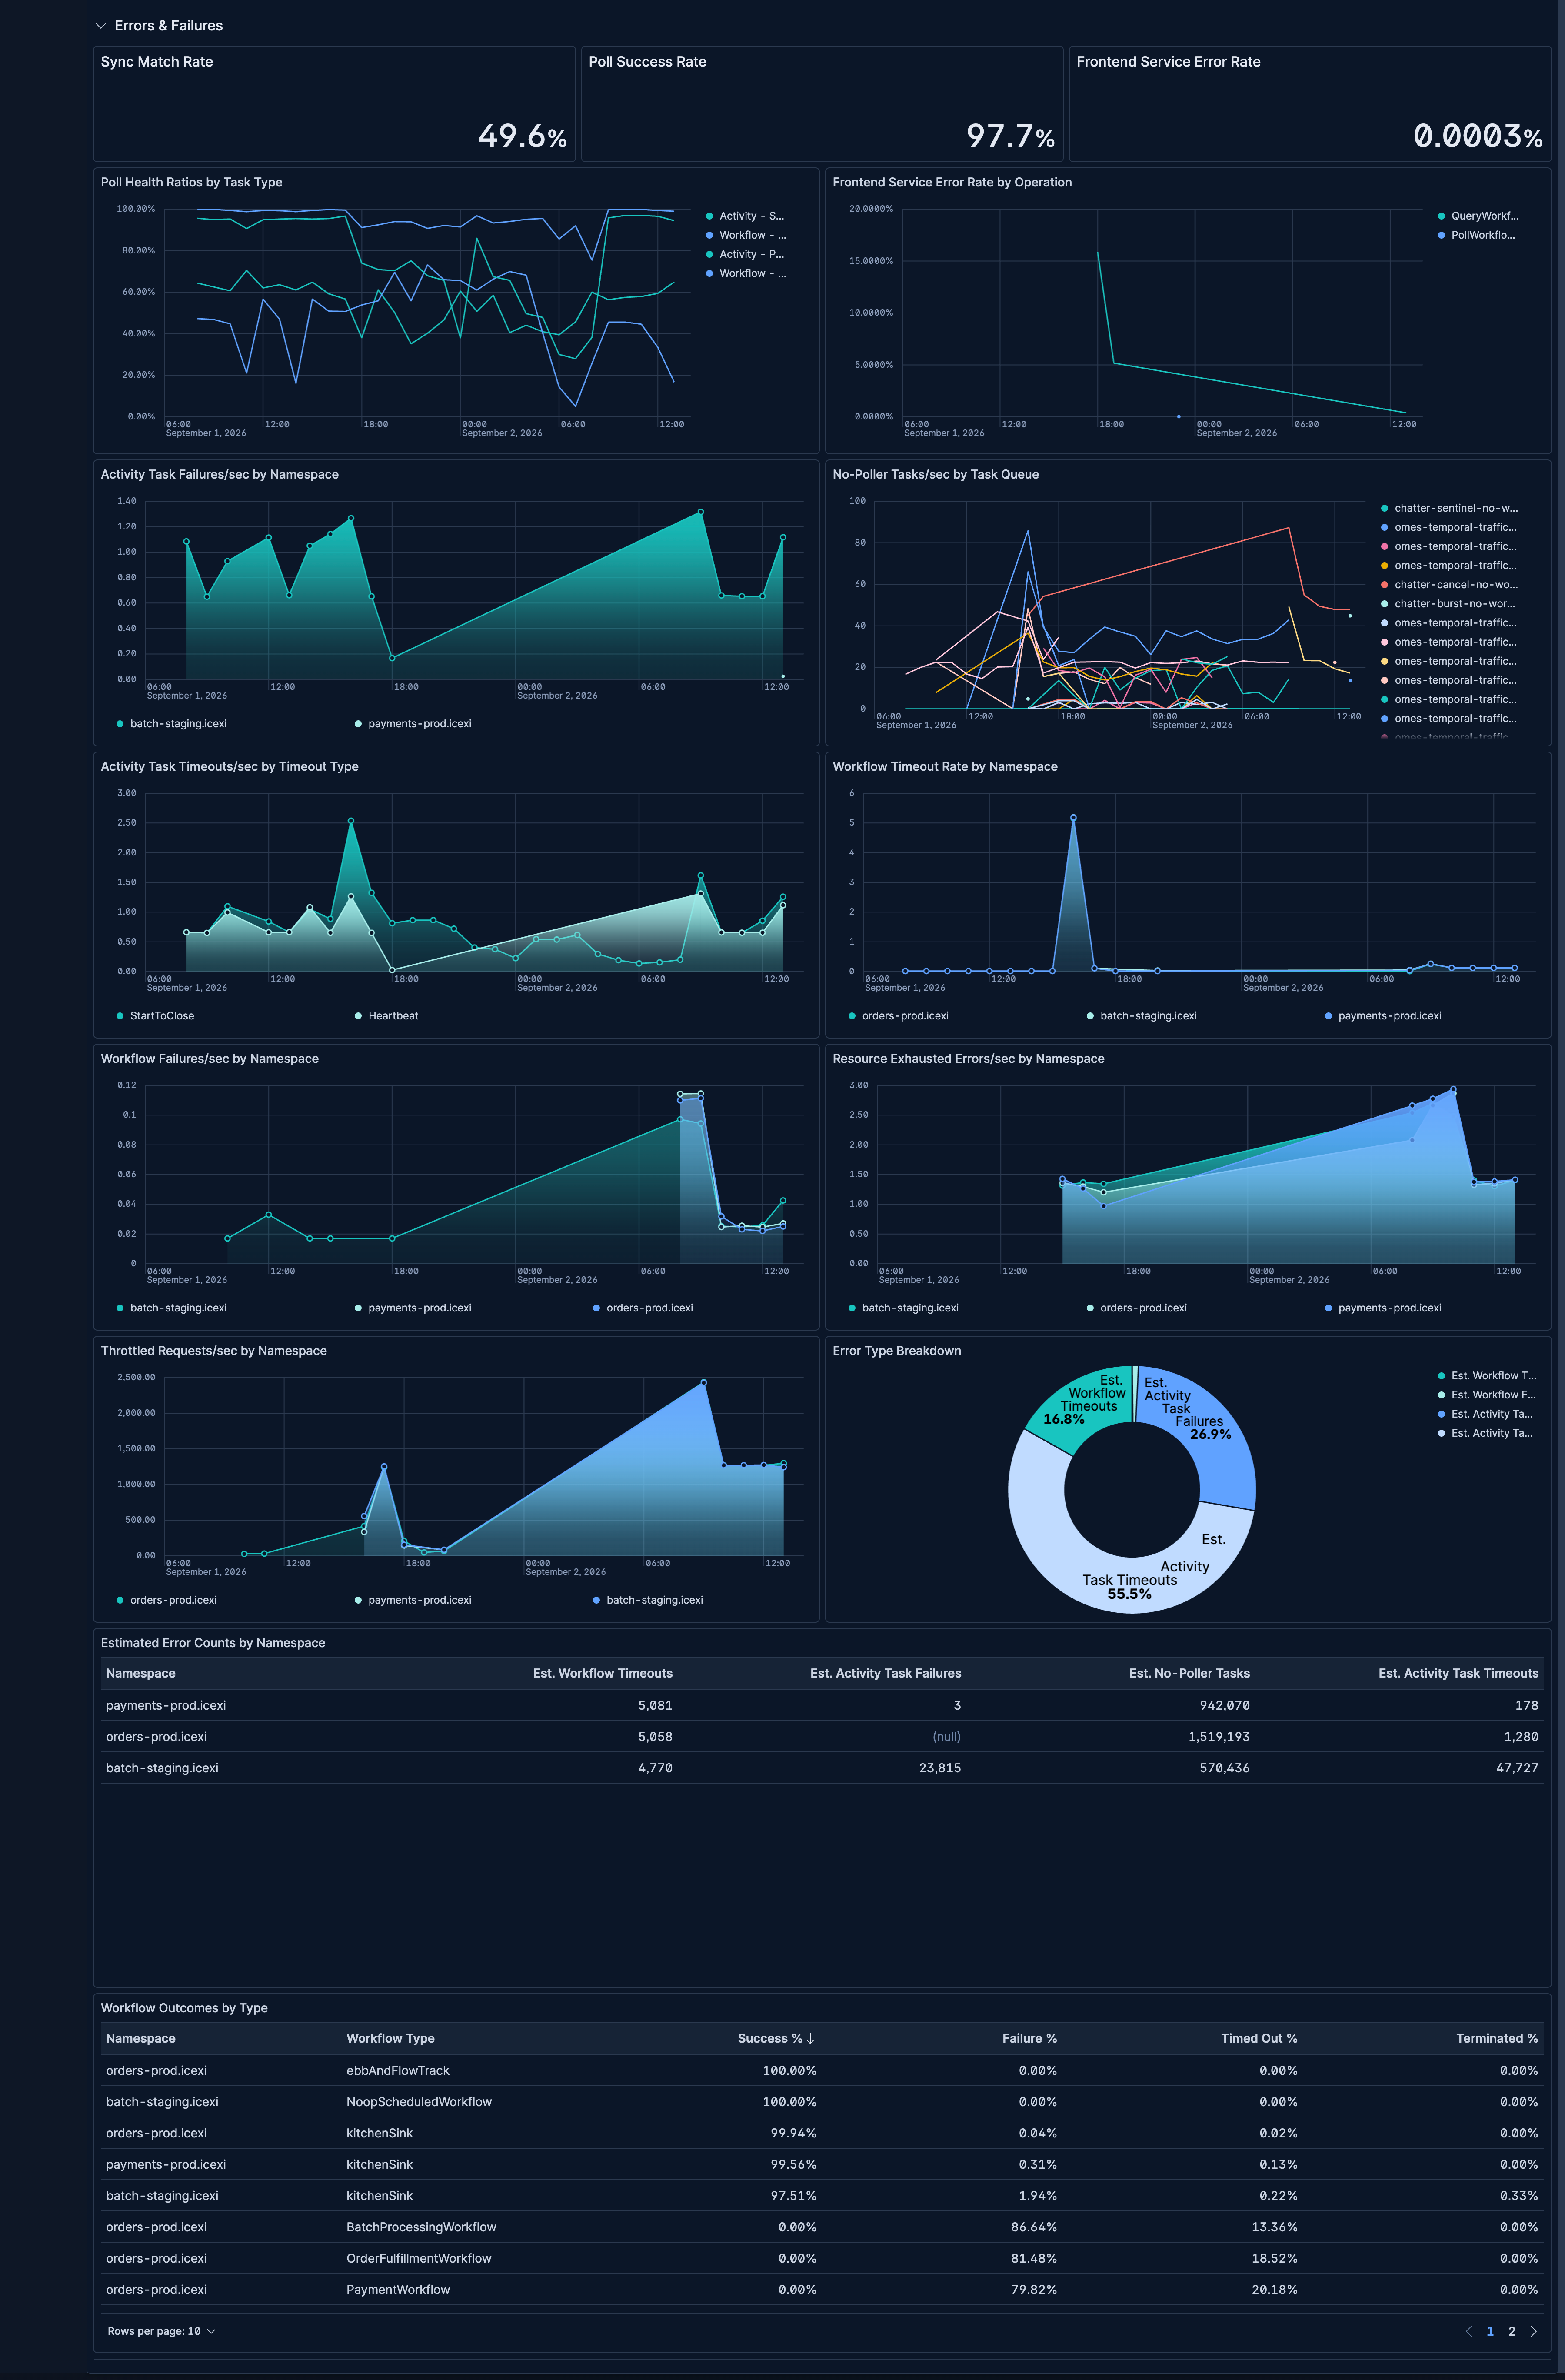
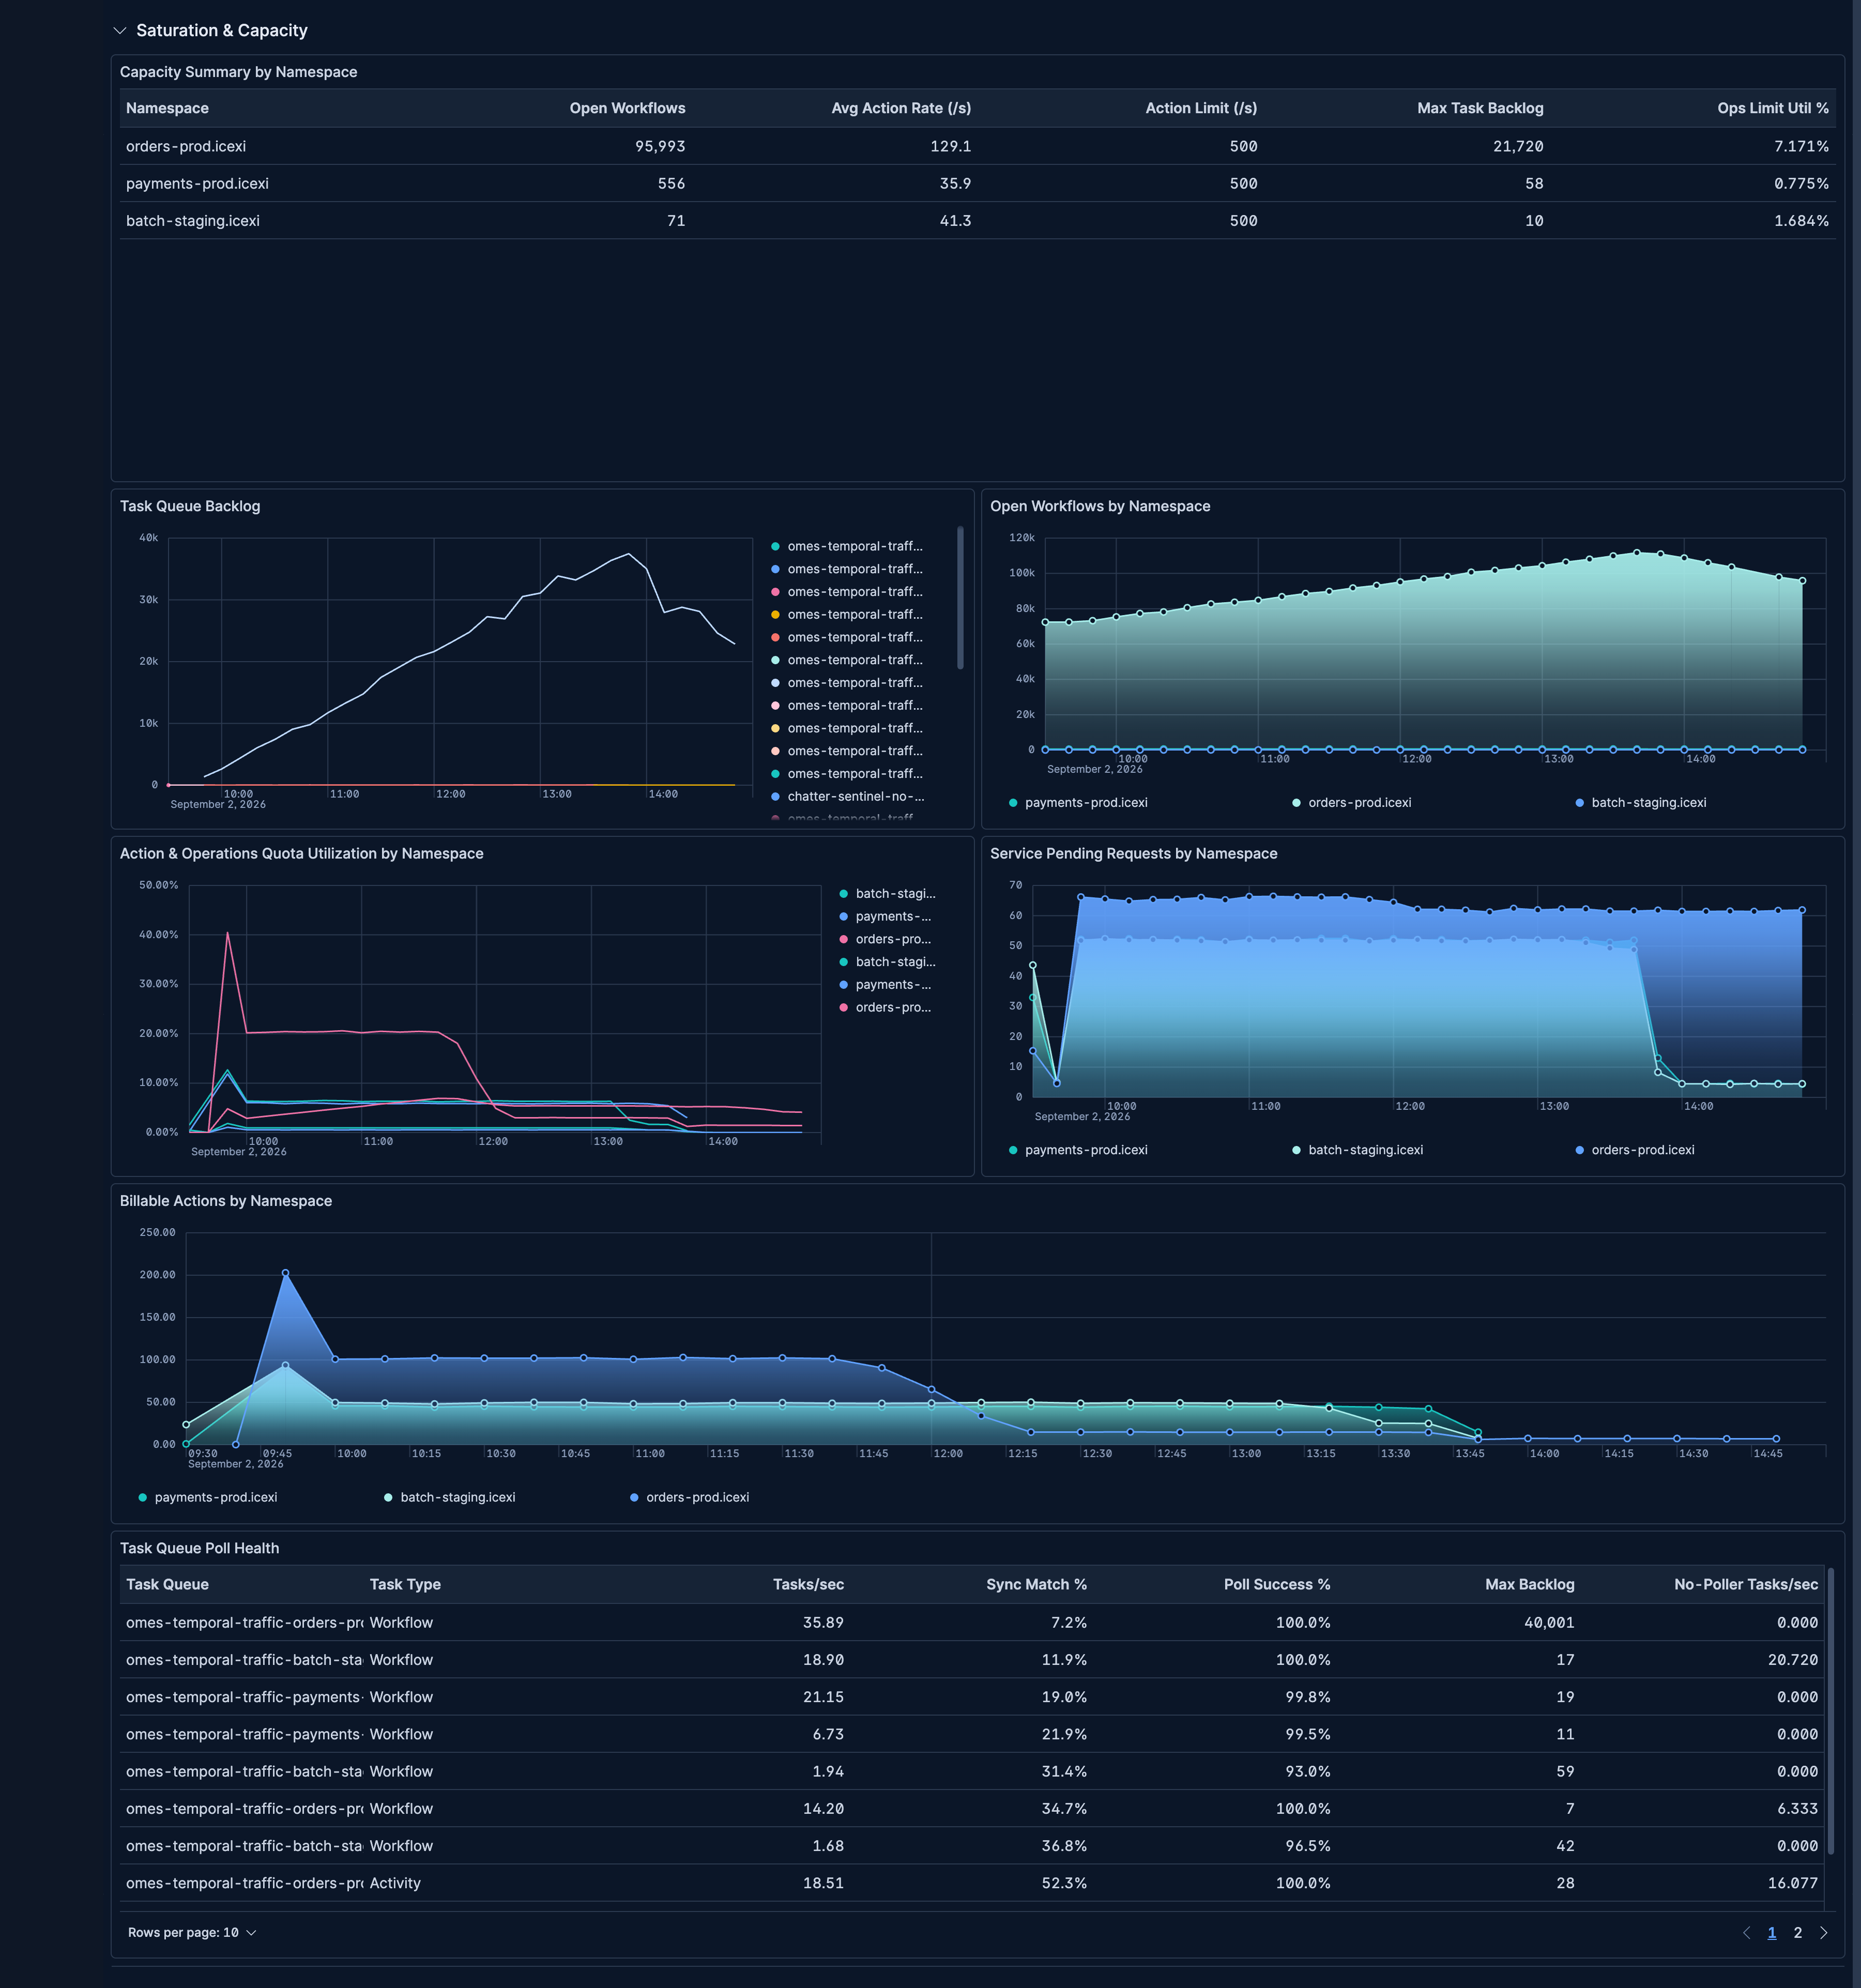
| [Temporal OTel] Cloud Metrics | Golden signals dashboard for Temporal Cloud covering latency, traffic, errors, and saturation — with KPI tiles, per-namespace time series, and capacity summary tables. |
Alert rule templates provide pre-defined configurations for creating alert rules in Kibana.
For more information, refer to the Elastic documentation.
Alert rule templates require Elastic Stack version 9.2.0 or later.
The following alert rule templates are available:
View the alert rule templates
| Name | Description |
|---|---|
| [Temporal OTel] Namespace Approaching Action Rate Limit | Alerts when a namespace's total action consumption approaches 80% of its provisioned action limit. Each workflow event (task dispatch, signal, timer fire, etc.) consumes one action. When the limit is reached, Temporal Cloud throttles new events, causing task queues to back up and workflows to slow down or time out. At 80% utilisation there is insufficient headroom to absorb traffic spikes. |
| [Temporal OTel] Activity Task Timeout Rate Elevated | Alerts when activity task timeouts are elevated, broken down by timeout_type. StartToClose timeouts indicate workers are exceeding their per-attempt execution time limit (slow external calls or overloaded workers). Heartbeat timeouts indicate workers stopped reporting progress mid-execution — the worker process likely crashed or hung. Both types may be retried, but persistent rates signal systemic problems. |
| [Temporal OTel] High Activity Task Failure Rate | Alerts when the activity task failure rate exceeds 10% of completions for a task queue. Activity task failures (individual attempt failures, may be retried) are the primary available failure signal and indicate degraded external dependencies, worker instability, or incorrect activity implementation. Sustained high rates exhaust retry budgets and lead to workflow failures. |
| [Temporal OTel] No Pollers on Task Queue | Alerts when tasks are being dispatched to a task queue that has zero active workers (pollers). no_poller_tasks_count > 0 means tasks are arriving but no worker is listening — all new work for that queue is immediately stuck. This is the most critical worker health signal: the worker fleet for this queue is effectively absent. |
| [Temporal OTel] Namespace Open Workflow Count Anomaly | Alerts when the number of open (in-flight) workflow executions in a namespace exceeds a high threshold, indicating potential workflow accumulation. Sustained growth in open workflows without proportional throughput growth suggests workflows are not completing — either stuck waiting on tasks, blocked by failed activities, or running indefinitely due to a bug. This is a namespace-level saturation signal. |
| [Temporal OTel] Task Queue Backlog Growing | Alerts when the task queue backlog exceeds 500 pending tasks for any task queue. A growing backlog indicates that tasks are arriving faster than workers can process them — the primary capacity signal for worker health. Left unchecked, backlogs cause workflow timeouts as workflows wait longer than their execution timeout for their tasks to be scheduled. |
| [Temporal OTel] Workflow Timeout Rate Elevated | Alerts when workflow executions are timing out — i.e., running past their workflowExecutionTimeout without completing. Workflow timeouts are distinct from failures: the workflow ran out of wall-clock time, not out of retries. Sustained timeouts indicate blocked workers, backlogged task queues, or timeout values set too aggressively for the actual workload. |
SLO templates provide pre-defined configurations for creating SLOs in Kibana.
For more information, refer to the Elastic documentation.
SLO templates require Elastic Stack version 9.4.0 or later.
The following SLO templates are available:
View the SLO templates
| Name | Description |
|---|---|
| [Temporal OTel] Service latency p99 below 100ms 99% rolling 30 days | Measures whether the 99th-percentile gRPC frontend latency of the Temporal Cloud service stays below 100 milliseconds (0.1 seconds) within each 1-minute evaluation window. The Temporal Cloud frontend is the single API entry-point for all client operations including starting workflows, signalling executions, and polling for tasks — latency spikes here propagate directly to workflow orchestration responsiveness. Breaching this SLO warrants investigation of Temporal Cloud service health or upstream capacity limits. Target: 99% of 1-minute timeslices report healthy p99 latency, grouped by namespace and operation to isolate which API methods are affected. |
| [Temporal OTel] Task queue backlog below threshold 99% rolling 30 days | Tracks whether the approximate number of pending tasks in each task queue stays below 1000 tasks per 5-minute evaluation window. A growing backlog means tasks are arriving faster than worker processes can claim and execute them — this directly causes workflow and activity execution delays. Sustained backlog growth often indicates a worker outage, under-provisioned worker fleet, or a sudden traffic spike. Target: 99% of 5-minute timeslices show a healthy backlog across each namespace and task queue combination over a rolling 30-day window. |
| [Temporal OTel] Workflow success rate 99.5% rolling 30 days | Measures the fraction of 1-minute timeslices in which the workflow success rate — successful completions divided by all terminal outcomes (success, failure, and timeout) — exceeds 95%. A breach indicates that a meaningful portion of durable workflow executions are failing or timing out, which directly impairs business processes that rely on Temporal for orchestration. Target: 99.5% of timeslices are healthy over a rolling 30-day window, grouped by namespace to surface per-tenant degradation. |
This integration includes one or more Kibana dashboards that visualizes the data collected by the integration. The screenshots below illustrate how the ingested data is displayed.
Changelog
| Version | Details | Minimum Kibana version |
|---|---|---|
| 0.1.0 | Enhancement (View pull request) Initial release of the Temporal OpenTelemetry content package. |
9.5.0 |