AWS RDS Metrics OpenTelemetry Assets
| Version | 0.12.0
|
| Subscription level What's this? |
Basic |
| Developed by What's this? |
Elastic |
| Minimum Kibana version(s) | 9.5.0 |
To use pre-release integrations, go to the Integrations page in Kibana, scroll down, and toggle on the Display beta integrations option.
This package contains Kibana assets for monitoring RDS database instances with AWS CloudWatch metrics collected by the OpenTelemetry Collector.
The package is content only. It provides a curated metrics dashboard, but it does not configure data collection. Use the AWS CloudWatch OpenTelemetry Input Package (aws_cloudwatch_input_otel) to configure the OpenTelemetry Collector CloudWatch receiver and collect the required AWS service metrics into Elasticsearch.
- CloudWatch metrics collected by the OpenTelemetry Collector AWS CloudWatch receiver.
- Documents indexed into the
metrics-aws.rds.otel-*data stream. - The relevant AWS dimensions for this service, such as resource name, region, and service-specific identifiers.
Requires Kibana ^9.5.0.
This package includes one pre-built Kibana dashboard:
| Name | Description |
|---|---|
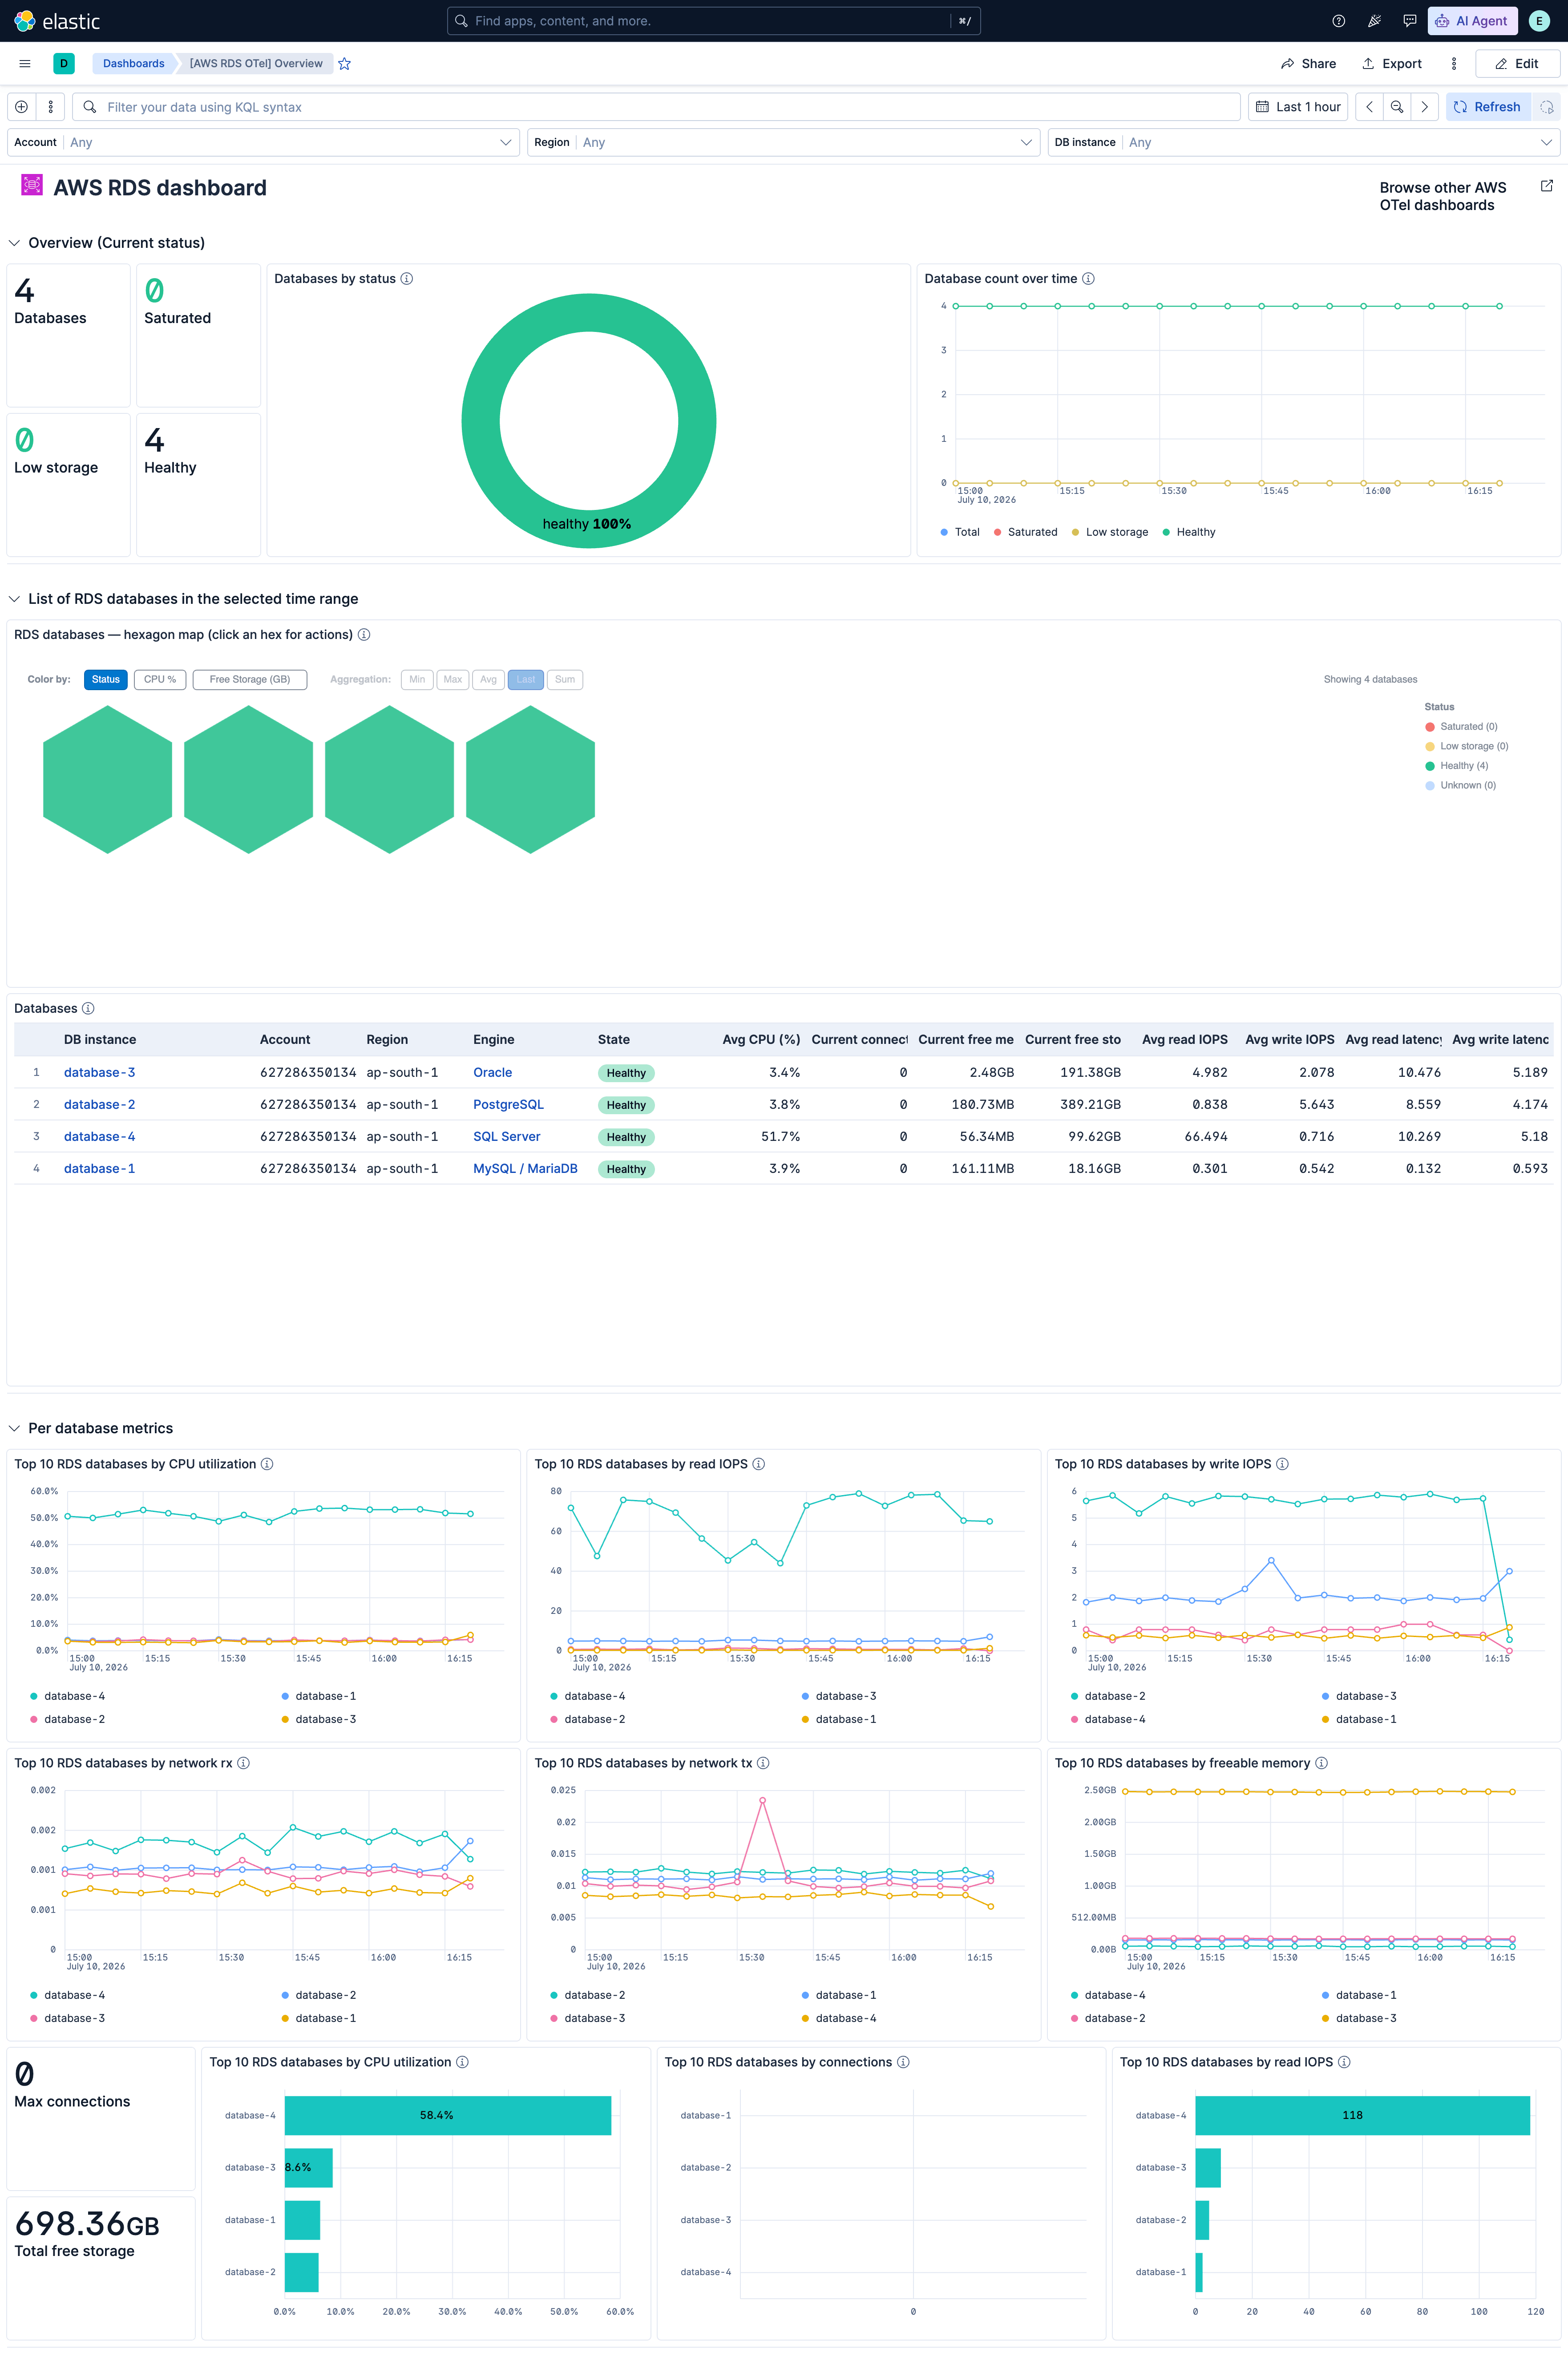
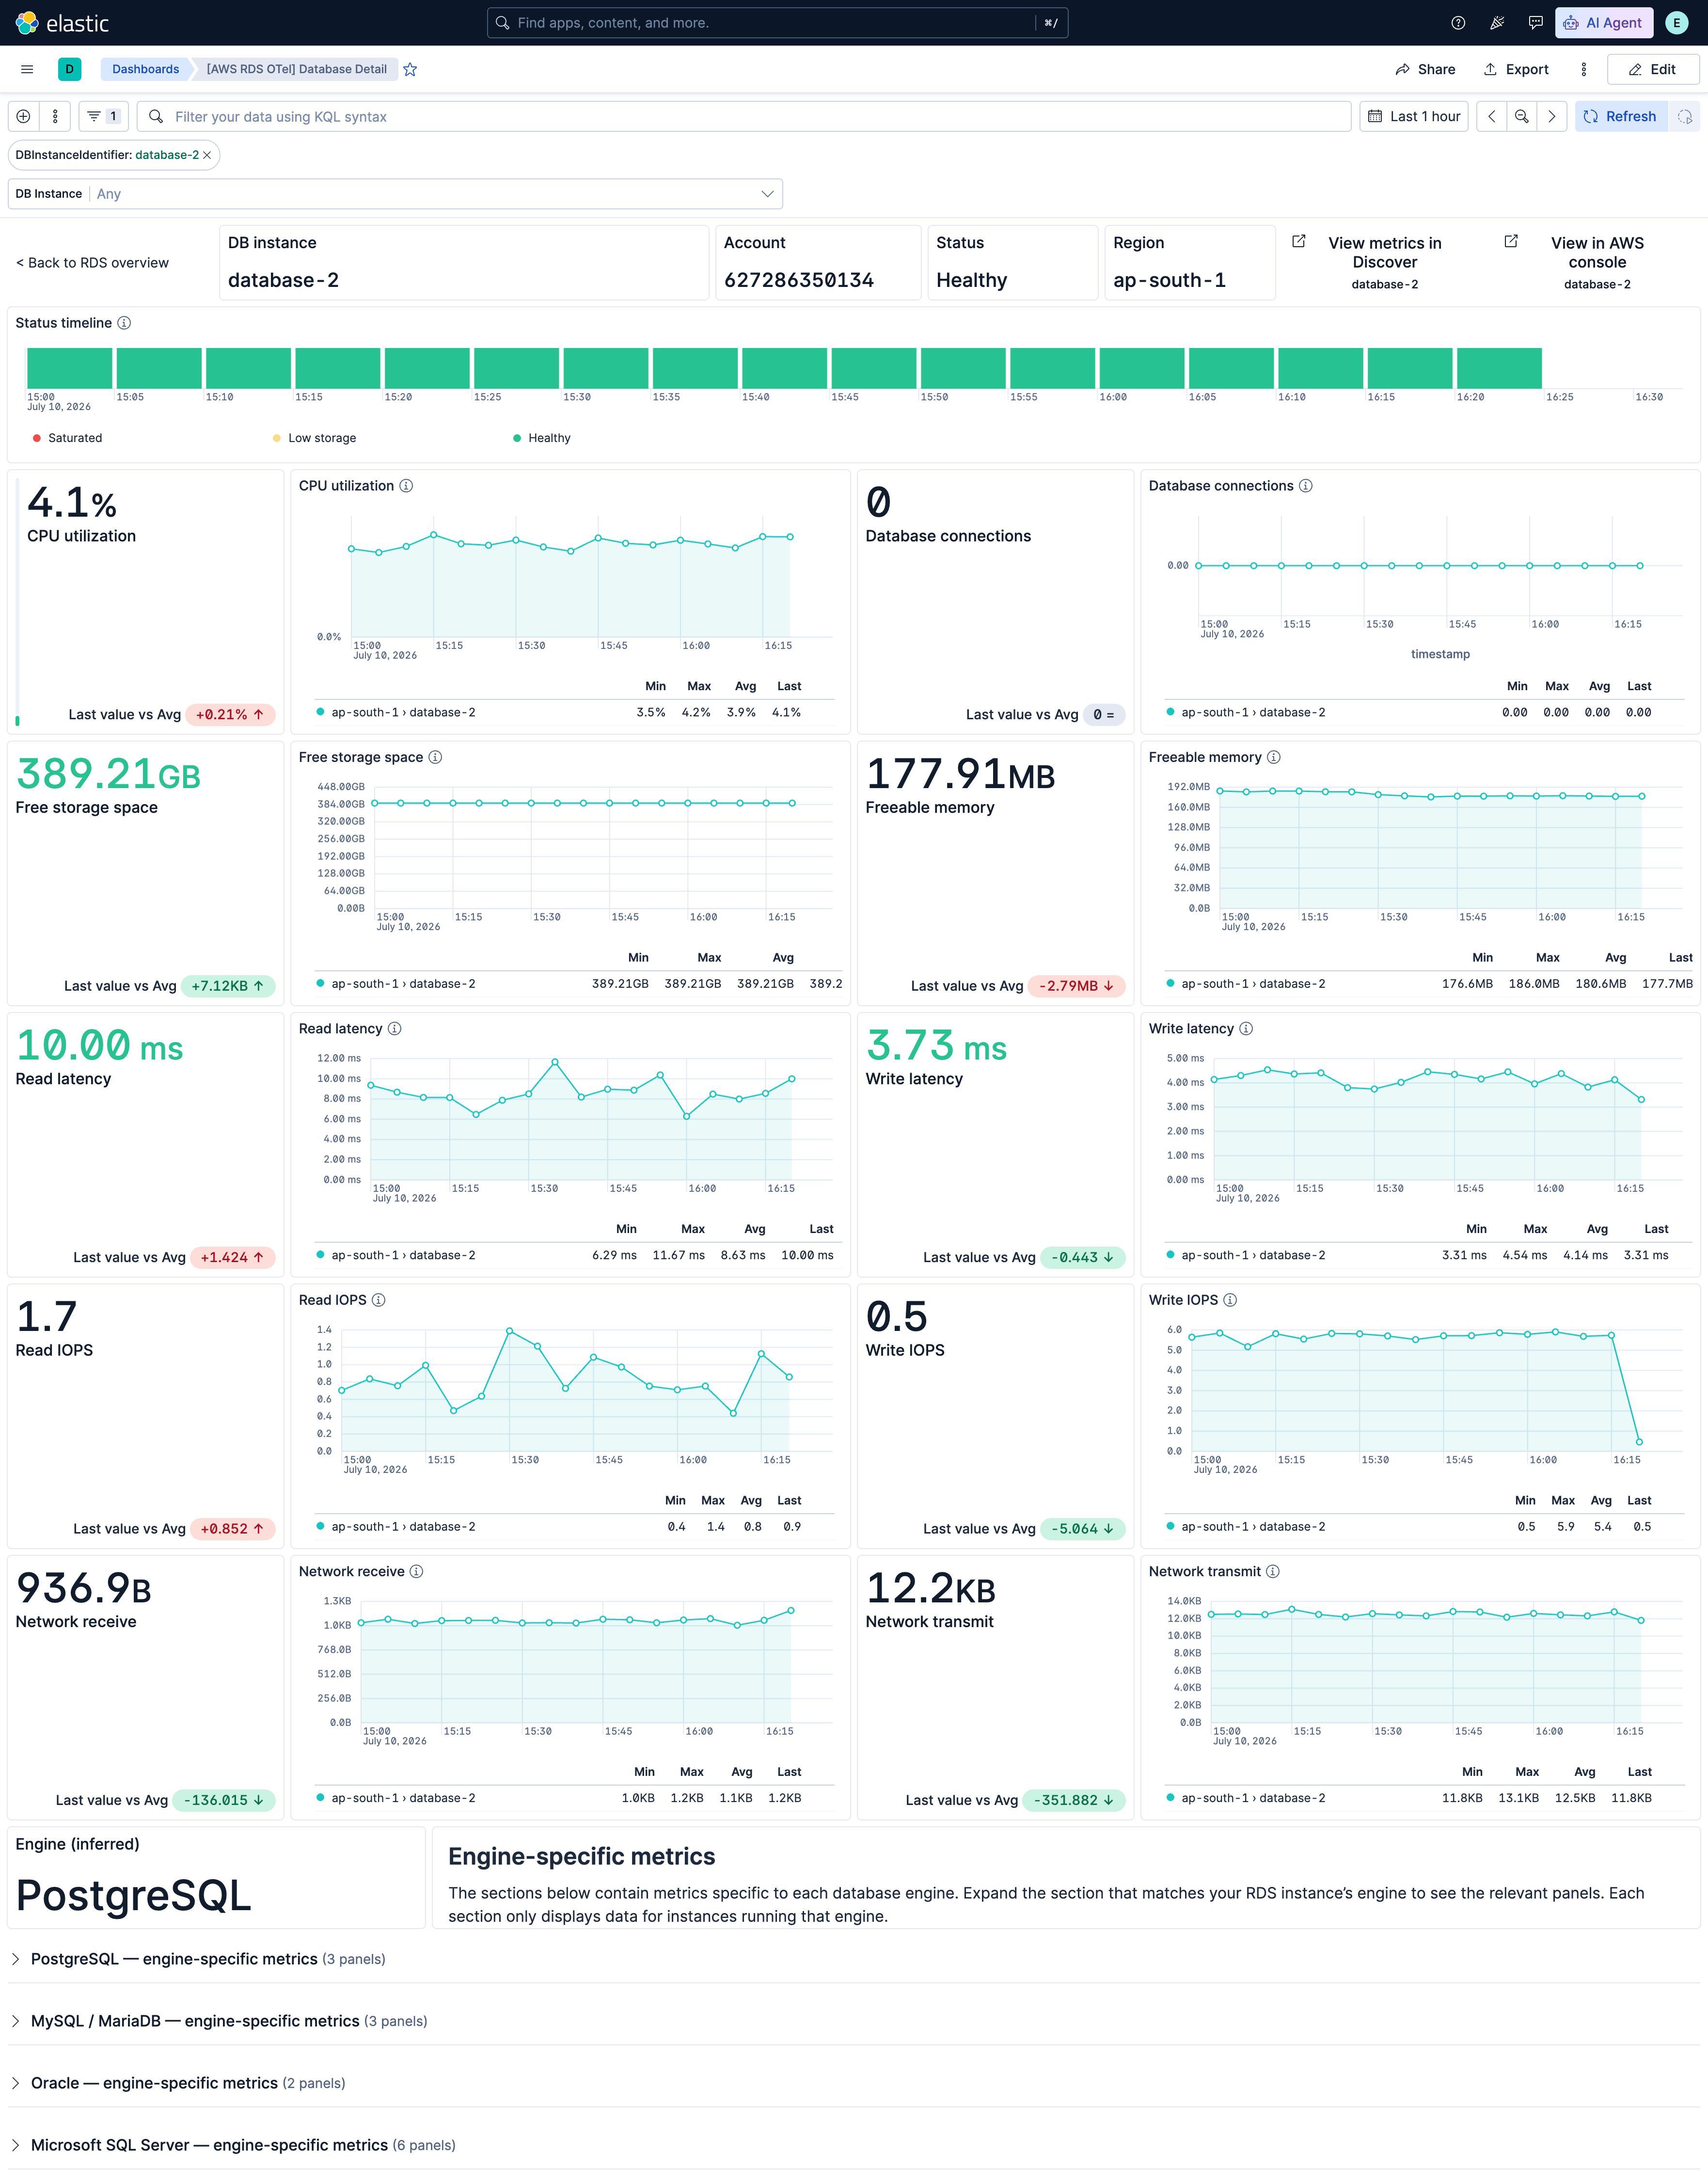
| [AWS RDS OTel] Metrics | AWS RDS dashboard for CloudWatch metrics collected by the OpenTelemetry Collector. |
Alert rule templates provide pre-defined configurations for creating alert rules in Kibana.
For more information, refer to the Elastic documentation.
Alert rule templates require Elastic Stack version 9.2.0 or later.
The following alert rule templates are available:
View the alert rule templates
| Name | Description |
|---|---|
| [AWS RDS OTel] Burst balance low | Alerts when gp2 burst balance falls below a percentage floor. Depleted burst credits throttle IOPS and typically precede disk queue depth and latency spikes. |
| [AWS RDS OTel] Checkpoint lag high | Alerts when checkpoint lag exceeds a threshold. Uses the Maximum statistic for worst-case lag. Rising checkpoint lag indicates the instance cannot keep up with write/redo volume. |
| [AWS RDS OTel] CPU utilization high | Alerts when average CPU utilization is sustained above a threshold. Latency rises sharply above ~80% CPU; correlate with SwapUsage for memory-related CPU pressure. |
| [AWS RDS OTel] Database connections high | Alerts when average database connections exceed a threshold. Uses the Average statistic per AWS recommended alarms. CloudWatch does not publish max_connections — set the threshold against your engine limit and normal baseline. |
| [AWS RDS OTel] Disk queue depth high | Alerts when average disk queue depth is sustained above a threshold. High queue depth with plateauing IOPS is the canonical storage I/O saturation signature. |
| [AWS RDS OTel] Free storage space low | Alerts when free storage space on an RDS instance falls below an absolute byte floor. Storage exhaustion is an outage-class risk; total volume size is not published by CloudWatch so percentage thresholds cannot be derived from this source. |
| [AWS RDS OTel] Freeable memory low | Alerts when freeable memory on an RDS instance falls below an absolute byte floor. Persistent low memory leads to swapping and latency; correlate with DatabaseConnections and SwapUsage. |
| [AWS RDS OTel] Read latency high | Alerts when peak read I/O latency exceeds a threshold. Uses the Maximum statistic for worst-case tail latency. Correlate with DiskQueueDepth and ReadIOPS for storage bottlenecks. |
| [AWS RDS OTel] Replica lag high | Alerts when read replica lag exceeds a threshold. Uses the Maximum statistic for worst-case lag. Rising lag means stale read traffic and failover targets behind the primary. |
| [AWS RDS OTel] Swap usage high | Alerts when swap usage exceeds an absolute byte threshold. Non-zero or rising swap indicates memory pressure spilling to disk and degrading performance. |
| [AWS RDS OTel] Write latency high | Alerts when peak write I/O latency exceeds a threshold. Uses the Maximum statistic for worst-case tail latency. Correlate with DiskQueueDepth and WriteIOPS for storage bottlenecks. |
SLO templates provide pre-defined configurations for creating SLOs in Kibana.
For more information, refer to the Elastic documentation.
SLO templates require Elastic Stack version 9.4.0 or later.
The following SLO templates are available:
View the SLO templates
| Name | Description |
|---|---|
| [AWS RDS OTel] Average read latency 99.5% rolling 30 days | Tracks per-I/O read storage latency from CloudWatch RDS metrics. At least 99.5% of 1-minute intervals per DB instance should show average read latency below 10 milliseconds, protecting read-heavy application workloads from storage bottlenecks. |
This integration includes one or more Kibana dashboards that visualizes the data collected by the integration. The screenshots below illustrate how the ingested data is displayed.
Changelog
| Version | Details | Minimum Kibana version |
|---|---|---|
| 0.12.0 | Bug fix (View pull request) Replace the deprecated popout icon with external so dashboard navigation cards render correctly. |
9.5.0 |
| 0.11.1 | Bug fix (View pull request) Fix single metric panels breaking when no data is available |
9.5.0 |
| 0.11.0 | Enhancement (View pull request) Add ML anomaly detection module for RDS instance resource metrics (connections, CPU, latency, memory, disk queue). Enhancement (View pull request) Add ml_module to the Kibana asset tags. |
9.5.0 |
| 0.10.1 | Bug fix (View pull request) Fix Databases by status, Database count over time, and Databases table panels breaking when no data is available |
9.5.0 |
| 0.10.0 | Enhancement (View pull request) Add drill-down dashboards |
9.5.0 |
| 0.9.0 | Enhancement (View pull request) Add tags to Kibana assets |
9.5.0 |
| 0.8.1 | Enhancement (View pull request) Rename the dashboard to "[AWS RDS OTel] Metrics". |
9.5.0 |
| 0.8.0 | Enhancement (View pull request) Remove the idle status and map "no data" to "Unknown" across RDS dashboard panels. |
9.5.0 |
| 0.7.0 | Enhancement (View pull request) Improve ESQL queries in dashboards |
9.5.0 |
| 0.6.0 | Enhancement (View pull request) Add _dev/build/docs/README.md |
9.5.0 |
| 0.5.0 | Enhancement (View pull request) Improve dashboard queries and visualizations |
9.5.0 |
| 0.4.0 | Enhancement (View pull request) Update aggregation function for database-connections-high alert. |
9.5.0 |
| 0.3.0 | Enhancement (View pull request) Add alert rules and SLOs to README |
9.5.0 |
| 0.2.1 | Enhancement (View pull request) Standardize the package title and description to the AWS <service> <signal> OpenTelemetry Assets naming convention. |
9.5.0 |
| 0.2.0 | Enhancement (View pull request) Create new SLO and Alert assets |
9.5.0 |
| 0.1.0 | Enhancement (View pull request) Initial AWS RDS OpenTelemetry metrics dashboard package |
9.5.0 |