Create rules from integration alerting templates
Alerting rule templates are out-of-the-box alert definitions that come bundled with Elastic integrations, enabling users to quickly set up monitoring without writing queries from scratch. Not all integrations include alerting templates.
Templates help you start monitoring in minutes by providing curated ES|QL queries and recommended thresholds tailored to each integration.
After the integration is installed, these templates are automatically available in Kibana's alerting interface with a prefilled rule creation form that you can adapt to your needs.
Although these templates are managed by Elastic, the customer owns any alert created from them and won't be modified, even if the templates change.
Although the alerts can be used as provided, threshold values should always be evaluated in the context of your specific environment. Depending on how you adjust the thresholds, you might either generate too many alerts or fail to generate alerts when expected.
- Ensure the data collection is enabled for the metrics or events that you plan to use.
- Appropriate Kibana role privileges to create and manage rules.
Alerting rule templates come with recommended, pre-populated values. Templates are available from the integration page or the Rules page (open from the navigation menu or by using the global search field).
From an integration:
In Kibana, go to Data management > Integrations or search for Integrations using the global search field).
Find and open the integration.
On the integration page, select the Alerting tab to view all available alerting rule templates for that integration.
NoteThe Alerting tab is available for all integrations starting in version 9.4.0. In earlier versions, alerting rule templates are located in the Assets tab. 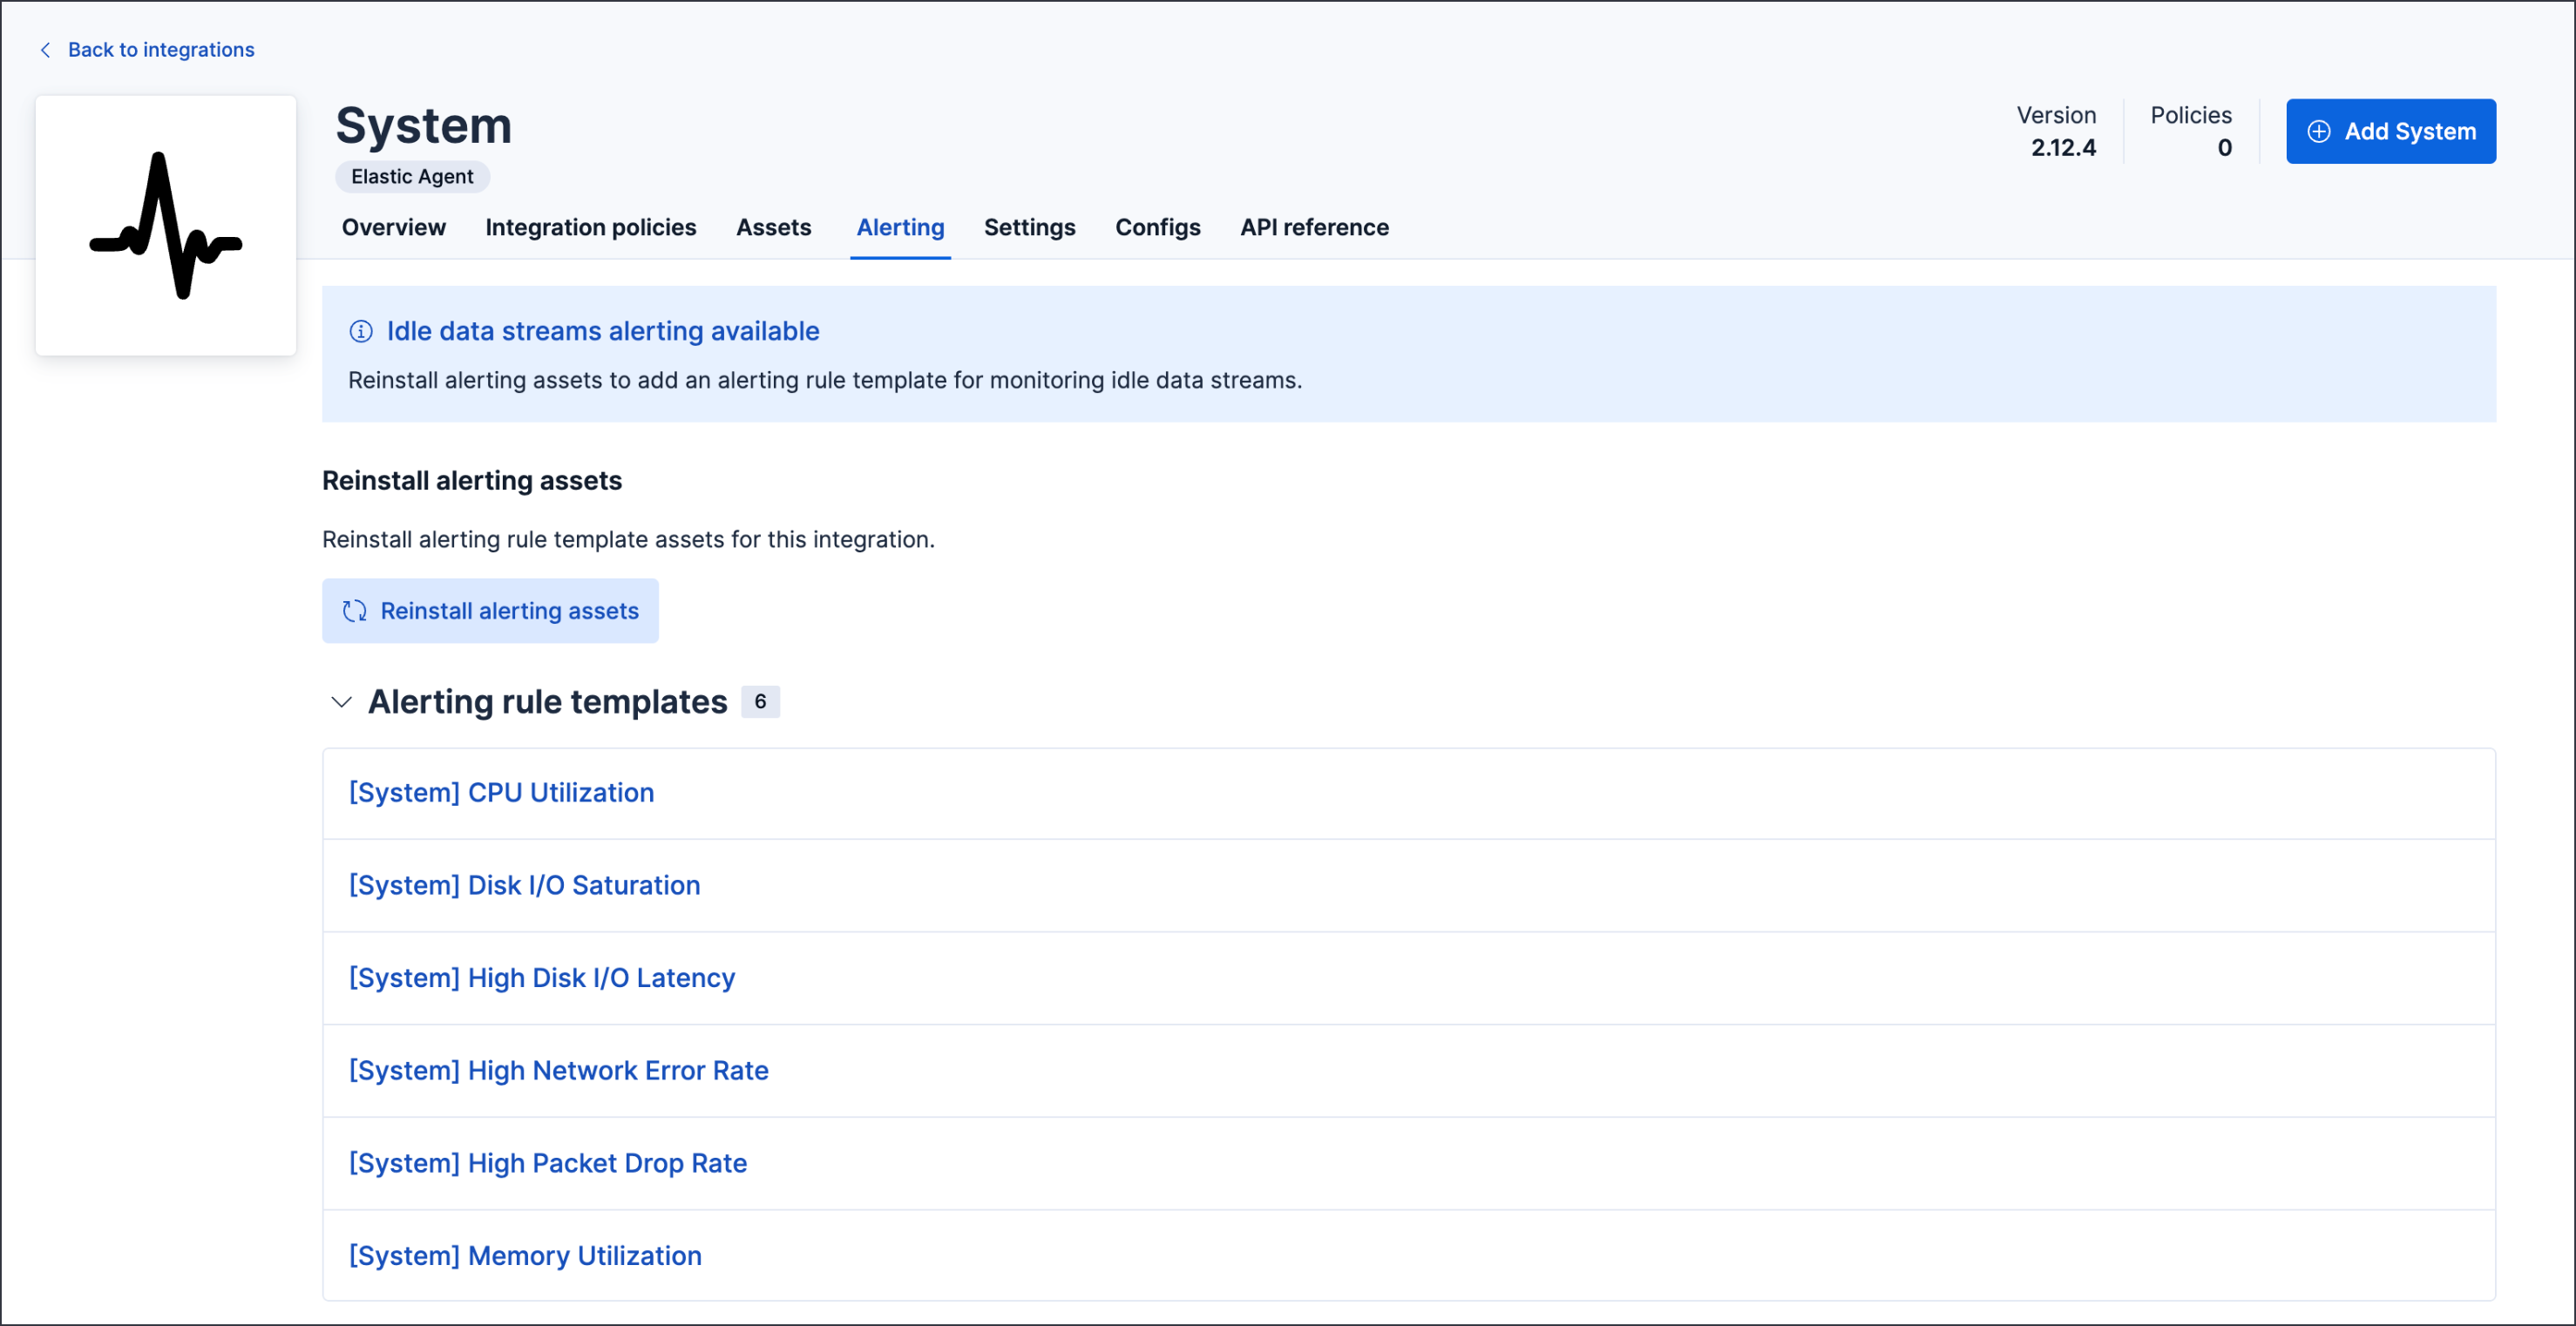
Select a template to open a prefilled Create rule form.
You can use the template to create your own custom alerting rule by adjusting values, setting up connectors, and defining rule actions.
Review and (optionally) customize the pre-filled settings, then save and enable the rule.
The rule created from the template is listed on the Rules page. Go to Management, then in the Alerts and insights section, click Rules. Alternatively, you can access rules from solution-specific pages such as Observability → Alerts → Manage Rules.
To update a rule you created from a template, go to the Rules page, open the action menu for the rule, and select Edit rule.
From the Rules:
- In Kibana, go to Data management > Rules or search for Rules using the global search field).
- Click Create rule, then select the Template tab.
- Choose a template from the list, review the pre-filled settings, and click Create rule to save and enable it. .
The preconfigured defaults include:
-
- ES|QL query
- A curated, text-based query that evaluates your data and creates alerts when matches are found during the latest run.
-
- Recommended threshold
- A suggested threshold embedded in the ES|QL
WHEREclause. You can tune the threshold to fit your environment.
-
- Time window (look-back)
- The length of time the rule analyzes for data (for example, the last 5 minutes).
-
- Rule schedule
- How frequently the rule checks alert conditions (for example, every minute).
-
- Alert delay
- The number of consecutive runs for which conditions must be met before an alert is created.
For details about fields in the Create rule form and how the rule evaluates data, refer to the Elasticsearch query rule type.
All integrations include a dynamically generated Idle data streams template. This template generates an alert if no data is written to any of the integration's data stream patterns within a specified time period (the default is 24 hours). Note that Idle data streams are not generated for input-only packages.
Use this template to detect data collection issues early, such as:
- An agent or data source going offline
- Network connectivity problems preventing data ingestion
- Configuration errors stopping data flow
The Idle data streams template:
- Is named
[{Integration name}] Idle data streams - Appears in the Alerting tab alongside any bundled templates
- Is generated automatically and isn't bundled with the integration
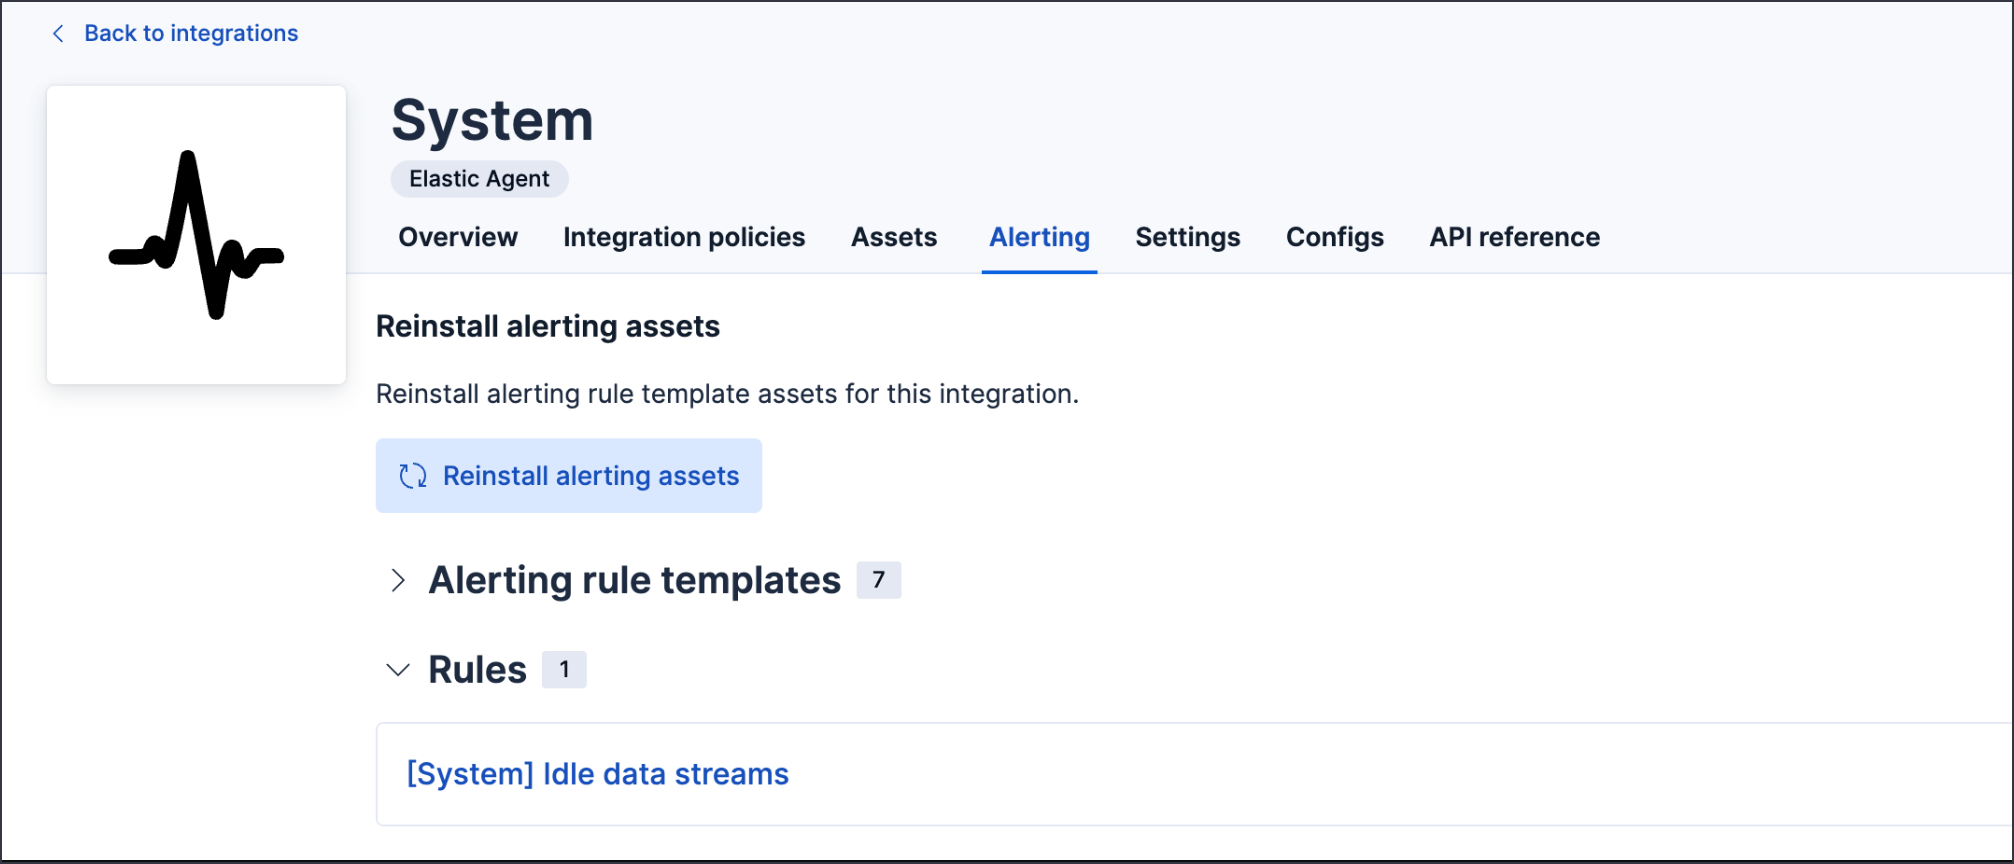
The Idle data streams template monitors all data stream patterns defined by the integration. You can customize the query to monitor specific data streams based on your environment.
Alerting rule templates use the logs-elastic_agent.status_change data stream, which contains agent status changes (for example, online, offline, updating, unenrolled). For more information, refer to Monitor Elastic Agents.
If alerting assets are missing or need to be refreshed, you can reinstall them:
- Open the integration and select the Alerting tab.
- Click Reinstall alerting assets.
Reinstalling alerting assets regenerates the Idle data streams template and restores any bundled alerting rule templates to their default state.
You need package management privileges to reinstall alerting assets.