Osquery Manager integration
| Version | 1.35.1 (View all) |
| Subscription level What's this? |
Basic |
| Developed by What's this? |
Elastic |
| Required permissions | Root privileges |
| Minimum Kibana version(s) | 9.5.3 9.4.6 |
With this integration, you can centrally manage Osquery deployments to Elastic Agents in your Fleet and query host data through distributed SQL.
This integration adds an Osquery UI in Kibana where you can:
- Run live queries for one or more agents
- View a history of past queries and their results
- Schedule queries to capture OS state changes over time
- Save queries and build a library of queries for specific use cases
Osquery results are stored in Elasticsearch, so that you can use the power of the stack to search, analyze, and visualize Osquery data.
For information about using Osquery, refer to the Osquery Kibana documentation. This includes information about required privileges; how to run, schedule, and save queries; how to map osquery fields to ECS; and other useful information about managing Osquery with this integration.
For information about Osquery tables, refer to the Osquery schema documentation and Osquery Extension for Elastic.
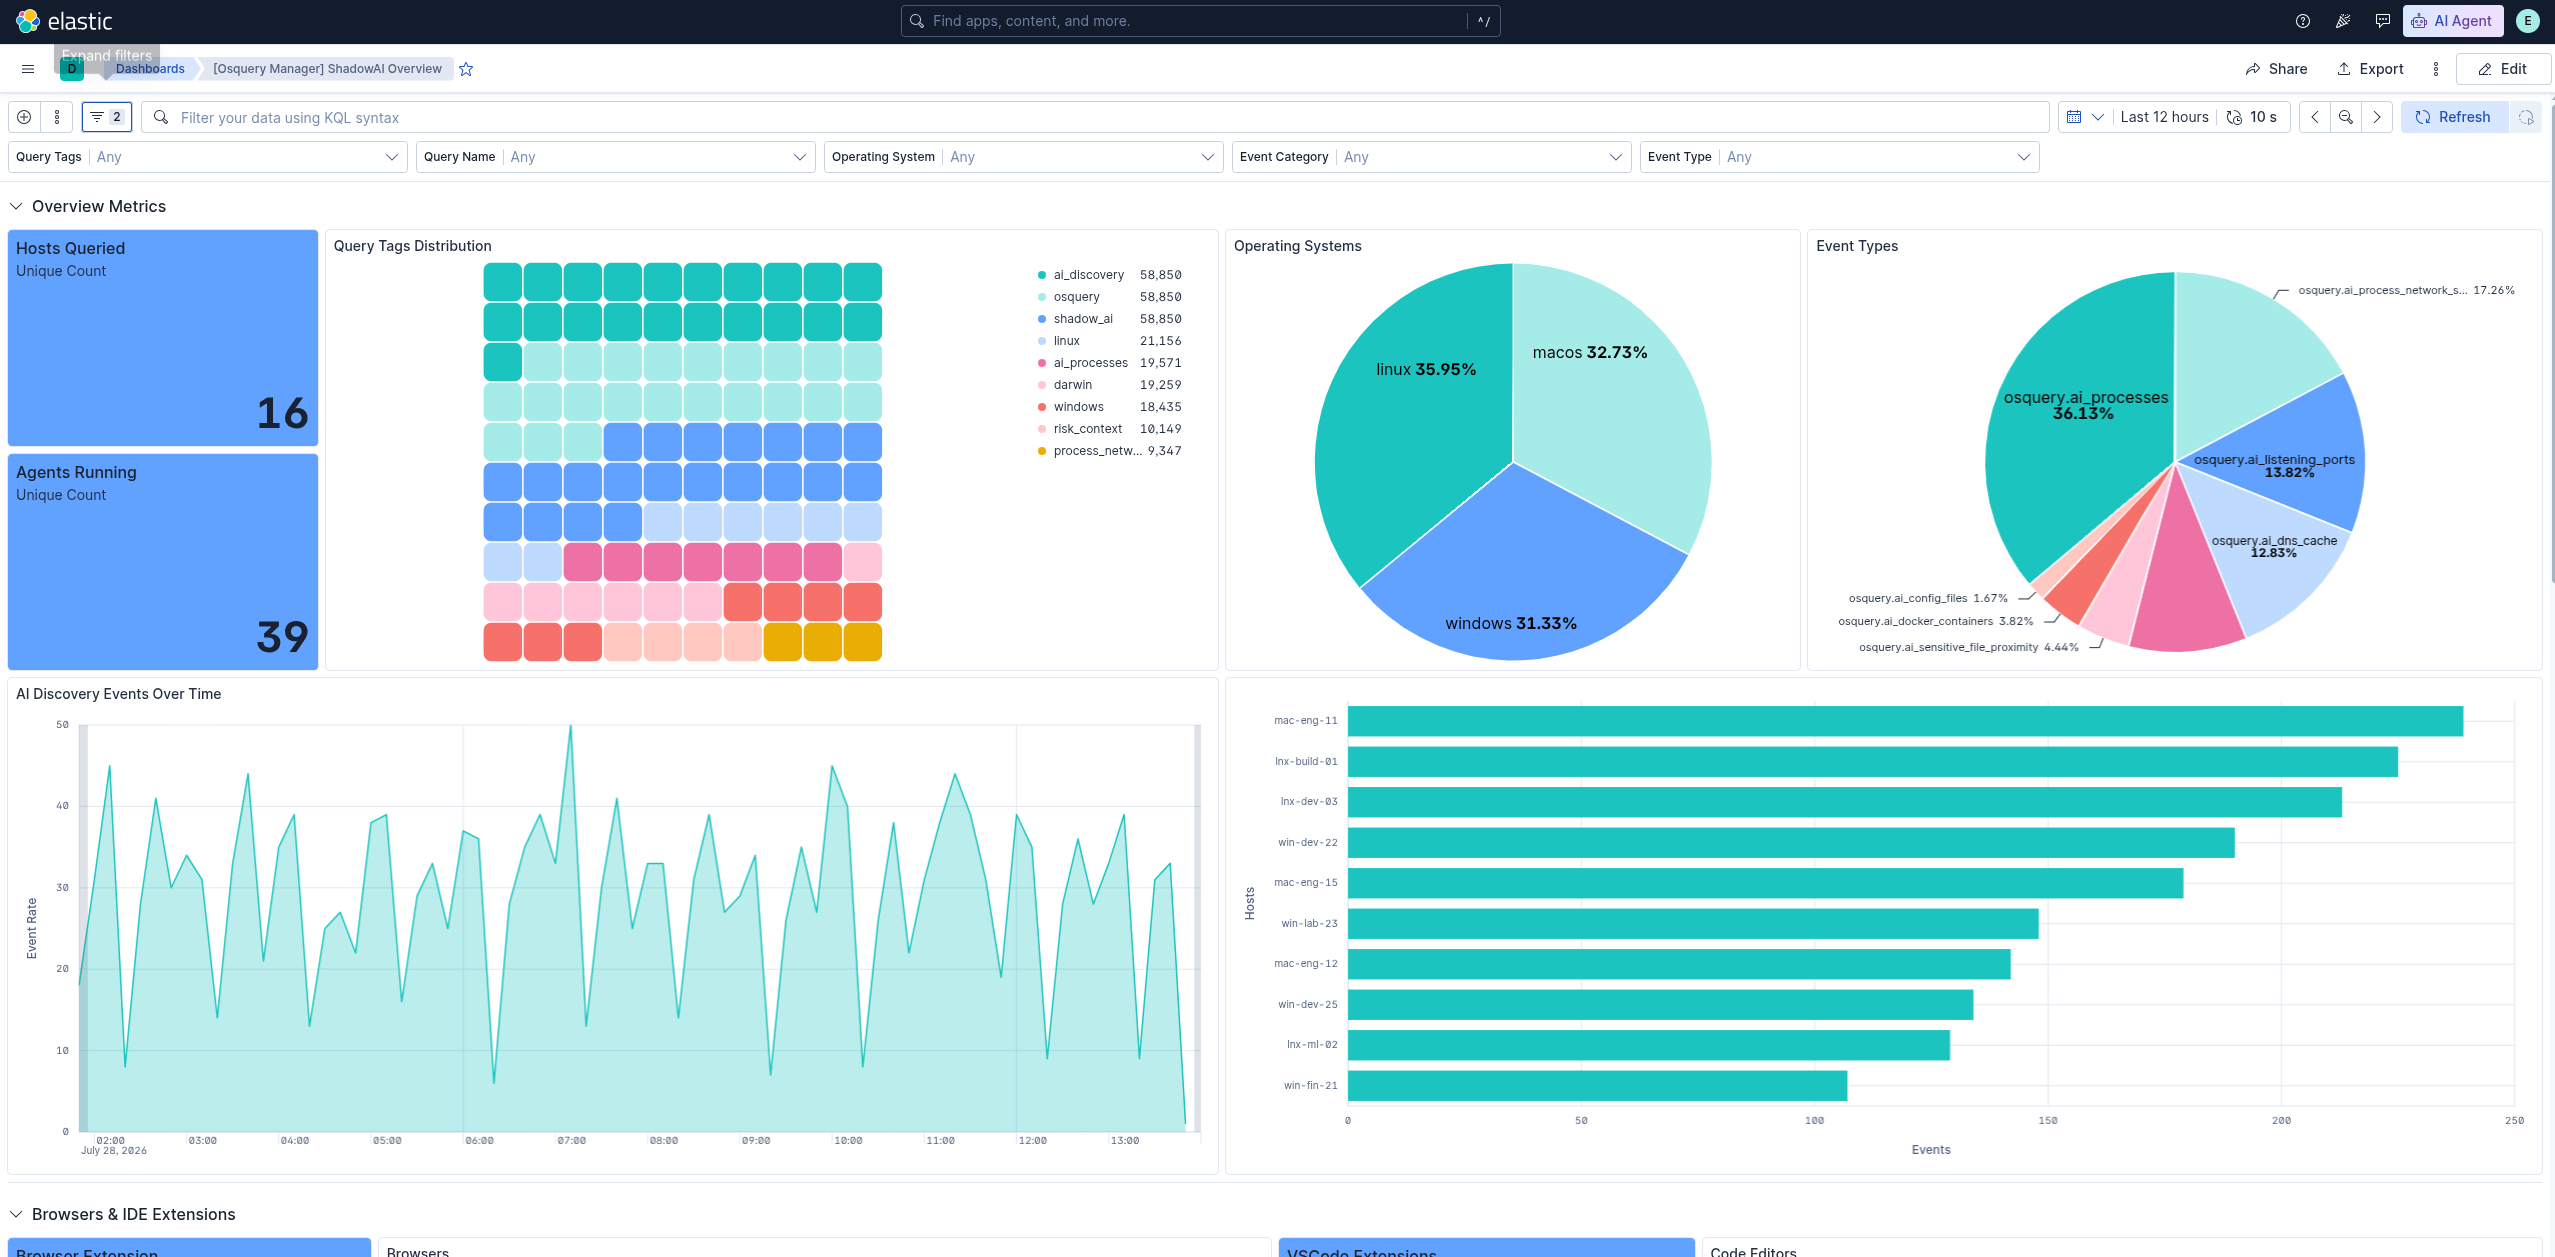
The integration ships prebuilt osquery packs that inventory AI and LLM tooling across your endpoints, giving security and platform teams a single-policy way to answer "what AI is running in my fleet?" — local model runtimes, AI coding agents, Model Context Protocol (MCP) servers, AI packages, browser and editor extensions, and the network and persistence footprint of AI tools.
There is one pack per operating system:
| Pack | Platform |
|---|---|
ai-asset-discovery-windows |
Windows |
ai-asset-discovery-macos |
macOS |
ai-asset-discovery-linux |
Linux |
Assign the pack matching each agent's OS to your Osquery Manager policy in Fleet. Once the scheduled queries run, results are stored in Elasticsearch and tagged with an event.action of osquery.ai_*, so you can search, visualize, and build detections on top of them.
- Running AI tools — local LLM runtimes, AI coding agents, and MCP servers, classified by role in
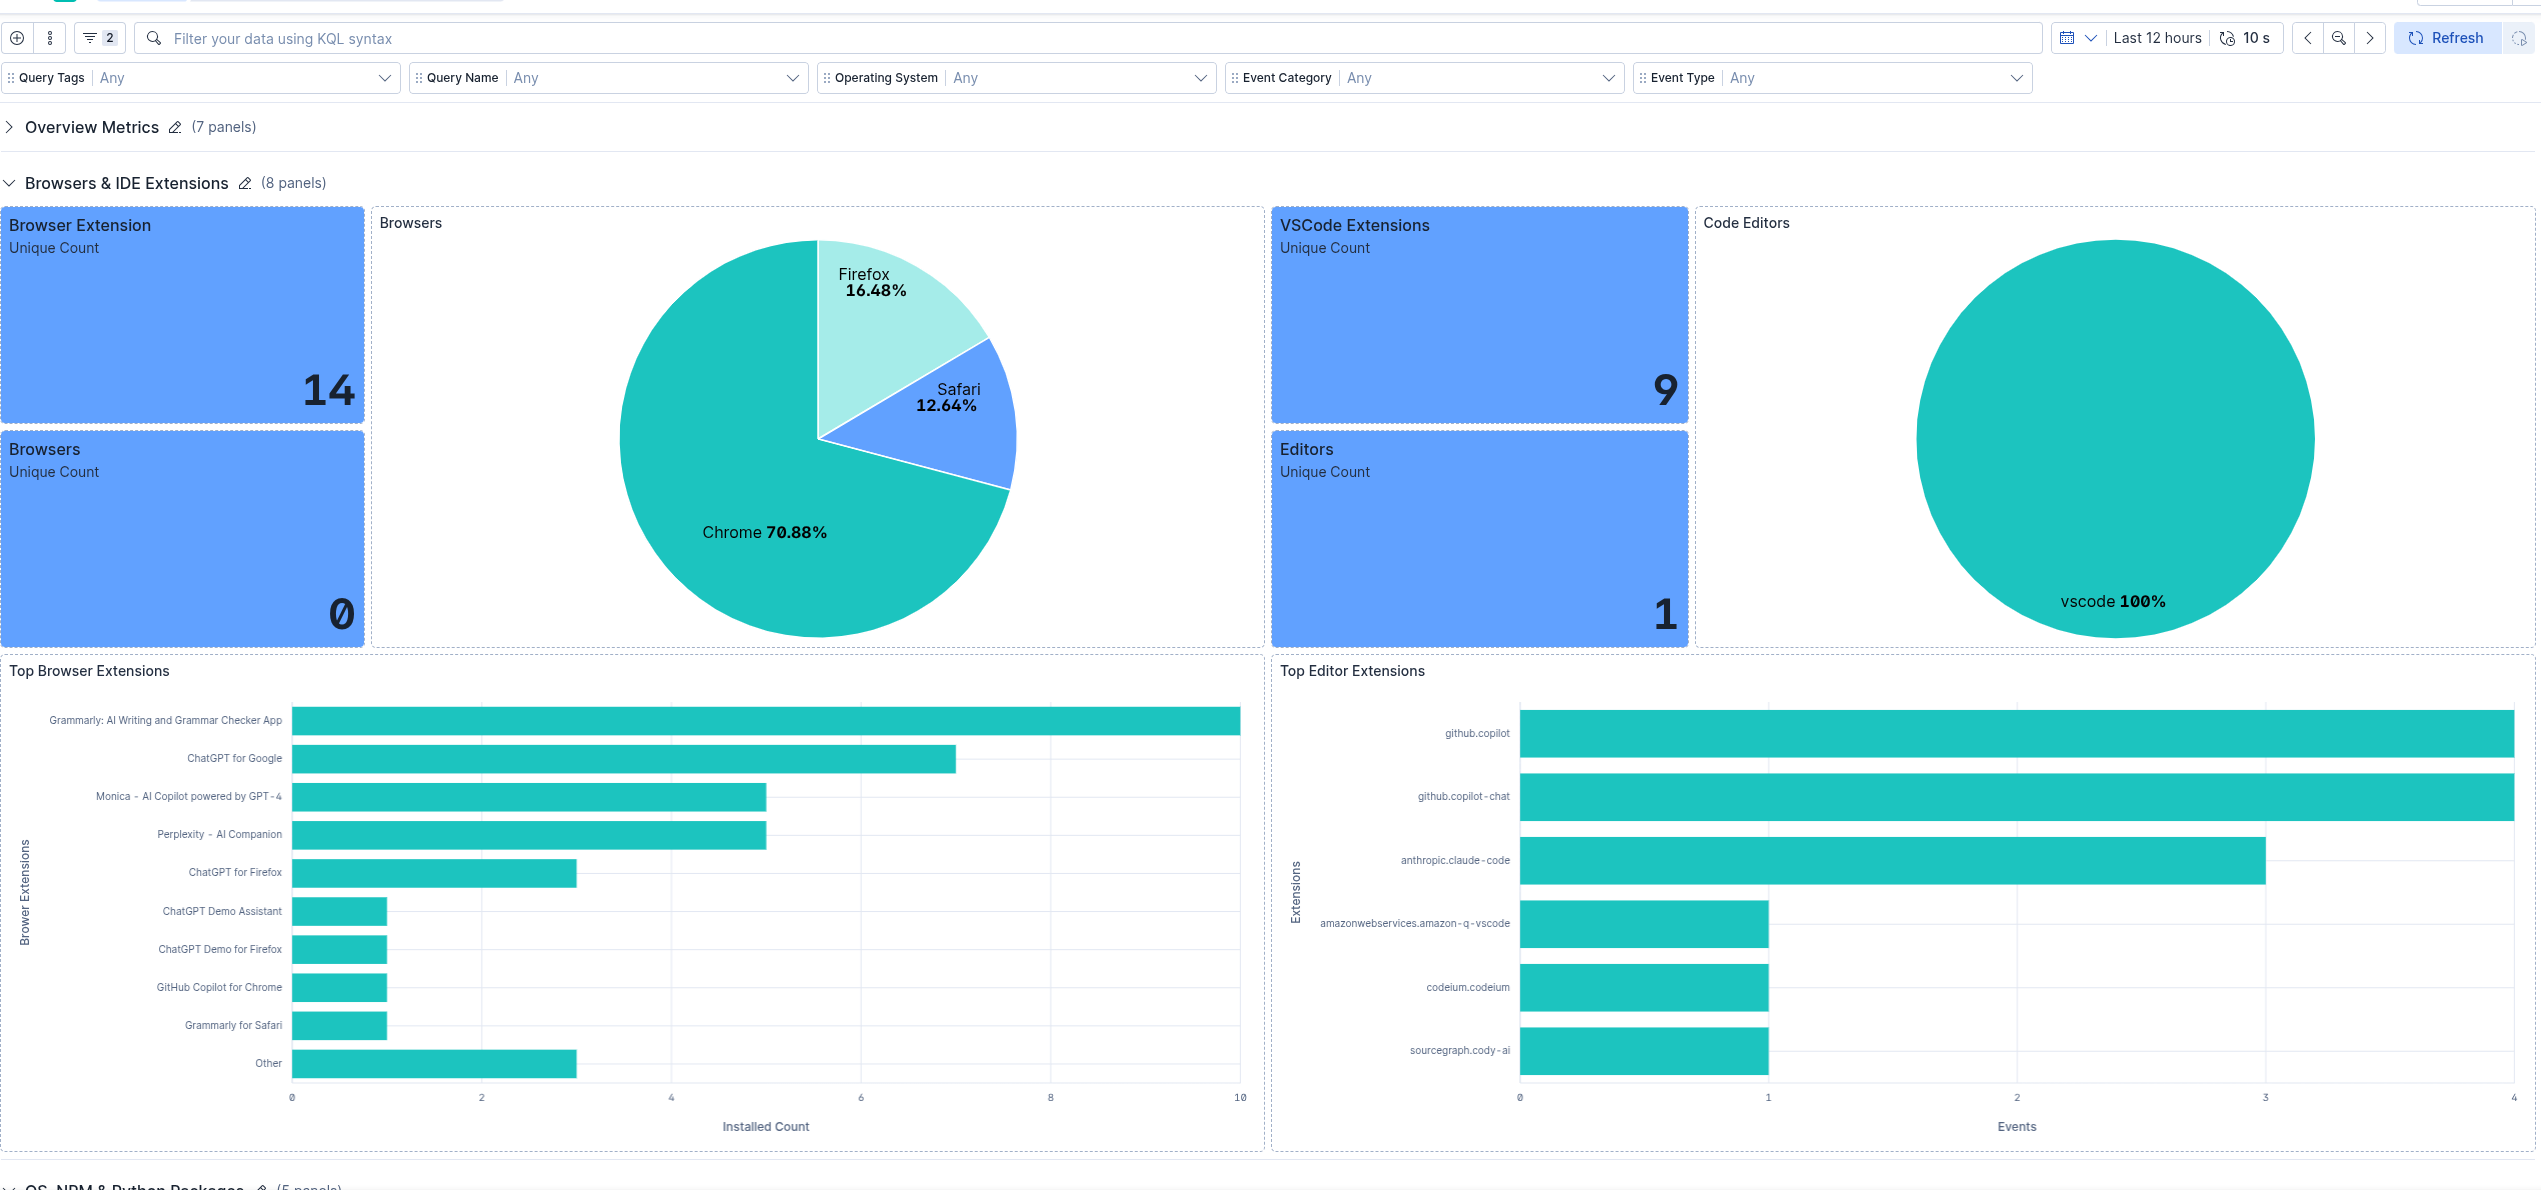
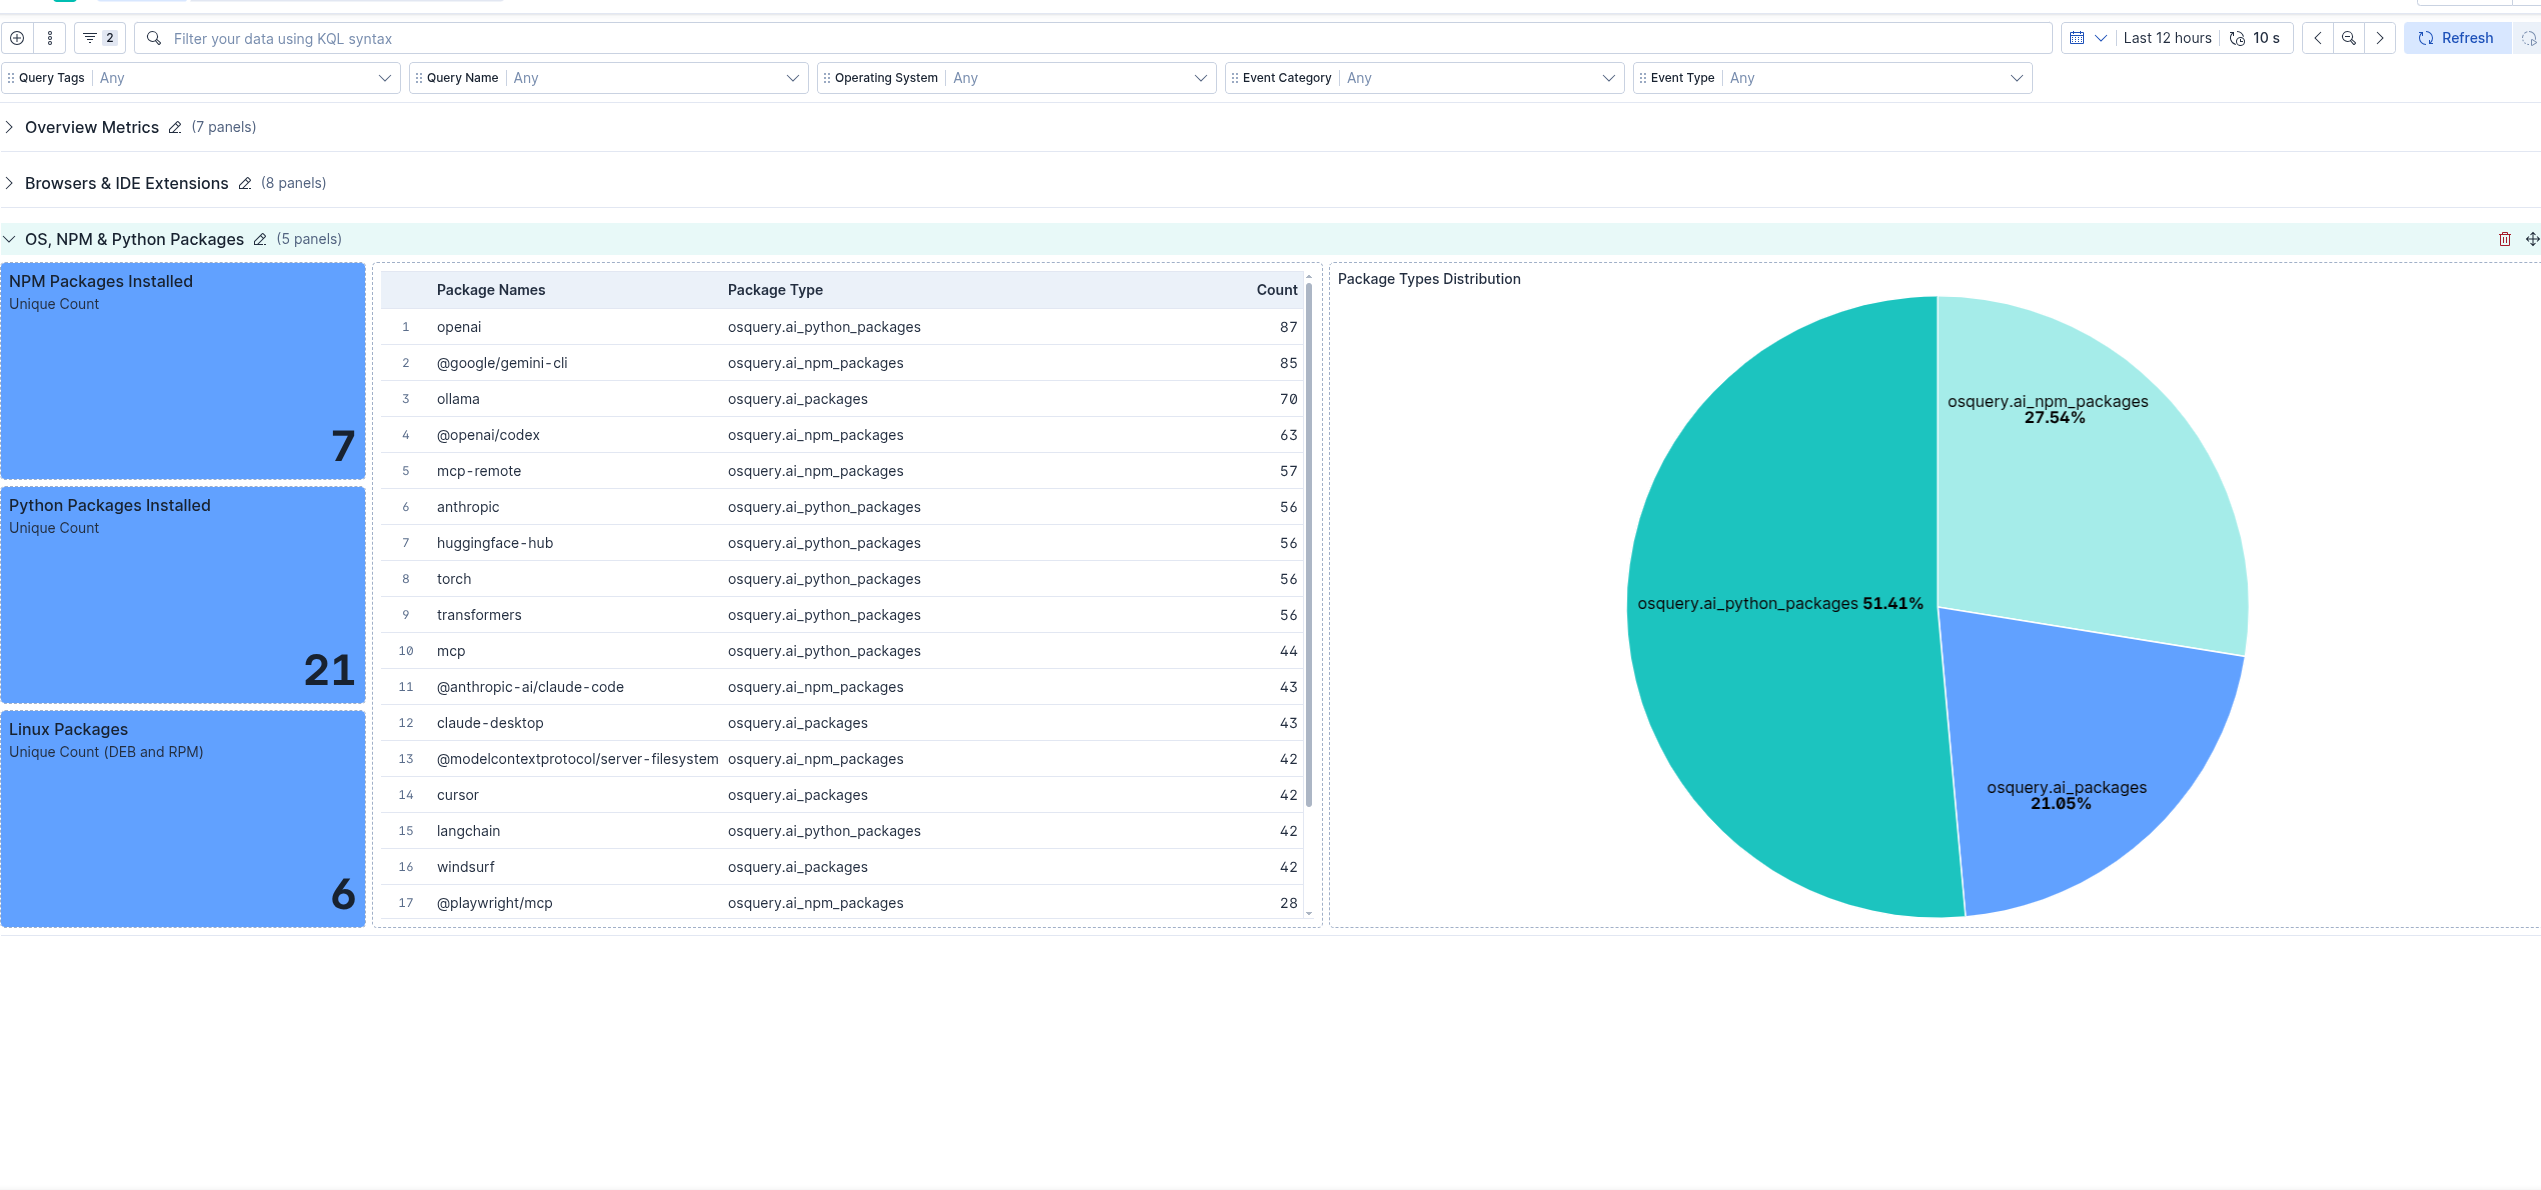
labels.process_category(llm_runtime,agent,mcp). - Installed AI software — desktop apps, OS packages, Python and npm packages, and browser/editor extensions (Chrome, Firefox, Safari, VS Code).
- AI configuration — MCP and AI tool config files and tool directories, plus recent changes to them.
- AI network and persistence footprint — listening ports, outbound sockets for AI processes, and auto-start entries (Windows services, scheduled tasks, launchd, systemd, cron).
Asset queries run in snapshot mode: every scheduled run emits a full, current-state set of rows. This covers packages, extensions, applications, services, scheduled tasks, and the ai_config_files_* inventory. Expect the same asset to reappear on each interval, and use latest-per-host aggregation or time-range filters when building dashboards and hunts.
Queries that observe live state run in differential mode instead: ai_processes_*, ai_listening_ports_*, ai_process_network_summary_*, ai_docker_containers_*, ai_process_envs_*, ai_config_file_changes_*, and ai_dns_cache_windows. Each run reports only what appeared or disappeared since the previous run, so a process that keeps running is reported once when it starts rather than on every interval, and a host with no activity produces no rows. This has two consequences for analysis: panels and rules over these datasets see transitions rather than current state, so widen the time range or aggregate on last-seen; and clearing an agent's data directory re-reports everything once as new.
ai_sensitive_file_proximity_* needs one extra caveat. On macOS and Linux it reports credential paths that an AI process actually holds open. On Windows that evidence is not available, so it pairs AI processes with credential paths belonging to the same user: a row means both exist for that user, not that the process read the file.
These queries collect metadata only — names, versions, paths, ports, and configuration locations. They do not read file contents, prompts, completions, or credentials.
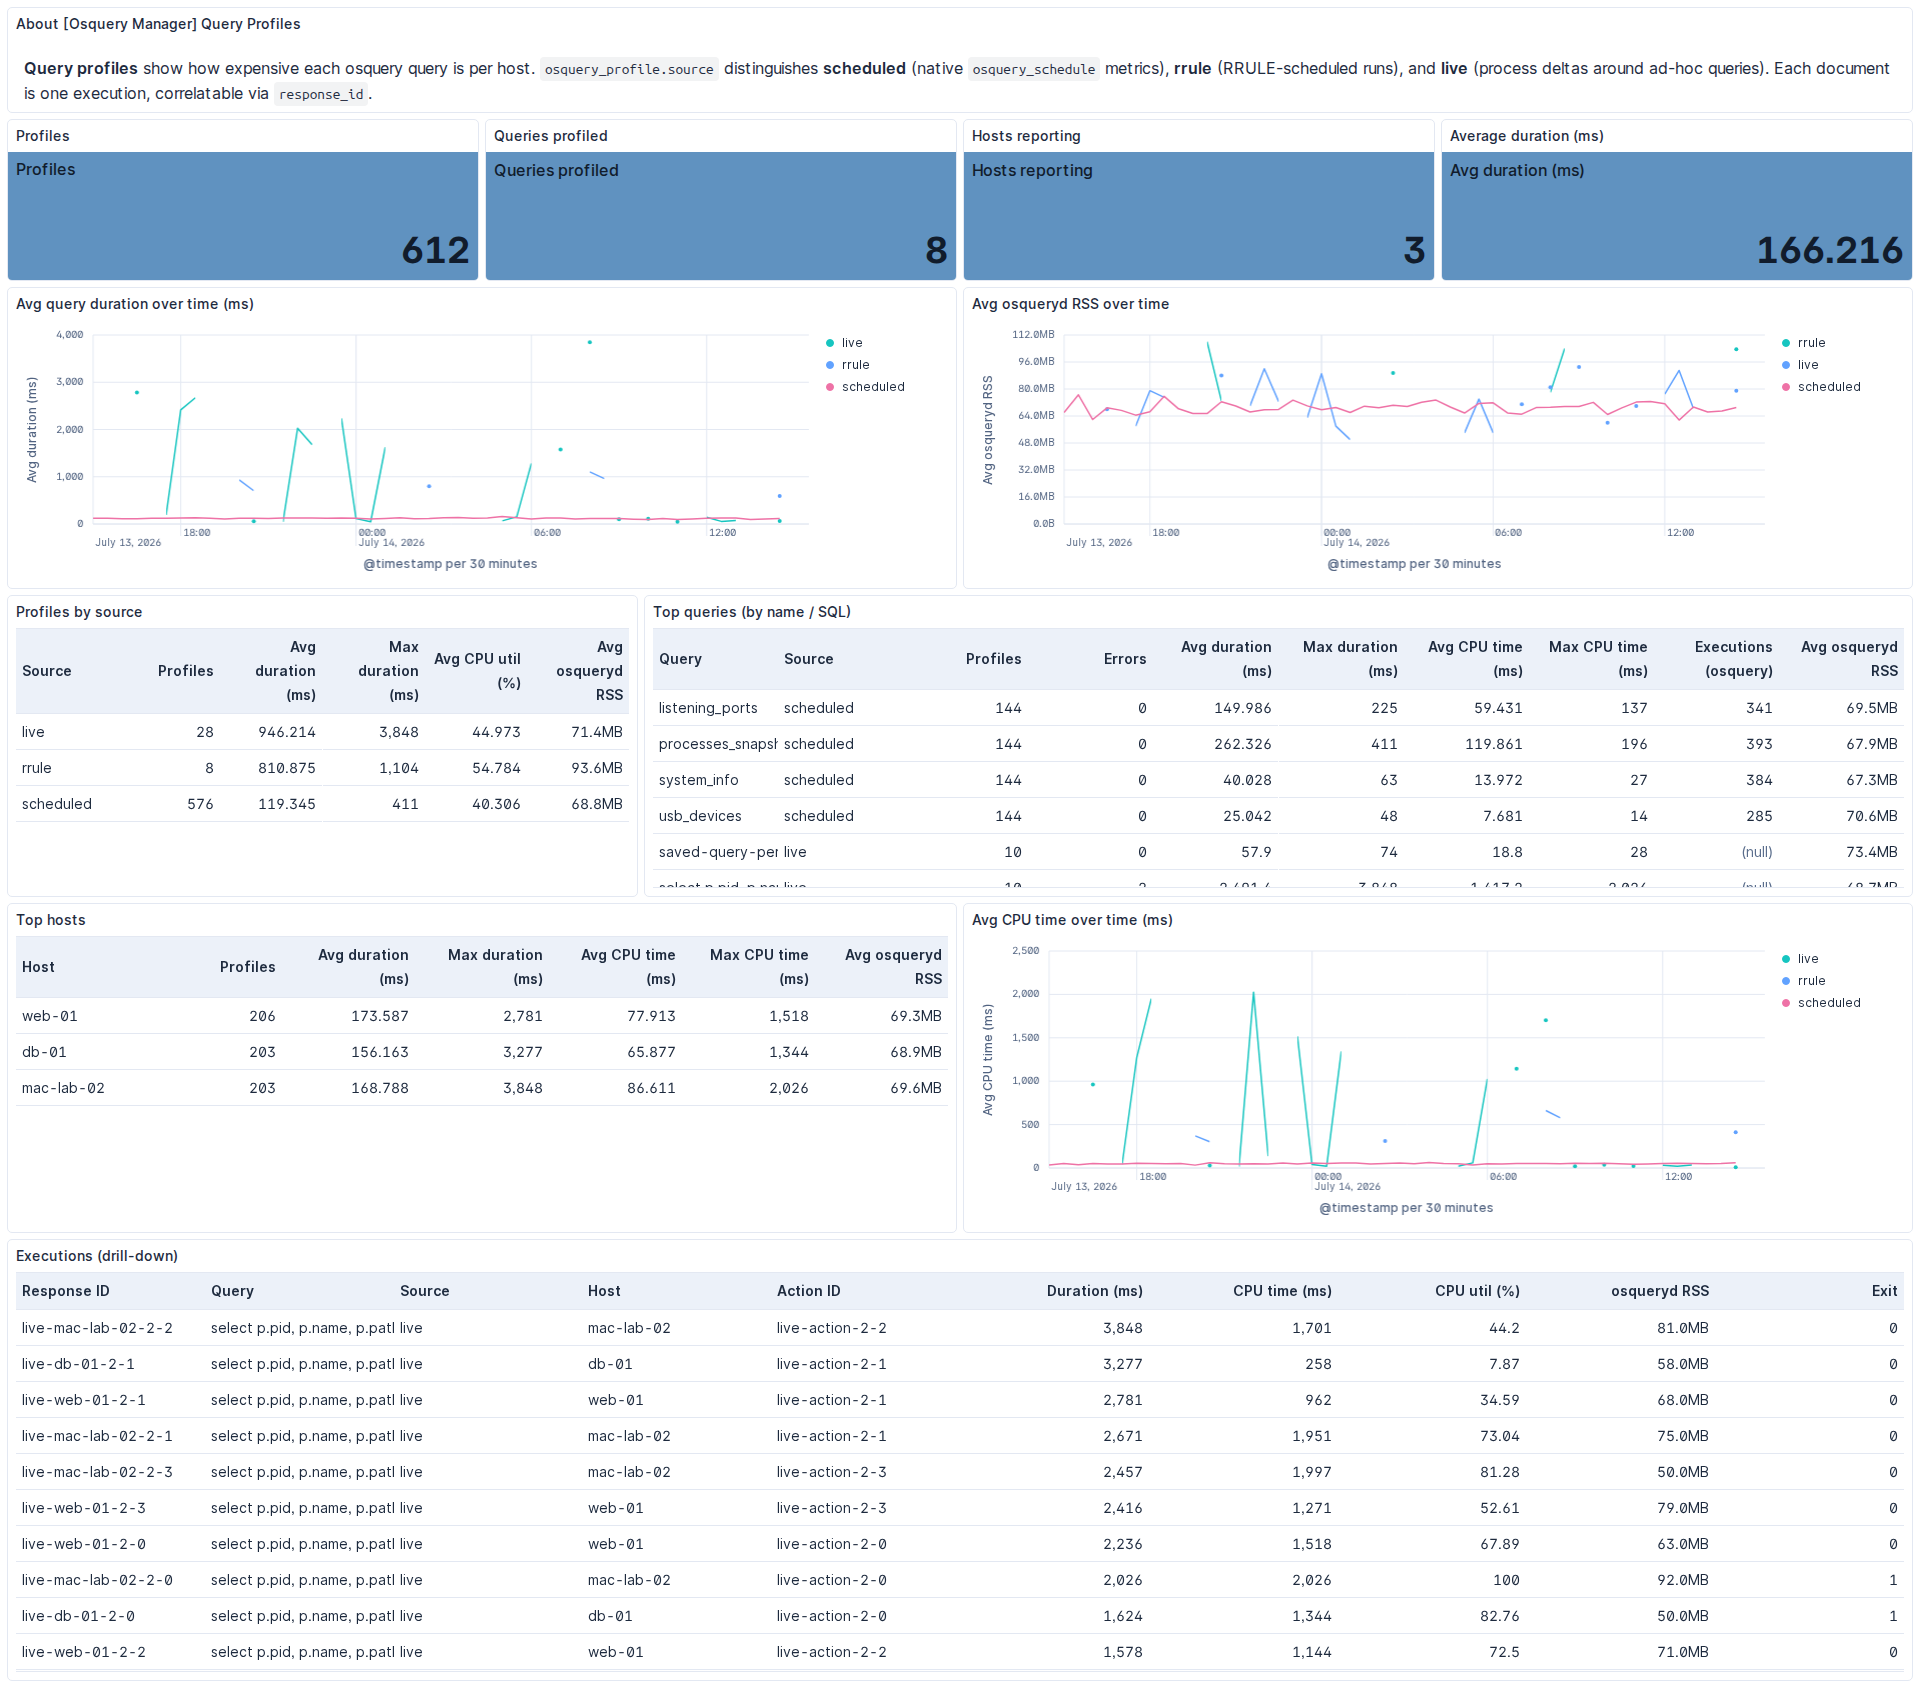
This integration includes one or more Kibana dashboards that visualizes the data collected by the integration. The screenshots below illustrate how the ingested data is displayed.
Changelog
| Version | Details | Minimum Kibana version |
|---|---|---|
| 1.35.1 | Bug fix (View pull request) Declare space_id and action_data.space_id as keyword fields on the result and action_responses data streams |
9.5.3 9.4.6 |
| 1.35.0 | Enhancement (View pull request) Upgrade osquery schema artifacts to version 5.23.1, including corrected Windows certificate fields Bug fix (View pull request) Require Kibana 9.4.6 or 9.5.3+ so the security-fixed osquery runtime is available |
9.5.3 9.4.6 |
| 1.34.0 | Enhancement (View pull request) Add three Windows NTFS forensics osquery queries built on the new elastic_ntfs_* extension tables (requires osquerybeat 9.5.0+ with the NTFS extension) — volume inventory, partition inventory, and a $MFT forensic sweep over high-signal directories that surfaces timestomping ($SI < $FN) and deleted/unallocated MFT entries with full $STANDARD_INFORMATION and $FILE_NAME timestamp sets. |
9.4.2 |
| 1.33.0 | Enhancement (View pull request) Add three Shadow AI Discovery osquery packs (15 Windows, 17 macOS, 16 Linux queries) that inventory AI tooling across endpoints — local LLM runtimes, coding agents, MCP servers, AI packages, and browser/editor extensions, plus their network and persistence footprint. Asset queries run in snapshot mode (full current-state rows each interval) while live-state queries (processes, listening ports, outbound sockets, containers, process environment keys, config file changes, DNS cache) run in differential mode, and all of them collect metadata only. |
9.4.2 |
| 1.32.0 | Enhancement (View pull request) Update the query profiles dashboard per design review — rename "Profiles" to "Executions" across panels, add metric tooltips, sort top queries by average duration, refresh the header help text, and update its saved object metadata to prevent legacy Lens migration failures during package installation. |
9.4.2 |
| 1.31.0 | Enhancement (View pull request) Add query_profile data stream and a Kibana dashboard for query profile events (Fleet stream osquery_manager.query_profile, Lens on logs-*).Enhancement (View pull request) Add an ingest pipeline for query_profile that sets data stream values, copies agent.id to agent_id, consolidates the query identity into a single query.name across scheduled, RRULE, and live profiles, and drops the redundant top-level type discriminator.Enhancement (View pull request) Expand the query profiles dashboard with top queries, top hosts, breakdown by profile source, and a drill-down executions table plus interactive filter controls. |
9.4.2 |
| 1.30.1 | Bug fix (View pull request) Add pack_name and query_name fields to the result and action_responses data streams for scheduled pack queries.Bug fix (View pull request) Update legacy pack dashboards and saved searches to also match scheduled queries by pack_name and query_name instead of action_id only. |
9.4.2 |
| 1.30.0 | Enhancement (View pull request) Add Process_open_handles query and pack |
9.4.2 |
| 1.29.0 | Bug fix (View pull request) Generate ECS *.sections parent mappings from osquery-gen configEnhancement (View pull request) Upgrade osquery version to 5.23.0 |
9.4.2 |
| 1.28.1 | Bug fix (View pull request) Update ECS mappings for *.sections fields in results dataset |
9.4.0 |
| 1.28.0 | Enhancement (View pull request) Add Jumplist query |
9.4.0 |
| 1.27.0 | Enhancement (View pull request) Add Amcache queries and pack |
9.4.0 |
| 1.26.0 | Enhancement (View pull request) Add optional beats tag and branch in osquery-gen config to pin elastic/beats extension specsEnhancement (View pull request) Upgrade osquery version to 5.22.1 |
9.4.0 |
| 1.25.0 | Enhancement (View pull request) Emit schemas/metadata.json from osquery-gen with ecs_version and osquery_version |
9.3.0 |
| 1.24.0 | Enhancement (View pull request) Include schemas for osquery and ECS |
9.3.0 |
| 1.23.0 | Enhancement (View pull request) Align with osquerybeat scheduled responses correlation |
9.3.0 |
| 1.22.0 | Enhancement (View pull request) Add core forensics packs |
9.3.0 |
| 1.21.1 | Enhancement (View pull request) Update documentation and add link to Osquery tables |
9.3.0 |
| 1.21.0 | Enhancement (View pull request) Add core forensics saved queries |
9.3.0 |
| 1.20.0 | Enhancement (View pull request) Update osquery to version 5.19.0 |
9.3.0 |
| 1.19.1 | Bug fix (View pull request) Add root requirement for the integration |
9.2.0 |
| 1.19.0 | Enhancement (View pull request) Update osquery to version 5.18.1 and ECS to 9.10.0 |
9.2.0 |
| 1.18.0 | Bug fix (View pull request) Adjust result mapping to match action responses |
9.0.0 8.16.0 |
| 1.17.0 | Enhancement (View pull request) Update schema for osquery 5.15.0 |
9.0.0 8.16.0 |
| 1.16.0 | Enhancement (View pull request) Add support for Kibana 9.0.0. |
9.0.0 8.16.0 |
| 1.15.0 | Enhancement (View pull request) Add mappings for ECS email fields |
8.16.0 |
| 1.14.0 | Enhancement (View pull request) Update schema for osquery 5.13.1 |
8.16.0 |
| 1.13.0 | Enhancement (View pull request) Update schema for osquery 5.12.1 |
8.16.0 |
| 1.12.0 | Enhancement (View pull request) Add action responses data stream |
8.15.0 |
| 1.11.0 | Enhancement (View pull request) Update schema for osquery 5.10.2 |
8.12.0 |
| 1.10.1 | Bug fix (View pull request) Fix mapping of group fields |
8.10.1 |
| 1.10.0 | Enhancement (View pull request) Upgrade osquery_manager for serverless, pick up ECS 8.10.0 |
8.10.1 |
| 1.9.0 | Enhancement (View pull request) Update schema for osquery 5.8.2 |
8.10.0 |
| 1.8.4 | Enhancement (View pull request) Convert dashboards to Lens |
8.7.1 |
| 1.7.4 | Enhancement (View pull request) Fix elf.sections mapping |
8.7.0 |
| 1.7.3 | Enhancement (View pull request) Resolve mapping conflicts for user.id, user.group.id, group.id |
8.7.0 |
| 1.7.2 | Enhancement (View pull request) Fix mapping conflicts |
8.7.0 |
| 1.7.1 | Enhancement (View pull request) Added categories and/or subcategories. |
8.7.0 |
| 1.7.0 | Enhancement (View pull request) Update schema for osquery 5.7.0 |
8.7.0 |
| 1.6.0 | Enhancement (View pull request) Fix osquery_manager data_stream values for 8.6.0 with ingest pipeline |
8.6.0 |
| 1.5.1 | Enhancement (View pull request) Update kibana constraint to ^8.6 |
8.6.0 |
| 1.5.0 | Enhancement (View pull request) Update schema for osquery 5.5.1 |
— |
| 1.4.1 | Enhancement (View pull request) Add prebuilt DFIR-related saved queries |
8.4.0 |
| 1.4.0 | Enhancement (View pull request) Update schema for osquery 5.4.0 |
8.4.0 |
| 1.3.2 | Bug fix (View pull request) Fix field mapping conflicts Enhancement (View pull request) Update to ECS v8.3.0 |
8.3.0 |
| 1.3.1 | Enhancement (View pull request) Update prebuilt saved queries objects |
8.3.0 |
| 1.3.0 | Enhancement (View pull request) Add prebuilt saved queries |
— |
| 1.2.1 | Enhancement (View pull request) Update readme to remove exported fields |
8.2.0 |
| 1.2.0 | Enhancement (View pull request) Add packs and dashboards |
8.2.0 |
| 1.1.0 | Enhancement (View pull request) Upgrade schema and readme to match osquery 5.2.2. |
— |
| 1.0.0 | Enhancement (View pull request) GA |
8.0.0 7.16.0 |
| 0.8.1 | Enhancement (View pull request) Add explicit mapping for the text fields |
— |
| 0.8.0 | Enhancement (View pull request) Add 8.0.0 version constraint |
8.0.0 7.16.0 |
| 0.7.4 | Enhancement (View pull request) Update fields and readme with host_users, host_groups, host_processes tables. |
7.16.0 |
| 0.7.3 | Enhancement (View pull request) Update team owner. |
— |
| 0.7.2 | Enhancement (View pull request) Update description. |
7.16.0 |
| 0.7.1 | Enhancement (View pull request) Update ecs.yml to include all date and ip ECS 1.12.0 fields types. |
7.16.0 |
| 0.7.0 | Enhancement (View pull request) Update to ECS 1.12.0 |
— |
| 0.6.1 | Enhancement (View pull request) Upgrade schema and readme to match osquery 5.0.1. |
— |
| 0.6.0 | Enhancement (View pull request) Change the package to adopt the native osquery configuration better. |
— |
| 0.5.3 | Enhancement (View pull request) Updates readme and adds link to Kibana docs |
7.15.0 |
| 0.5.2 | Enhancement (View pull request) Updates host.ip field mapping from keyword to ip data type |
7.15.0 |
| 0.5.1 | Enhancement (View pull request) Updates mapping and readme for osquery 4.9.0 |
7.15.0 |
| 0.5.0 | Enhancement (View pull request) Update integration description |
— |
| 0.4.1 | Enhancement (View pull request) Update ECS mapping format based on the latest developers feedback |
— |
| 0.4.0 | Enhancement (View pull request) ECS mapping configuration support for queries/streams |
— |
| 0.3.2 | Enhancement (View pull request) Updates Osquery Manager readme for 7.14 Release |
7.14.0 |
| 0.3.1 | Enhancement (View pull request) Updates Osquery Manager mapping and readme for osquery 4.8.0 |
7.14.0 |
| 0.3.0 | Enhancement (View pull request) Add platform and version fields to the streams configuration |
— |
| 0.2.4 | Enhancement (View pull request) Update schema fields description and README |
— |
| 0.2.3 | Enhancement (View pull request) Update manifest and README |
7.13.0 |
| 0.2.2 | Enhancement (View pull request) Update docs |
— |
| 0.2.1 | Enhancement (View pull request) change to beta |
7.13.0 |
| 0.2.0 | Enhancement (View pull request) Explicit mappings |
— |
| 0.1.0 | Enhancement (View pull request) initial release |
— |