StormShield SNS Integration for Elastic
| Version | 1.6.1 (View all) |
| Subscription level What's this? |
Basic |
| Developed by What's this? |
Elastic |
| Ingestion method(s) | Network Protocol |
| Minimum Kibana version(s) | 9.0.0 8.11.4 |
The StormShield SNS integration for Elastic enables you to collect and analyze security events and system logs from Stormshield Network Security (SNS) firewalls. By ingesting these logs into the Elastic Stack, you can monitor network activity, detect threats in real-time, and maintain detailed audit trails for compliance.
This integration is compatible with the following third-party vendor systems:
- Stormshield Network Security (SNS) firewalls running the unified firmware base.
- SNS 4.x and SNS 5.x, which share the same WELF key-value audit log format.
This integration collects logs from Stormshield SNS firewalls by receiving syslog data over udp or tcp. You deploy an Elastic Agent on a host that is configured as a syslog receiver. Once the agent is configured to listen on the appropriate port, you set up your Stormshield devices to forward logs to that agent. The agent then forwards the events to your Elastic deployment, where they are parsed and mapped to the Elastic Common Schema (ECS) for analysis and visualization.
The StormShield SNS integration collects a variety of security and system events from SNS instances into a single log data stream. The collected log families provide specific insights into network activity:
- Firewall logs: These provide detailed records of filter and NAT policy decisions, including source and destination IP addresses, ports, and protocols.
- Audit and administrative logs: These capture events related to administrative logins, configuration changes through
serverd, and system-level operations. - Alarm logs: These contain security-specific alerts generated by the SNS Intrusion Prevention System (IPS) and detection engines.
- Traffic statistics: These ingest periodic statistics to monitor bandwidth usage and application performance.
logdata stream: This collects Stormshield logs using theUDPorTCPprotocols.
Integrating StormShield SNS logs with the Elastic Stack provides visibility into your network security posture and operational health. You can use this integration for the following:
- Security monitoring and threat detection: Use firewall and alarm logs to identify unauthorized access attempts and detect threats identified by the SNS IPS.
- Compliance and auditing: Maintain a searchable record of administrative actions and configuration changes to meet regulatory requirements.
- Network performance analysis: Use traffic statistics to visualize bandwidth usage and optimize network throughput.
- Incident investigation: Correlate SNS logs with other data sources in Elastic to accelerate root-cause analysis during security incidents.
To collect data from your Stormshield SNS appliance, you'll need the following components and configurations:
Before you begin, ensure you have these vendor-specific requirements:
- Root or full administrator credentials for the Stormshield Network Security web administration interface.
- Network connectivity between the SNS appliance and the host where you've installed Elastic Agent.
- Open syslog ports on any intermediate firewalls, such as the default
514for UDP or601for TCP. - The static IP address or FQDN of the host running the Elastic Agent.
- No additional license is required for standard syslog forwarding (note: Stormshield Log Supervisor (SLS) requires a separate license, but this integration uses standard syslog).
You'll also need the following Elastic Stack components:
- An active Elastic Agent installed and enrolled in a policy.
- Reachability from the SNS appliance to the host running the Elastic Agent on the configured syslog port.
- An Elastic Stack user with permissions to manage integrations and Fleet policies.
You'll need to install Elastic Agent. For more details, check the Elastic Agent installation instructions. You can install only one Elastic Agent per host.
Elastic Agent is required to receive syslog data over UDP or TCP and ship the data to Elastic, where the events are processed using the integration's ingest pipelines.
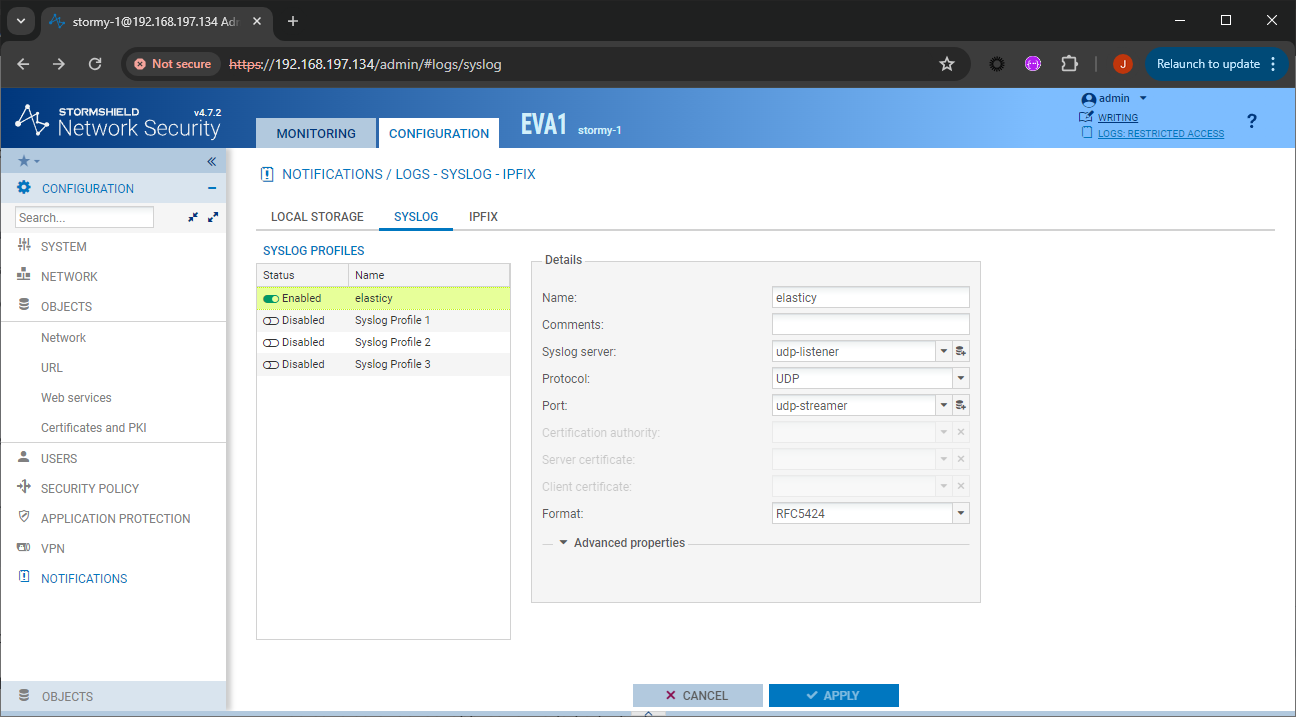
To configure Stormshield Network Security (SNS) to forward logs to the Elastic Agent, follow these steps:
- Log in to the Stormshield Network Security web administration interface.
- Navigate to the CONFIGURATION tab.
- Go to NOTIFICATIONS → LOGS - SYSLOG - IPFIX.
- In the Syslog section, make sure the service is enabled by switching the status to ON.
- Select a Profile slot to edit (e.g., Profile 1).
- In the Syslog server field, select or create a host object corresponding to the Elastic Agent host.
- Enter the Port number matching your Elastic Agent configuration (e.g.,
514for UDP or601for TCP). - Select the Protocol (UDP or TCP) that matches your integration input.
- Set the Format to RFC5424. The integration expects RFC5424 messages; the Legacy and Legacy long formats are not supported at this time.
- In the Advanced properties section, enable the specific log families you want to send. Make sure Filter Policy, Administration, System, and Alarms are active.
- Click Apply to save the syslog configuration.
- Navigate to Configuration → Security policy → Filter - NAT.
- Identify the security rules for which you want to collect logs.
- Double-click a rule to open its properties.
- Go to the Action menu or the General tab.
- Set the Log level to Standard (connection log).
- Click OK and then click Apply at the top of the interface to deploy the policy change.
SNS firewalls can also export network flow records over the IPFIX protocol, configured in the same NOTIFICATIONS → LOGS - SYSLOG - IPFIX module (default port 4739). Flow records are not handled by this integration: to collect them, use the NetFlow Records integration, which supports IPFIX. Both integrations can run on the same Elastic Agent to combine audit logs with flow analytics.
- Stormshield SNS Syslog Configuration
- Stormshield SNS Log Configuration Documentation
- FireMon - Stormshield Device Configuration Guide
To set up the integration in Kibana, follow these steps:
- In Kibana, navigate to Management → Integrations.
- Search for and select Stormshield SNS.
- Click Add Stormshield SNS.
- Configure the inputs based on your Stormshield SNS configuration.
Choose the setup instructions below that match your configuration.
This input collects Stormshield logs using the UDP protocol.
| Setting | Description |
|---|---|
| Listen Address | The bind address to listen for UDP connections. Set to 0.0.0.0 (replace with your actual value) to bind to all available interfaces. Default: localhost. |
| Listen Port | The UDP port number to listen on. Default: 514. |
| Preserve original event | If checked, a raw copy of the original event is added to the field event.original. Default: false. |
| Tags | A list of tags to add to the events. Default: forwarded. |
Under Advanced Options, you can configure the following optional parameters:
| Setting | Description |
|---|---|
| Custom UDP Options | Specify custom configuration options for the UDP input such as read_buffer, max_message_size, or timeout. |
| Processors | Add custom processors to reduce fields or enhance the event with metadata before parsing. |
This input collects Stormshield logs using the TCP protocol.
| Setting | Description |
|---|---|
| Listen Address | The bind address to listen for TCP connections. Set to 0.0.0.0 (replace with your actual value) to bind to all available interfaces. Default: localhost. |
| Listen Port | The TCP port number to listen on. Default: 601. |
| Preserve original event | If checked, a raw copy of the original event is added to the field event.original. Default: false. |
| Tags | A list of tags to add to the events. Default: forwarded. |
Under Advanced Options, you can configure the following optional parameters:
| Setting | Description |
|---|---|
| Custom TCP Options | Specify custom configuration options for the TCP input such as framing: rfc6587. |
| SSL Configuration | Configure SSL options including certificate and key for encrypted log transmission. |
| Processors | Add custom processors to reduce fields or enhance the event with metadata before parsing. |
- Follow the prompts to add the integration to an Elastic Agent policy.
- Save and deploy the integration.
Once you've completed the configuration, verify that data is flowing correctly.
Perform the following actions on your Stormshield device to generate logs:
- Generate web traffic: From a client workstation behind the Stormshield firewall, browse several external websites to generate Filter and NAT logs.
- Generate administrative audit: Log out and log back into the Stormshield web administration interface to trigger an administration event.
- Generate configuration event: Enter configuration mode, make a minor change (such as a rule description), save it, and exit to trigger a
serverdlog. - Trigger alarm: If a test environment is available, attempt a restricted access pattern (such as an Nmap scan) to trigger an intrusion detection alarm.
To verify the data in Kibana:
- Navigate to Analytics → Discover.
- Select the
logs-*data view. - Enter the following KQL filter in the search bar:
data_stream.dataset : "stormshield.log" - Verify logs appear and expand an entry to confirm the presence of fields like
event.dataset,source.ip, andmessage. - Navigate to Analytics → Dashboards and search for "Stormshield SNS" to view pre-built visualizations.
For help with Elastic ingest tools, you can check the common problems documentation.
If you're having trouble getting data from your Stormshield SNS appliance into the Elastic Stack, you can check the following common issues:
- No data is being collected: You should verify that the syslog port configured on your Stormshield SNS appliance exactly matches the
Listen Portsetting in your Elastic integration, such as514or601. - Connection refused or timeout: You'll need to ensure that any firewalls or network access control lists (ACLs) between your SNS appliance and the Elastic Agent host allow traffic on the configured port. You should also check the local firewall on the host machine.
- Logs only appearing from the local host: If you've set the
Listen Addresstolocalhost, you'll need to change it to0.0.0.0so the Agent can receive logs from your SNS appliance over the network. - Protocol mismatch: You must ensure that both the SNS appliance and the Elastic Agent are configured to use the same protocol. If you've set one to
TCPand the other toUDP, they won't be able to communicate. - Parsing errors or missing data: You should verify that the syslog
Formaton your SNS appliance is set toRFC5424. If you see_syslog_parse_failuretags in your logs, the format might be mismatched. - TCP message splitting issues: If you're using
TCP, you should check that theframingsetting in your integration (likerfc6587) matches the output configuration of your SNS appliance. - Missing specific log types: If you aren't seeing specific logs like filter or alarm events, you should verify that you've enabled the specific log families in the
Advanced propertiessection of your SNS syslog profile. You'll need to ensure that families likeFilter Policy,Administration,System, andAlarmsare set to active.
To ensure optimal performance in high-volume security environments, you should consider these transport, data volume management, and scaling strategies:
- Transport and collection: This integration supports both UDP and TCP. While UDP offers lower overhead for high-volume environments, it doesn't guarantee delivery. For critical security auditing where log integrity is paramount, use TCP to ensure the Elastic Agent receives every event, though this adds connection overhead.
- Advanced input configuration: For high-volume UDP traffic, you can tune the
read_buffersetting underCustom UDP Optionsto prevent packet loss at the operating system level. Increasing this buffer allows the system to handle bursts of incoming syslog data more effectively. - Data volume management: To manage high data volumes, configure the SNS appliance to forward only necessary event families. Limit Filter Policy logs to high-risk rules rather than logging all traffic. Avoid forwarding debug-level logs to minimize the load on the ingest pipeline and storage. Use the
processorsconfiguration to drop redundant fields at the source before they are sent to Elasticsearch. - Elastic Agent scaling: For high-throughput environments processing thousands of events per second, deploy dedicated Elastic Agents on high-performance hosts. If volume exceeds the capacity of a single agent, distribute traffic across multiple agents using a network load balancer to ensure high availability and horizontal scaling.
For more information on architectures that can be used for scaling this integration, check the Ingest Architectures documentation.
These inputs can be used with this integration:
tcp
For more details about the TCP input settings, check the Filebeat documentation.
To collect logs via TCP, select Collect logs via TCP and configure the following parameters:
Required Settings:
- Host
- Port
Common Optional Settings:
- Max Message Size - Maximum size of incoming messages
- Max Connections - Maximum number of concurrent connections
- Timeout - How long to wait for data before closing idle connections
- Line Delimiter - Character(s) that separate log messages
To enable encrypted connections, configure the following SSL settings:
SSL Settings:
- Enable SSL - Toggle to enable SSL/TLS encryption
- Certificate - Path to the SSL certificate file (
.crtor.pem) - Certificate Key - Path to the private key file (
.key) - Certificate Authorities - Path to CA certificate file for client certificate validation (optional)
- Client Authentication - Require client certificates (
none,optional, orrequired) - Supported Protocols - TLS versions to support (e.g.,
TLSv1.2,TLSv1.3)
Example SSL Configuration:
ssl.enabled: true
ssl.certificate: "/path/to/server.crt"
ssl.key: "/path/to/server.key"
ssl.certificate_authorities: ["/path/to/ca.crt"]
ssl.client_authentication: "optional"
udp
For more details about the UDP input settings, check the Filebeat documentation.
To collect logs via UDP, select Collect logs via UDP and configure the following parameters:
Required Settings:
- Host
- Port
Common Optional Settings:
- Max Message Size - Maximum size of UDP packets to accept (default: 10KB, max: 64KB)
- Read Buffer - UDP socket read buffer size for handling bursts of messages
- Read Timeout - How long to wait for incoming packets before checking for shutdown
You'll find events from Stormshield SNS logs in the log data stream. This data stream includes logs of the following types: traffic, filter, protection, and system events.
Each log family (identified by the logtype field) is mapped to the ECS categorization fields. Alarms raised by the intrusion prevention engine produce event.kind: alert. The periodic statistics families (monitor, filterstat, count, routerstat, authstat, ipsecstat) produce event.kind: metric, so health telemetry can be excluded from detection rule scopes with a single filter. All other families produce event.kind: event.
| logtype | event.kind | event.category | event.type |
|---|---|---|---|
| alarm | alert | intrusion_detection, network | info |
| auth | event | authentication | start |
| authstat | metric | authentication | info |
| connection | event | network, session | connection, end |
| count, filterstat, ipsecstat, routerstat | metric | network | info |
| date | event | host | change |
| dmrouting, routing | event | network, host | change |
| filter | event | network | connection |
| ftp | event | network | info |
| monitor | metric | host | info |
| plugin | event | network | protocol |
| pop3, smtp | event | email, network | info |
| pvm | event | vulnerability | info |
| restapi | event | web, configuration | access |
| sandboxing | event | network | info |
| server | event | configuration | access |
| ssl | event | network | connection |
| system | event | host | info |
| vpn | event | network | info |
| web | event | web, network | access |
| xvpn | event | network, session | connection |
For the families that carry a rule action, event.type additionally receives allowed when the action is pass and denied when the action is block (matched case-insensitively). An empty action field corresponds to a rule set to Log, and no modifier is added. Unknown log families fall back to event.kind: event without event.category or event.type, so a family missing from the table is visible instead of being mislabeled.
For alarm logs, event.code carries the Stormshield alarm identifier, event.risk_score the risk field (1-100), and event.severity the vendor alarm level from pri, where 1 is a major alarm and 4 a minor alarm. This scale is specific to the alarm family. In most other families, the appliance hardcodes the pri field to 5.
network.direction is computed from the source and destination IP addresses, treating private (RFC 1918) address ranges as internal networks.
You'll find a list of all exported fields in the following table:
Exported fields
| Field | Description | Type |
|---|---|---|
| @timestamp | Event timestamp. | date |
| data_stream.dataset | Data stream dataset. | constant_keyword |
| data_stream.namespace | Data stream namespace. | constant_keyword |
| data_stream.type | Data stream type. | constant_keyword |
| destination.as.number | Unique number allocated to the autonomous system. The autonomous system number (ASN) uniquely identifies each network on the Internet. | long |
| destination.as.organization.name | Organization name. | keyword |
| destination.as.organization.name.text | Multi-field of destination.as.organization.name. |
match_only_text |
| destination.bytes | Bytes sent from the destination to the source. | long |
| destination.domain | The domain name of the destination system. This value may be a host name, a fully qualified domain name, or another host naming format. The value may derive from the original event or be added from enrichment. | keyword |
| destination.geo.city_name | City name. | keyword |
| destination.geo.continent_name | Name of the continent. | keyword |
| destination.geo.country_iso_code | Country ISO code. | keyword |
| destination.geo.country_name | Country name. | keyword |
| destination.geo.location | Longitude and latitude. | geo_point |
| destination.geo.name | User-defined description of a location, at the level of granularity they care about. Could be the name of their data centers, the floor number, if this describes a local physical entity, city names. Not typically used in automated geolocation. | keyword |
| destination.geo.region_iso_code | Region ISO code. | keyword |
| destination.geo.region_name | Region name. | keyword |
| destination.ip | IP address of the destination (IPv4 or IPv6). | ip |
| destination.mac | MAC address of the destination. The notation format from RFC 7042 is suggested: Each octet (that is, 8-bit byte) is represented by two [uppercase] hexadecimal digits giving the value of the octet as an unsigned integer. Successive octets are separated by a hyphen. | keyword |
| destination.nat.ip | Translated ip of destination based NAT sessions (e.g. internet to private DMZ) Typically used with load balancers, firewalls, or routers. | ip |
| destination.nat.port | Port the source session is translated to by NAT Device. Typically used with load balancers, firewalls, or routers. | long |
| destination.port | Port of the destination. | long |
| ecs.version | ECS version this event conforms to. ecs.version is a required field and must exist in all events. When querying across multiple indices -- which may conform to slightly different ECS versions -- this field lets integrations adjust to the schema version of the events. |
keyword |
| event.action | The action captured by the event. This describes the information in the event. It is more specific than event.category. Examples are group-add, process-started, file-created. The value is normally defined by the implementer. |
keyword |
| event.category | This is one of four ECS Categorization Fields, and indicates the second level in the ECS category hierarchy. event.category represents the "big buckets" of ECS categories. For example, filtering on event.category:process yields all events relating to process activity. This field is closely related to event.type, which is used as a subcategory. This field is an array. This will allow proper categorization of some events that fall in multiple categories. |
keyword |
| event.code | Identification code for this event, if one exists. Some event sources use event codes to identify messages unambiguously, regardless of message language or wording adjustments over time. An example of this is the Windows Event ID. | keyword |
| event.duration | Duration of the event in nanoseconds. If event.start and event.end are known this value should be the difference between the end and start time. |
long |
| event.kind | This is one of four ECS Categorization Fields, and indicates the highest level in the ECS category hierarchy. event.kind gives high-level information about what type of information the event contains, without being specific to the contents of the event. For example, values of this field distinguish alert events from metric events. The value of this field can be used to inform how these kinds of events should be handled. They may warrant different retention, different access control, it may also help understand whether the data is coming in at a regular interval or not. |
keyword |
| event.risk_score | Risk score or priority of the event (e.g. security solutions). Use your system's original value here. | float |
| event.severity | The numeric severity of the event according to your event source. What the different severity values mean can be different between sources and use cases. It's up to the implementer to make sure severities are consistent across events from the same source. The Syslog severity belongs in log.syslog.severity.code. event.severity is meant to represent the severity according to the event source (e.g. firewall, IDS). If the event source does not publish its own severity, you may optionally copy the log.syslog.severity.code to event.severity. |
long |
| event.type | This is one of four ECS Categorization Fields, and indicates the third level in the ECS category hierarchy. event.type represents a categorization "sub-bucket" that, when used along with the event.category field values, enables filtering events down to a level appropriate for single visualization. This field is an array. This will allow proper categorization of some events that fall in multiple event types. |
keyword |
| input.type | Type of input. | keyword |
| log.source.address | Source address for the log. | keyword |
| log.syslog.appname | The device or application that originated the Syslog message, if available. | keyword |
| log.syslog.facility.code | The Syslog numeric facility of the log event, if available. According to RFCs 5424 and 3164, this value should be an integer between 0 and 23. | long |
| log.syslog.facility.name | The Syslog text-based facility of the log event, if available. | keyword |
| log.syslog.hostname | The hostname, FQDN, or IP of the machine that originally sent the Syslog message. This is sourced from the hostname field of the syslog header. Depending on the environment, this value may be different from the host that handled the event, especially if the host handling the events is acting as a collector. | keyword |
| log.syslog.priority | Syslog numeric priority of the event, if available. According to RFCs 5424 and 3164, the priority is 8 * facility + severity. This number is therefore expected to contain a value between 0 and 191. | long |
| log.syslog.severity.code | The Syslog numeric severity of the log event, if available. If the event source publishing via Syslog provides a different numeric severity value (e.g. firewall, IDS), your source's numeric severity should go to event.severity. If the event source does not specify a distinct severity, you can optionally copy the Syslog severity to event.severity. |
long |
| log.syslog.severity.name | The Syslog numeric severity of the log event, if available. If the event source publishing via Syslog provides a different severity value (e.g. firewall, IDS), your source's text severity should go to log.level. If the event source does not specify a distinct severity, you can optionally copy the Syslog severity to log.level. |
keyword |
| log.syslog.version | The version of the Syslog protocol specification. Only applicable for RFC 5424 messages. | keyword |
| message | For log events the message field contains the log message, optimized for viewing in a log viewer. For structured logs without an original message field, other fields can be concatenated to form a human-readable summary of the event. If multiple messages exist, they can be combined into one message. | match_only_text |
| network.bytes | Total bytes transferred in both directions. If source.bytes and destination.bytes are known, network.bytes is their sum. |
long |
| network.direction | Direction of the network traffic. When mapping events from a host-based monitoring context, populate this field from the host's point of view, using the values "ingress" or "egress". When mapping events from a network or perimeter-based monitoring context, populate this field from the point of view of the network perimeter, using the values "inbound", "outbound", "internal" or "external". Note that "internal" is not crossing perimeter boundaries, and is meant to describe communication between two hosts within the perimeter. Note also that "external" is meant to describe traffic between two hosts that are external to the perimeter. This could for example be useful for ISPs or VPN service providers. | keyword |
| network.protocol | In the OSI Model this would be the Application Layer protocol. For example, http, dns, or ssh. The field value must be normalized to lowercase for querying. |
keyword |
| network.transport | Same as network.iana_number, but instead using the Keyword name of the transport layer (udp, tcp, ipv6-icmp, etc.) The field value must be normalized to lowercase for querying. | keyword |
| network.type | In the OSI Model this would be the Network Layer. ipv4, ipv6, ipsec, pim, etc The field value must be normalized to lowercase for querying. | keyword |
| observer.egress.interface.id | Interface ID as reported by an observer (typically SNMP interface ID). | keyword |
| observer.egress.interface.name | Interface name as reported by the system. | keyword |
| observer.ingress.interface.id | Interface ID as reported by an observer (typically SNMP interface ID). | keyword |
| observer.ingress.interface.name | Interface name as reported by the system. | keyword |
| observer.name | Custom name of the observer. This is a name that can be given to an observer. This can be helpful for example if multiple firewalls of the same model are used in an organization. If no custom name is needed, the field can be left empty. | keyword |
| observer.product | The product name of the observer. | keyword |
| observer.type | The type of the observer the data is coming from. There is no predefined list of observer types. Some examples are forwarder, firewall, ids, ips, proxy, poller, sensor, APM server. |
keyword |
| observer.vendor | Vendor name of the observer. | keyword |
| process.name | Process name. Sometimes called program name or similar. | keyword |
| process.name.text | Multi-field of process.name. |
match_only_text |
| related.hosts | All hostnames or other host identifiers seen on your event. Example identifiers include FQDNs, domain names, workstation names, or aliases. | keyword |
| related.ip | All of the IPs seen on your event. | ip |
| related.user | All the user names or other user identifiers seen on the event. | keyword |
| rule.id | A rule ID that is unique within the scope of an agent, observer, or other entity using the rule for detection of this event. | keyword |
| rule.name | The name of the rule or signature generating the event. | keyword |
| source.as.number | Unique number allocated to the autonomous system. The autonomous system number (ASN) uniquely identifies each network on the Internet. | long |
| source.as.organization.name | Organization name. | keyword |
| source.as.organization.name.text | Multi-field of source.as.organization.name. |
match_only_text |
| source.bytes | Bytes sent from the source to the destination. | long |
| source.geo.city_name | City name. | keyword |
| source.geo.continent_name | Name of the continent. | keyword |
| source.geo.country_iso_code | Country ISO code. | keyword |
| source.geo.country_name | Country name. | keyword |
| source.geo.location | Longitude and latitude. | geo_point |
| source.geo.name | User-defined description of a location, at the level of granularity they care about. Could be the name of their data centers, the floor number, if this describes a local physical entity, city names. Not typically used in automated geolocation. | keyword |
| source.geo.region_iso_code | Region ISO code. | keyword |
| source.geo.region_name | Region name. | keyword |
| source.ip | IP address of the source (IPv4 or IPv6). | ip |
| source.mac | MAC address of the source. The notation format from RFC 7042 is suggested: Each octet (that is, 8-bit byte) is represented by two [uppercase] hexadecimal digits giving the value of the octet as an unsigned integer. Successive octets are separated by a hyphen. | keyword |
| source.nat.ip | Translated ip of source based NAT sessions (e.g. internal client to internet) Typically connections traversing load balancers, firewalls, or routers. | ip |
| source.nat.port | Translated port of source based NAT sessions. (e.g. internal client to internet) Typically used with load balancers, firewalls, or routers. | long |
| source.port | Port of the source. | long |
| stormshield.dstif | Name of the destination interface. String of characters in UTF-8 format. Example: Ethernet 1 Available from: SNS v1.0.0. | keyword |
| stormshield.dstifname | Name of the object representing the traffics destination interface. String of characters in UTF-8 format. Example: dmz1 Available from: SNS v1.0.0. | keyword |
| stormshield.fw | firewall's ID This is the name entered by the administrator or, by default, its serial number. String of characters in UTF-8 format. Example: firewall_name or V50XXXXXXXXXXXX Available from: SNS v1.0.0. | keyword |
| stormshield.in_bytes | Count of bytes coming into the firewall | long |
| stormshield.logtype | The specific type of log this is from. | keyword |
| stormshield.metadata | Flattened metadata | flattened |
| stormshield.out_bytes | Count of bytes leaving the firewall | long |
| stormshield.ports | The network ports found on the device | keyword |
| stormshield.service | Service (product with a dedicated port) on which the vulnerability was detected. String of characters in UTF-8 format. Example: OpenSSH_5.4 | keyword |
| stormshield.srcif | Internal name of the interface at the source of the traffic. String of characters in UTF-8 format. Example: Ethernet0 Available from: SNS v1.0.0. | keyword |
| stormshield.srcifname | Name of the object representing the interface at the source of the traffic. String of characters in UTF-8 format. Example: out Available from: SNS v1.0.0. | keyword |
| stormshield.startime | Local time at the beginning of the logged event (time configured on the Firewall). String in YYYY-MM-DD HH:MM:SS format. Available from: SNS v1.0.0. | keyword |
| stormshield.system | Indicator of the Firewalls system status. This value is used by the fleet management tool (Stormshield Network Unified Manager) to provide information on the system status (available RAM, CPU use, bandwidth, interfaces, fullness of audit logs, and so on). Decimal format representing a percentage. | keyword |
| stormshield.time | Local time at which the log was recorded in the log file (time configured on the Firewall). String in YYYY-MM-DD HH:MM:SS format. Available from: SNS v1.0.0. | keyword |
| tags | List of keywords used to tag each event. | keyword |
| url.domain | Domain of the url, such as "www.elastic.co". In some cases a URL may refer to an IP and/or port directly, without a domain name. In this case, the IP address would go to the domain field. If the URL contains a literal IPv6 address enclosed by [ and ] (IETF RFC 2732), the [ and ] characters should also be captured in the domain field. |
keyword |
| url.original | Unmodified original url as seen in the event source. Note that in network monitoring, the observed URL may be a full URL, whereas in access logs, the URL is often just represented as a path. This field is meant to represent the URL as it was observed, complete or not. | wildcard |
| url.original.text | Multi-field of url.original. |
match_only_text |
| user.name | Short name or login of the user. | keyword |
| user.name.text | Multi-field of user.name. |
match_only_text |
The following is a sample event for the log data stream:
Example
{
    "@timestamp": "2024-03-08T10:14:08.000Z",
    "agent": {
        "ephemeral_id": "19c5155e-5f61-4dc1-b23c-cd84e946b455",
        "id": "63ff8a64-ec88-4856-ba1c-8653054b4358",
        "name": "elastic-agent-17632",
        "type": "filebeat",
        "version": "9.4.3"
    },
    "data_stream": {
        "dataset": "stormshield.log",
        "namespace": "52256",
        "type": "logs"
    },
    "ecs": {
        "version": "8.17.0"
    },
    "elastic_agent": {
        "id": "63ff8a64-ec88-4856-ba1c-8653054b4358",
        "snapshot": false,
        "version": "9.4.3"
    },
    "event": {
        "agent_id_status": "verified",
        "category": [
            "configuration"
        ],
        "dataset": "stormshield.log",
        "ingested": "2026-07-08T10:05:22Z",
        "kind": "event",
        "original": "id=firewall time=\"2024-03-08 10:14:08\" fw=\"stormy-1\" tz=+0000 startime=\"2024-03-08 10:14:08\" error=0 user=\"admin\" address=192.168.197.1 sessionid=1 msg=\"PKI SEARCH scope=local type=ca\" logtype=\"server\"",
        "start": "2024-03-08T10:14:08.000Z",
        "timezone": "+00:00",
        "type": [
            "access"
        ]
    },
    "input": {
        "type": "tcp"
    },
    "log": {
        "source": {
            "address": "172.21.0.3:49430"
        },
        "syslog": {
            "appname": "serverd",
            "facility": {
                "code": 1,
                "name": "user-level"
            },
            "hostname": "stormy-1",
            "priority": 13,
            "severity": {
                "code": 5,
                "name": "Notice"
            },
            "version": "1"
        }
    },
    "message": "PKI SEARCH scope=local type=ca",
    "observer": {
        "name": "stormy-1",
        "type": "firewall",
        "vendor": "Stormshield"
    },
    "related": {
        "user": [
            "admin"
        ]
    },
    "stormshield": {
        "fw": "stormy-1",
        "logtype": "server",
        "metadata": {
            "address": "192.168.197.1",
            "error": "0",
            "id": "firewall",
            "sessionid": "1"
        },
        "startime": "2024-03-08 10:14:08",
        "time": "2024-03-08 10:14:08"
    },
    "tags": [
        "preserve_original_event",
        "forwarded"
    ],
    "user": {
        "name": "admin"
    }
}
You'll find additional details about Stormshield SNS logs in these official resources:
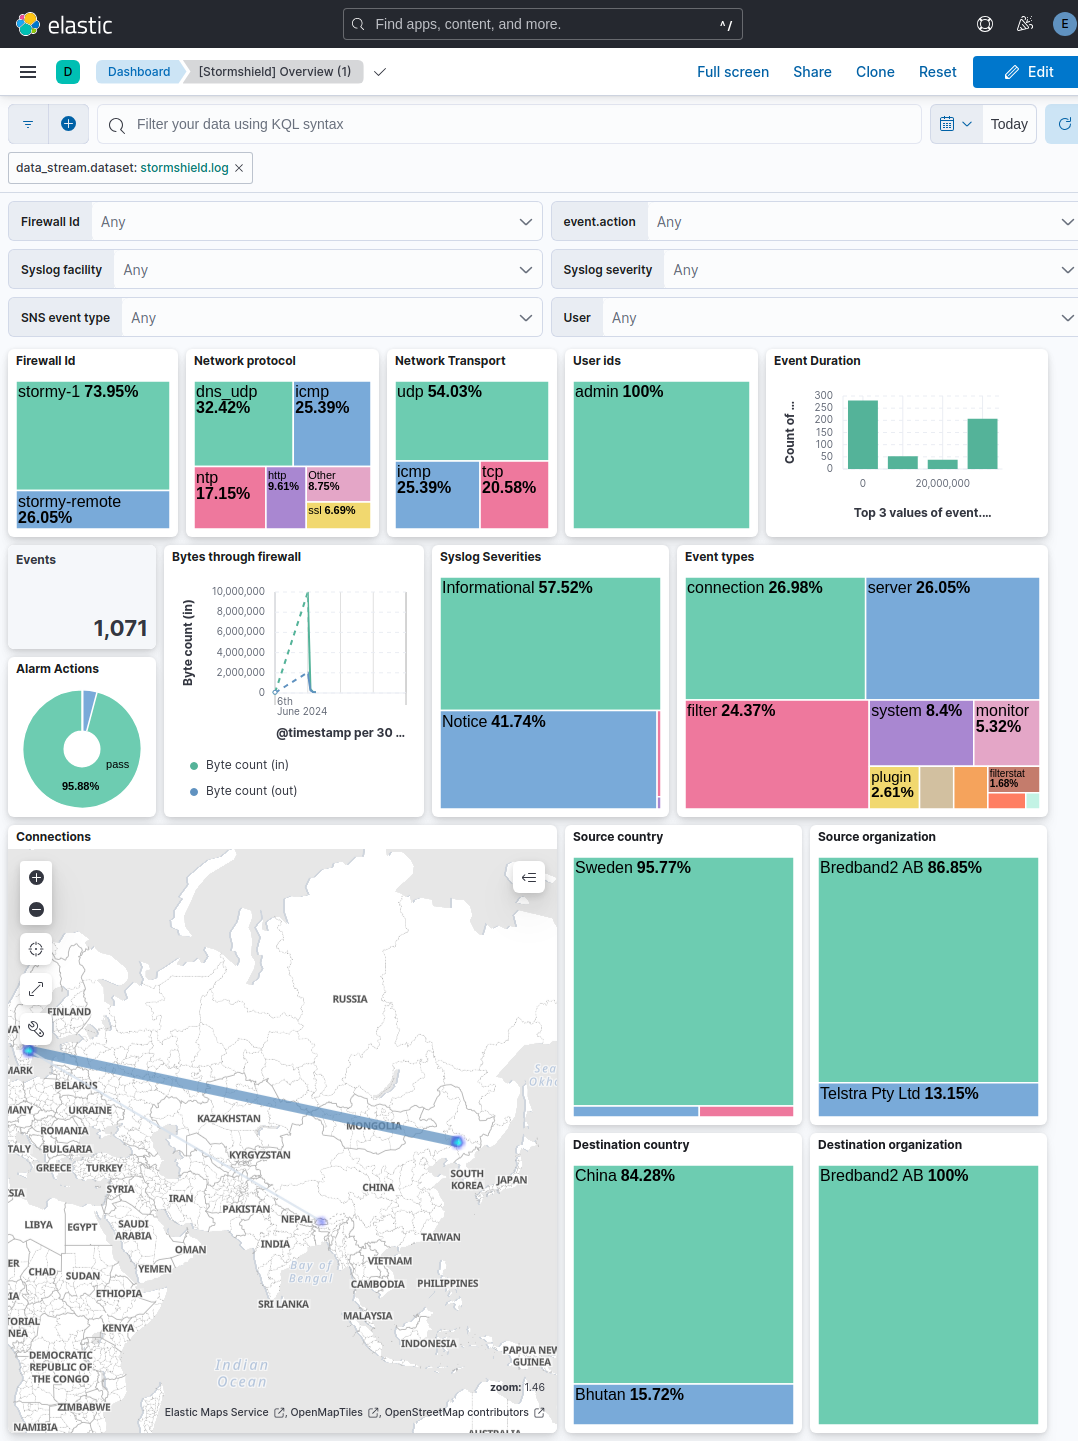
This integration includes one or more Kibana dashboards that visualizes the data collected by the integration. The screenshots below illustrate how the ingested data is displayed.

Changelog
| Version | Details | Minimum Kibana version |
|---|---|---|
| 1.6.1 | Bug fix (View pull request) Fix convert processor failures for source and destination IP fields when the vendor placeholder value 'unknown' is present in auth-type logs. |
9.0.0 8.11.4 |
| 1.6.0 | Enhancement (View pull request) Set ECS event categorization fields ( event.kind, event.category, event.type) for every log family, including event.kind metric for the periodic statistics families.Enhancement (View pull request) Map rcvd to destination.bytes, sum network.bytes, map interface fields to observer.ingress and observer.egress, compute network.direction, and populate related.hosts.Enhancement (View pull request) Map alarm identifiers and levels to event.code, event.risk_score and event.severity, and HTTP proxy fields to url.original and url.domain.Bug fix (View pull request) Fix the count sub-pipeline, which failed with a Painless runtime error on every count log, and skip malformed counters instead of failing the whole document. Enhancement (View pull request) Add an Alarms dashboard and pipeline test samples for the alarm, auth, web, vpn, xvpn, count and filter log families. |
9.0.0 8.11.4 |
| 1.5.3 | Bug fix (View pull request) Fix ingest pipeline descriptions and remove field definitions that never appear in events ( stormshield.tz, stormshield.duration, stormshield.msg, stormshield.origdst, stormshield.origdstport).Bug fix (View pull request) Correct the syslog format and SNS version compatibility statements in the documentation, and document IPFIX flow collection through the NetFlow integration. |
9.0.0 8.11.4 |
| 1.5.2 | Bug fix (View pull request) Remove top level note from docs |
9.0.0 8.11.4 |
| 1.5.1 | Enhancement (View pull request) Update documentation. |
9.0.0 8.11.4 |
| 1.5.0 | Enhancement (View pull request) Add service_info knowledge base documentation and improve README documentation. |
— |
| 1.4.0 | Enhancement (View pull request) Preserve event.original on pipeline error. |
9.0.0 8.11.4 |
| 1.3.2 | Enhancement (View pull request) Generate processor tags and normalize error handler. |
9.0.0 8.11.4 |
| 1.3.1 | Enhancement (View pull request) Changed owners. |
9.0.0 8.11.4 |
| 1.3.0 | Enhancement (View pull request) Allow @custom pipeline access to event.original without setting preserve_original_event. |
9.0.0 8.11.4 |
| 1.2.0 | Enhancement (View pull request) Support stack version 9.0. |
9.0.0 8.11.4 |
| 1.1.1 | Bug fix (View pull request) Updated SSL description to be uniform and to include links to documentation. |
8.11.4 |
| 1.1.0 | Enhancement (View pull request) ECS version updated to 8.17.0. |
8.11.4 |
| 1.0.1 | Bug fix (View pull request) Update links to getting started docs |
8.11.4 |
| 1.0.0 | Enhancement (View pull request) Fix timestamp handling and move stormshield.msg to message. Release integration as GA. |
8.11.4 |
| 0.1.0 | Enhancement (View pull request) Initial creation of the integration. |
8.11.4 |