Iru Integration for Elastic
| Version | 0.1.0
|
| Subscription level What's this? |
Basic |
| Developed by What's this? |
Elastic |
| Ingestion method(s) | API |
| Minimum Kibana version(s) | 9.1.0 8.19.0 |
To use pre-release integrations, go to the Integrations page in Kibana, scroll down, and toggle on the Display beta integrations option.
The Iru integration for Elastic collects console audit events and managed-device inventory from Iru Endpoint Management (formerly Kandji) via the Iru REST API.
This integration is compatible with Iru Endpoint Management API v1.
This integration periodically queries the Iru Endpoint Management REST API using a tenant Bearer token.
The Iru integration collects log messages of the following types:
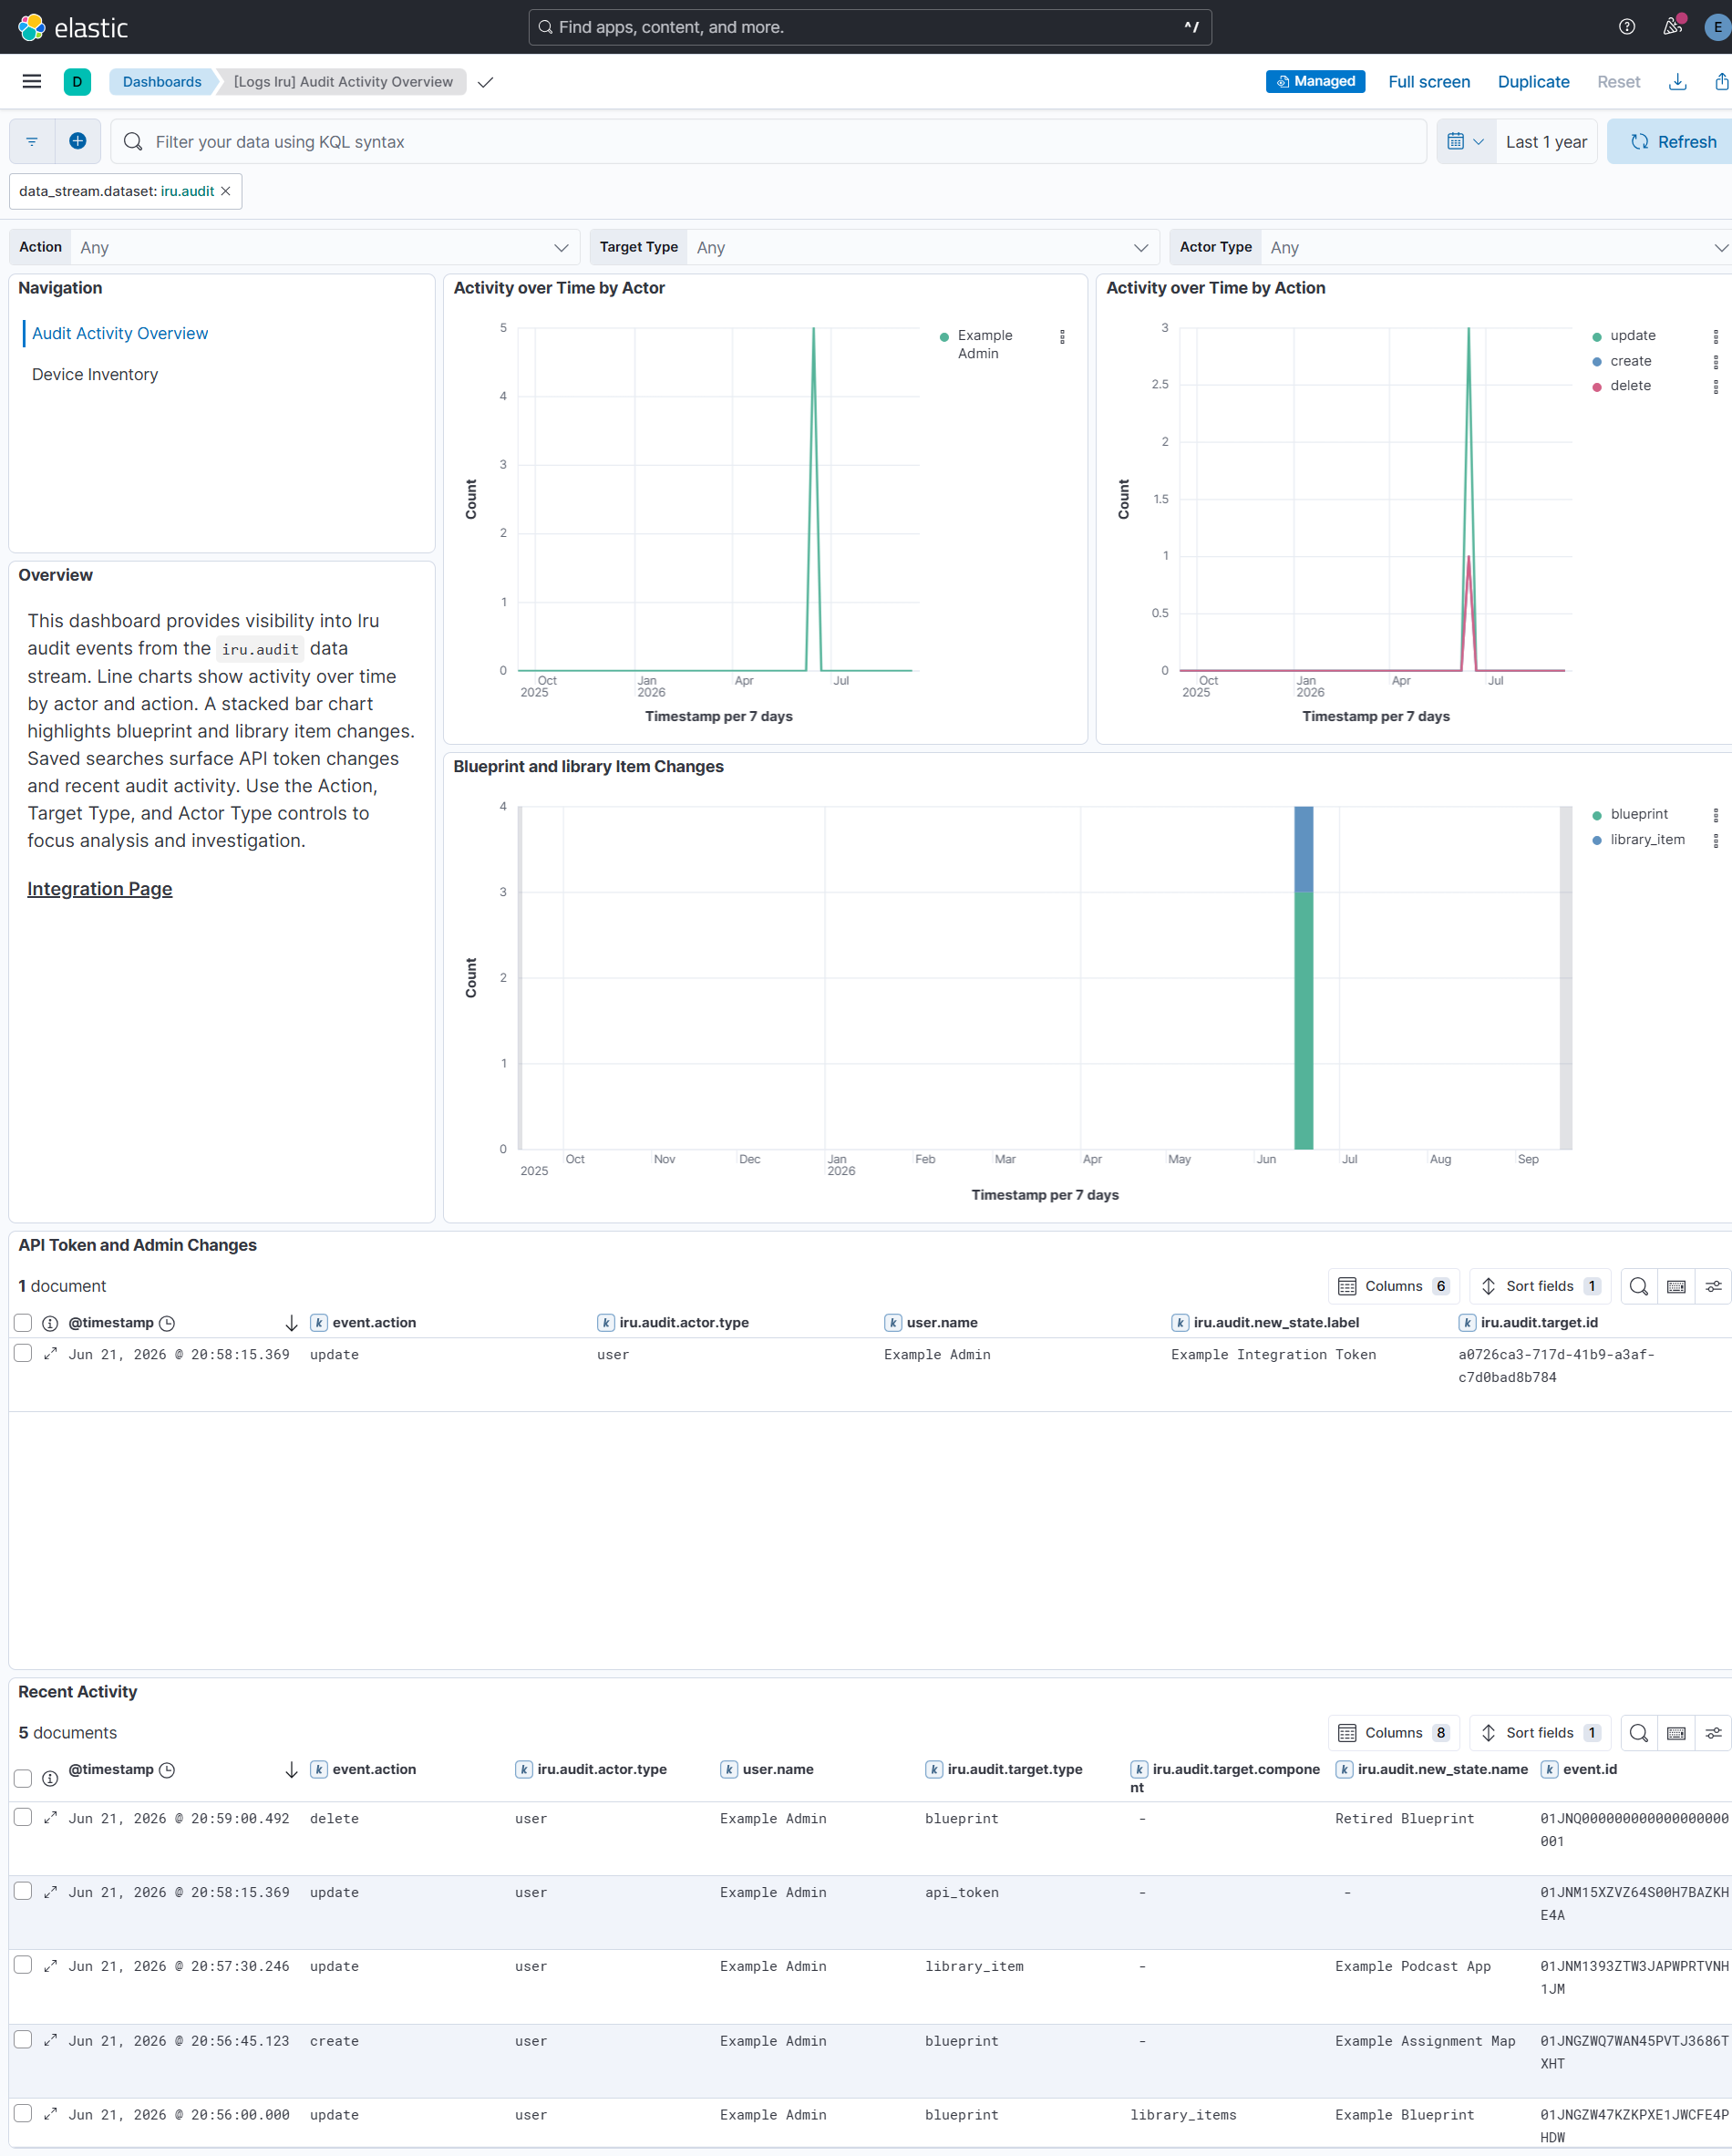
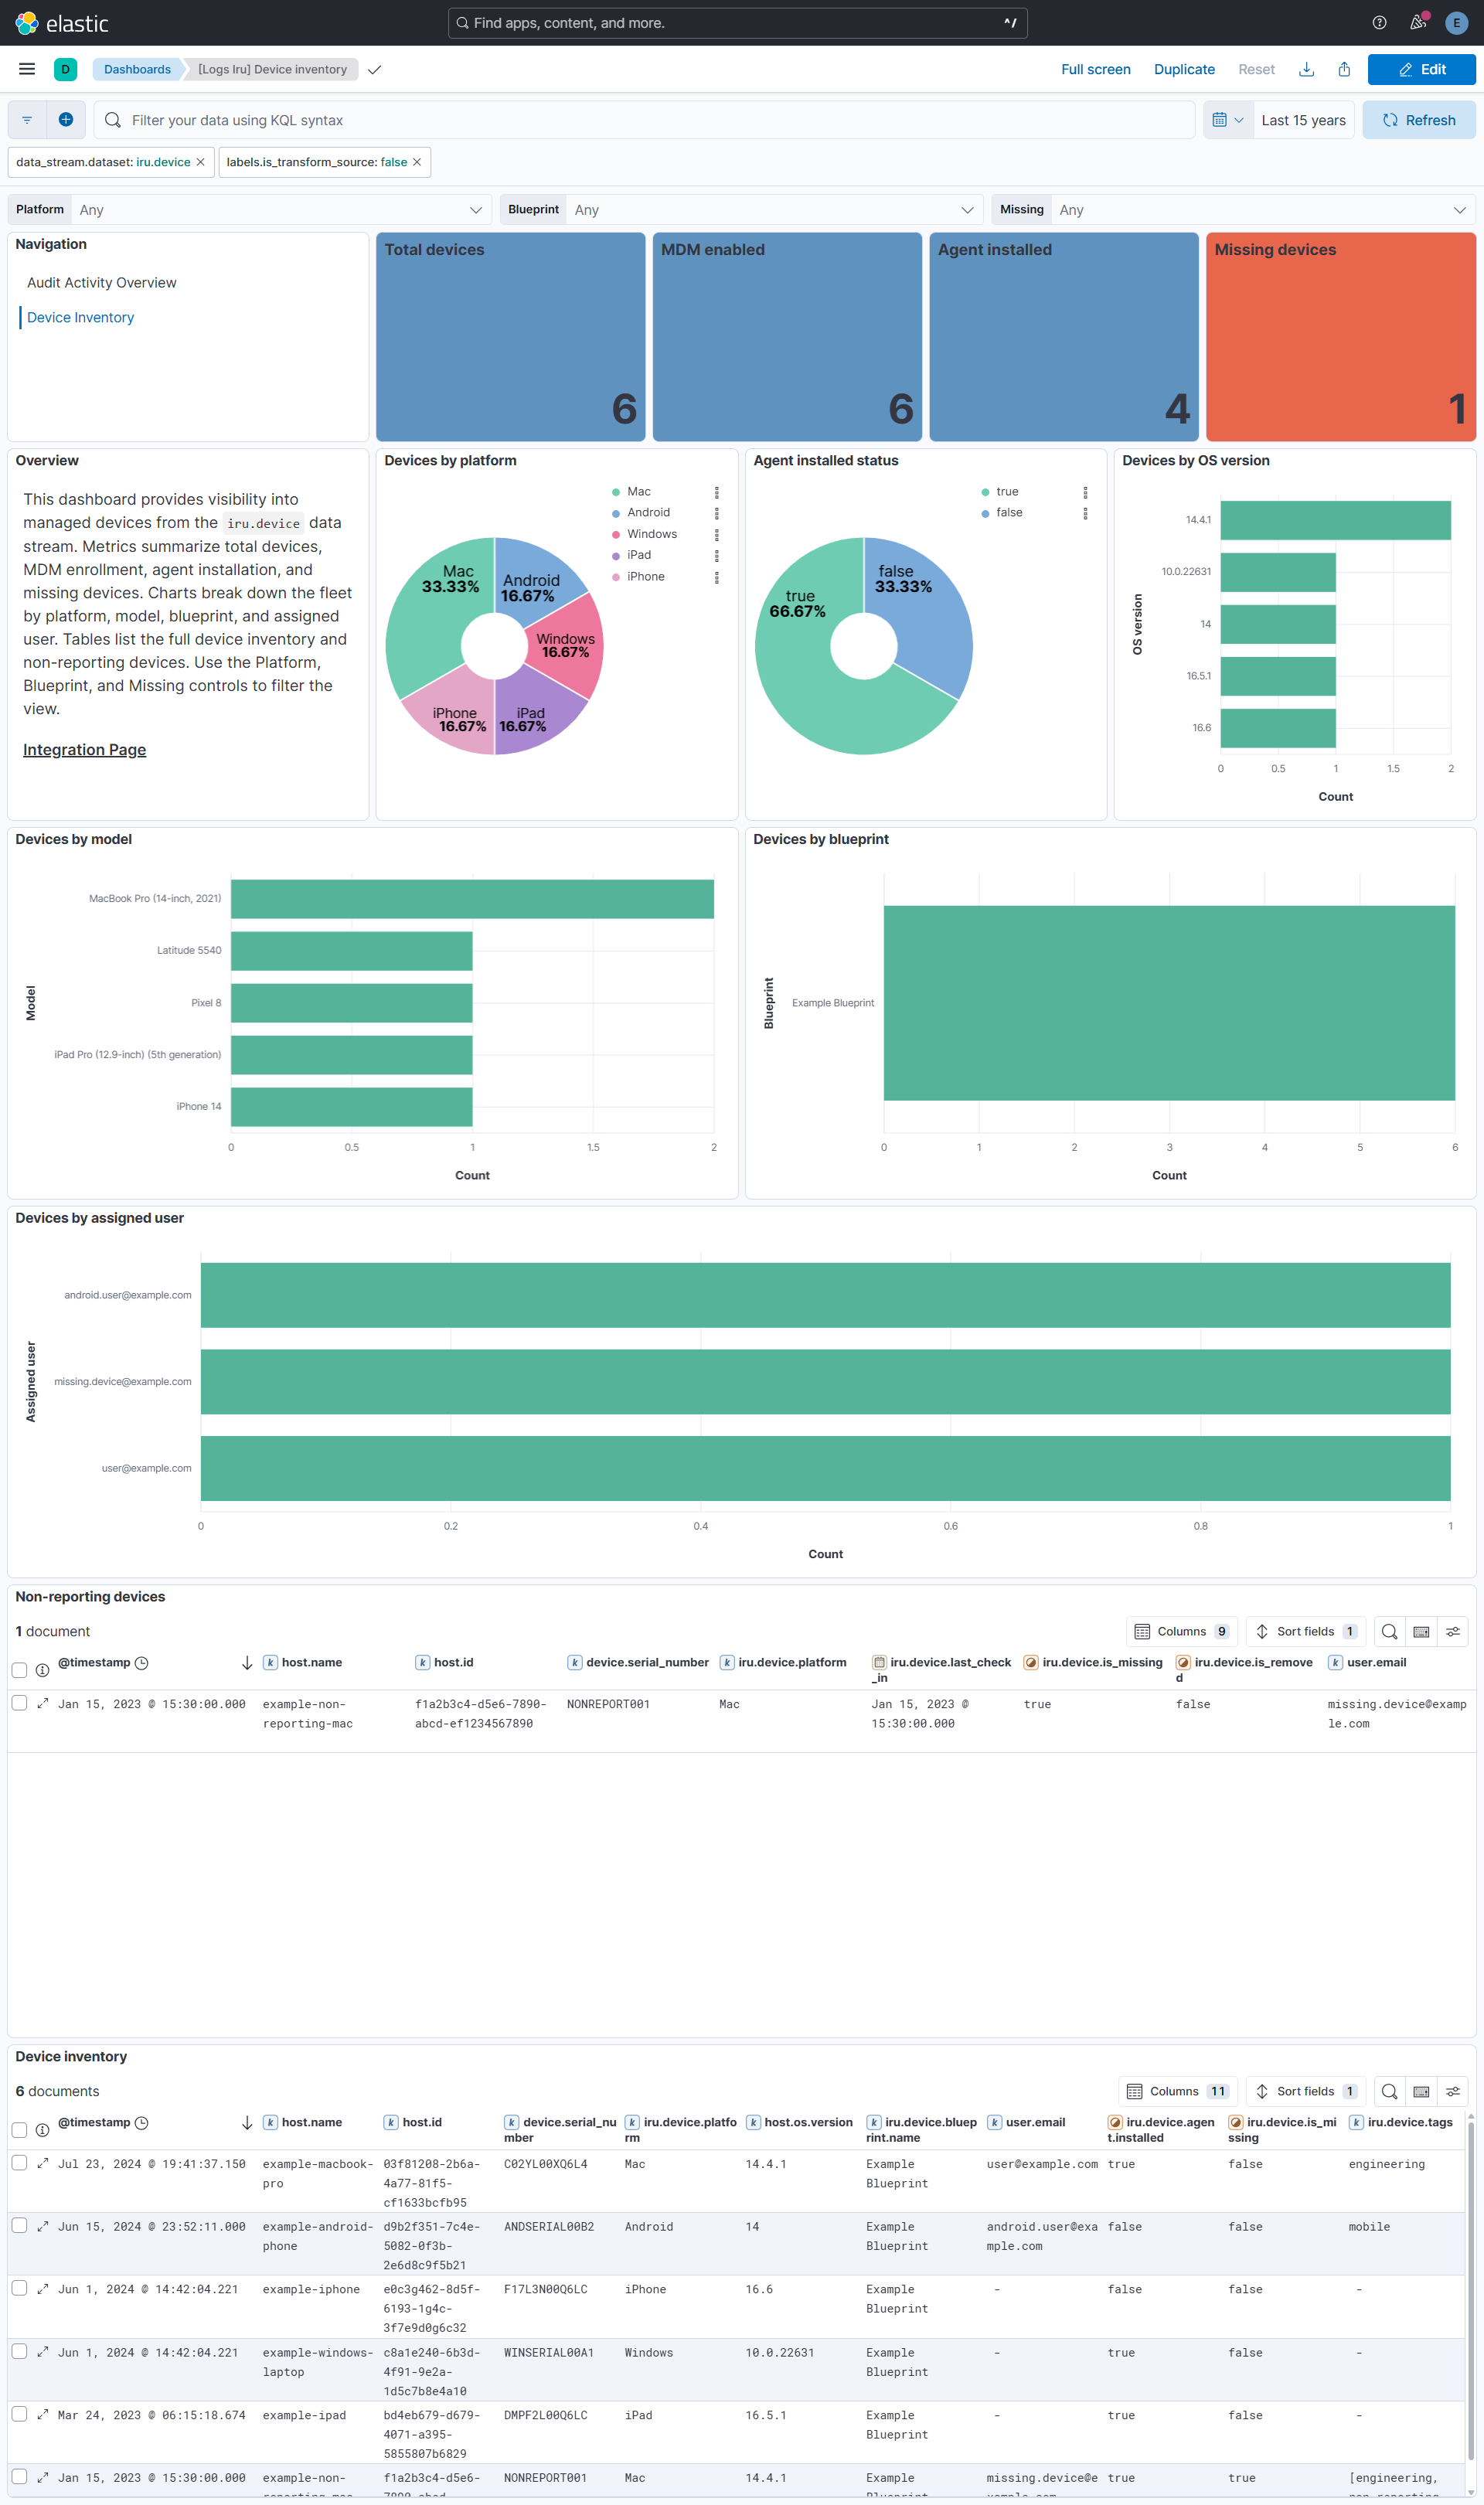
Audit: Tenant Activity events (blueprint and configuration changes, library item edits, API token administration, and other console actions).Device: Managed device inventory for Entity Analytics (platform, model, OS version, enrollment and agent status, last check-in, assigned user, blueprint, and tags).
Use audit events to monitor who changed device-management configuration, who managed API tokens, and how enrollment changed over time. Use device inventory to join Iru hosts with the same devices and users seen in other data sources, and to find stale or non-reporting devices.
You need an Iru Endpoint tenant with API access (Account Owner or Administrator). API access may need to be enabled by an Iru Customer Success Manager.
Create a dedicated API token in Account Menu → Access → API tokens and grant only:
- Devices: Device Information: Device list
- Audit Logs: List Audit Events
- Admins: List Tenant Admins
Copy Your organization's API URL from the same page.
- Sign in as Account Owner or Administrator.
- Open Account Menu → Access → API tokens.
- Note Your organization's API URL.
- Click Add Token, enter a name and description, and click Create.
- Copy the token immediately. It is shown only once.
- Configure permissions: enable Device list, List Audit Events, and List Tenant Admins. Do not grant lock, erase, or secrets permissions.
- Click Save.
- In Kibana, go to Management > Integrations.
- Search for Iru.
- Click Add Iru.
- Enter the API URL (
https://plus the hostname from Access). - Enter the API token.
- Enable the Audit and/or Device data streams and set their intervals.
- Click Save and continue.
- In Iru, confirm the token has Device list, List Audit Events, and List Tenant Admins permissions and that the tenant has recent Activity and enrolled devices.
- In Kibana Discover, search
data_stream.dataset: "iru.audit"anddata_stream.dataset: "iru.device".
- 401 Unauthorized: The token is incorrect, was revoked, or all permissions were removed. Create a new token in Access.
- Permission denied (
You do not have permission to perform this action.): Enable Device list and List Audit Events on the token. - API rate limit exceeded: The tenant shares a 10,000 requests per hour cap across all tokens. Increase the device interval (default 1h) and keep page sizes at the API maxima.
- No audit events: Confirm Activity exists in the Iru console for the lookback window (
Initial Interval). - No devices: Confirm the tenant has enrolled devices and the token includes Device list.
The Iru API allows 10,000 requests per hour per tenant, shared by every token. Prefer the default device page size of 300 and an interval of at least one hour. Do not enable per-device detail calls; the list endpoint is sufficient for inventory.
For more information on architectures that can be used for scaling this integration, check the Ingest Architectures documentation.
These inputs can be used with this integration:
cel
For more details about the CEL input settings, check the Filebeat documentation.
Before configuring the CEL input, make sure you have:
- Network connectivity to the target API endpoint
- Valid authentication credentials (API keys, tokens, or certificates as required)
- Appropriate permissions to read from the target data source
To configure the CEL input, you must specify the request.url value pointing to the API endpoint. The interval parameter controls how frequently requests are made and is the primary way to balance data freshness with API rate limits and costs. Authentication is often configured through the request.headers section using the appropriate method for the service.
To access the API service, make sure you have the necessary API credentials and that the Filebeat instance can reach the endpoint URL. Some services may require IP whitelisting or VPN access.
To collect logs via API endpoint, configure the following parameters:
- API Endpoint URL
- API credentials (tokens, keys, or username/password)
- Request interval (how often to fetch data)
These APIs are used with this integration:
- List audit events —
GET /api/v1/audit/events - List devices —
GET /api/v1/devices - List tenant admins —
GET /api/v1/admins
The audit data stream collects tenant Activity events from GET /api/v1/audit/events.
Exported fields
| Field | Description | Type |
|---|---|---|
| @timestamp | Event timestamp. | date |
| data_stream.dataset | Data stream dataset. | constant_keyword |
| data_stream.namespace | Data stream namespace. | constant_keyword |
| data_stream.type | Data stream type. | constant_keyword |
| event.dataset | Event dataset. | constant_keyword |
| event.module | Event module. | constant_keyword |
| input.type | Type of filebeat input. | keyword |
| iru.audit.actor.id | Unique identifier of the actor when the actor is not a user. | keyword |
| iru.audit.actor.type | Type of actor that performed the action (for example user or api_token). | keyword |
| iru.audit.admin.created_at | When the administrator account was created. | date |
| iru.audit.admin.email | Administrator email address. | keyword |
| iru.audit.admin.first_name | Administrator first name. | keyword |
| iru.audit.admin.id | Administrator identifier. | keyword |
| iru.audit.admin.is_active | Whether the administrator account is active. | boolean |
| iru.audit.admin.last_name | Administrator last name. | keyword |
| iru.audit.admin.locale | Administrator locale. | keyword |
| iru.audit.admin.role | Administrator role. | keyword |
| iru.audit.admin.updated_at | When the administrator account was last updated. | date |
| iru.audit.metadata | Additional context supplied by the API. | flattened |
| iru.audit.new_state.active | Whether the target is active. | boolean |
| iru.audit.new_state.description | Description of the target after the change. | keyword |
| iru.audit.new_state.label | Label of the target after the change. | keyword |
| iru.audit.new_state.library_items_added.id | Library item identifier. | keyword |
| iru.audit.new_state.library_items_added.name | Library item name. | keyword |
| iru.audit.new_state.library_items_removed.id | Library item identifier. | keyword |
| iru.audit.new_state.library_items_removed.name | Library item name. | keyword |
| iru.audit.new_state.library_items_scoped.id | Library item identifier. | keyword |
| iru.audit.new_state.library_items_scoped.name | Library item name. | keyword |
| iru.audit.new_state.name | Name of the target after the change. | keyword |
| iru.audit.new_state.parameters | Blueprint parameters after the change. | flattened |
| iru.audit.new_state.permissions.http_method | HTTP method granted to the token. | keyword |
| iru.audit.new_state.permissions.path | API path granted to the token. | keyword |
| iru.audit.new_state.type | Vendor type of the target (for example map or vpp-app). | keyword |
| iru.audit.target.component | Sub-section of the target. Empty when the whole object is the target. | keyword |
| iru.audit.target.id | Unique identifier of the object that was acted on. | keyword |
| iru.audit.target.type | Type of object that was acted on (for example blueprint, library_item, or api_token). | keyword |
| log.offset | Log offset. | long |
| observer.product | The product name of the observer. | constant_keyword |
| observer.vendor | Vendor name of the observer. | constant_keyword |
Example
{
    "@timestamp": "2025-03-04T16:29:55.253Z",
    "agent": {
        "ephemeral_id": "16869839-aa8a-4301-91a9-c71ab7c640b9",
        "id": "a281daf9-5083-47d2-b67f-c872804b4bdd",
        "name": "elastic-agent-71394",
        "type": "filebeat",
        "version": "8.19.2"
    },
    "data_stream": {
        "dataset": "iru.audit",
        "namespace": "87984",
        "type": "logs"
    },
    "ecs": {
        "version": "9.5.0"
    },
    "elastic_agent": {
        "id": "a281daf9-5083-47d2-b67f-c872804b4bdd",
        "snapshot": false,
        "version": "8.19.2"
    },
    "event": {
        "action": "update",
        "agent_id_status": "verified",
        "category": [
            "configuration"
        ],
        "dataset": "iru.audit",
        "id": "01JNGZW47KZKPXE1JWCFE4PHDW",
        "ingested": "2026-09-23T11:48:03Z",
        "kind": "event",
        "original": "{\"action\":\"update\",\"actor_id\":\"cf40d6e7-20cb-4da9-84a1-9ad0b7003ca5\",\"actor_type\":\"user\",\"admin\":{\"created_at\":\"2025-01-01T00:00:00.000000Z\",\"email\":\"admin@example.com\",\"first_name\":\"Example\",\"id\":\"cf40d6e7-20cb-4da9-84a1-9ad0b7003ca5\",\"is_active\":true,\"last_name\":\"Admin\",\"locale\":\"en_US\",\"role\":\"admin\",\"updated_at\":\"2025-01-01T00:00:00.000000Z\"},\"id\":\"01JNGZW47KZKPXE1JWCFE4PHDW\",\"metadata\":{},\"new_state\":{\"library_items_added\":[{\"id\":\"c7a5871a-1683-432f-87d4-30bbd404eb85\",\"name\":\"Example App\"}],\"library_items_removed\":[],\"library_items_scoped\":[{\"id\":\"c7a5871a-1683-432f-87d4-30bbd404eb85\",\"name\":\"Example App\"}],\"name\":\"Example Blueprint\"},\"occurred_at\":\"2025-03-04T16:29:55.253454Z\",\"target_component\":\"library_items\",\"target_id\":\"449ec92a-186a-44f2-9421-d5ac6e465eb5\",\"target_type\":\"blueprint\"}",
        "type": [
            "change"
        ]
    },
    "input": {
        "type": "cel"
    },
    "iru": {
        "audit": {
            "actor": {
                "type": "user"
            },
            "admin": {
                "created_at": "2025-01-01T00:00:00.000Z",
                "email": "admin@example.com",
                "first_name": "Example",
                "id": "cf40d6e7-20cb-4da9-84a1-9ad0b7003ca5",
                "is_active": true,
                "last_name": "Admin",
                "locale": "en_US",
                "role": "admin",
                "updated_at": "2025-01-01T00:00:00.000Z"
            },
            "new_state": {
                "library_items_added": [
                    {
                        "id": "c7a5871a-1683-432f-87d4-30bbd404eb85",
                        "name": "Example App"
                    }
                ],
                "library_items_scoped": [
                    {
                        "id": "c7a5871a-1683-432f-87d4-30bbd404eb85",
                        "name": "Example App"
                    }
                ],
                "name": "Example Blueprint"
            },
            "target": {
                "component": "library_items",
                "id": "449ec92a-186a-44f2-9421-d5ac6e465eb5",
                "type": "blueprint"
            }
        }
    },
    "observer": {
        "product": "Iru Endpoint",
        "vendor": "Iru"
    },
    "related": {
        "user": [
            "cf40d6e7-20cb-4da9-84a1-9ad0b7003ca5",
            "admin@example.com",
            "Example Admin"
        ]
    },
    "tags": [
        "preserve_original_event",
        "forwarded",
        "iru-audit"
    ],
    "user": {
        "email": "admin@example.com",
        "id": "cf40d6e7-20cb-4da9-84a1-9ad0b7003ca5",
        "name": "Example Admin"
    }
}
The device data stream collects managed device inventory from GET /api/v1/devices.
Exported fields
| Field | Description | Type |
|---|---|---|
| @timestamp | Event timestamp. | date |
| data_stream.dataset | Data stream dataset. | constant_keyword |
| data_stream.namespace | Data stream namespace. | constant_keyword |
| data_stream.type | Data stream type. | constant_keyword |
| device.serial_number | The unique serial number serves as a distinct identifier for each device, aiding in inventory management and device authentication. | keyword |
| ecs.version | ECS version this event conforms to. ecs.version is a required field and must exist in all events. When querying across multiple indices -- which may conform to slightly different ECS versions -- this field lets integrations adjust to the schema version of the events. |
keyword |
| entity.id | A unique identifier for the entity. When multiple identifiers exist, this should be the most stable and commonly used identifier that: 1) persists across the entity's lifecycle, 2) ensures uniqueness within its scope, 3) is commonly used for queries and correlation, and 4) is readily available in most observations (logs/events). For entities with dedicated field sets (for example, host, user), this value should match the corresponding *.id field. Alternative identifiers (for example, ARNs values in AWS, URLs) can be preserved in the raw field. | keyword |
| entity.last_seen_timestamp | Indicates the date/time when this entity was last "seen," usually based upon the last event/log that is initiated by this entity. | date |
| entity.name | The name of the entity. The keyword field enables exact matches for filtering and aggregations, while the text field enables full-text search. For entities with dedicated field sets (for example, host), this field should mirrors the corresponding *.name value. |
keyword |
| entity.name.text | Multi-field of entity.name. |
match_only_text |
| entity.source | The module or integration that provided this entity data (similar to event.module). | keyword |
| entity.type | A standardized high-level classification of the entity. This provides a normalized way to group similar entities across different providers or systems. Example values: bucket, database, container, function, queue, host, user, application, session, cloud, orchestrator, etc. If an entity is nested under a top-level namespace like host or cloud, or similar, its type array should include the matching value — for example, host or cloud. |
keyword |
| error.message | Error message. | match_only_text |
| event.category | This is one of four ECS Categorization Fields, and indicates the second level in the ECS category hierarchy. event.category represents the "big buckets" of ECS categories. For example, filtering on event.category:process yields all events relating to process activity. This field is closely related to event.type, which is used as a subcategory. This field is an array. This will allow proper categorization of some events that fall in multiple categories. |
keyword |
| event.dataset | Event dataset. | constant_keyword |
| event.kind | This is one of four ECS Categorization Fields, and indicates the highest level in the ECS category hierarchy. event.kind gives high-level information about what type of information the event contains, without being specific to the contents of the event. For example, values of this field distinguish alert events from metric events. The value of this field can be used to inform how these kinds of events should be handled. They may warrant different retention, different access control, it may also help understand whether the data is coming in at a regular interval or not. |
keyword |
| event.module | Event module. | constant_keyword |
| event.original | Raw text message of entire event. Used to demonstrate log integrity or where the full log message (before splitting it up in multiple parts) may be required, e.g. for reindex. This field is not indexed and doc_values are disabled. It cannot be searched, but it can be retrieved from _source. If users wish to override this and index this field, please see Field data types in the Elasticsearch Reference. |
keyword |
| event.type | This is one of four ECS Categorization Fields, and indicates the third level in the ECS category hierarchy. event.type represents a categorization "sub-bucket" that, when used along with the event.category field values, enables filtering events down to a level appropriate for single visualization. This field is an array. This will allow proper categorization of some events that fall in multiple event types. |
keyword |
| host.hostname | Hostname of the host. It normally contains what the hostname command returns on the host machine. |
keyword |
| host.id | Unique host id. As hostname is not always unique, use values that are meaningful in your environment. Example: The current usage of beat.name. |
keyword |
| host.name | Name of the host. It can contain what hostname returns on Unix systems, the fully qualified domain name (FQDN), or a name specified by the user. The recommended value is the lowercase FQDN of the host. | keyword |
| host.os.platform | Operating system platform (such centos, ubuntu, windows). | keyword |
| host.os.type | Use the os.type field to categorize the operating system into one of the broad commercial families. If the OS you're dealing with is not listed as an expected value, the field should not be populated. Please let us know by opening an issue with ECS, to propose its addition. |
keyword |
| host.os.version | Operating system version as a raw string. | keyword |
| input.type | Type of filebeat input. | keyword |
| iru.device.agent.installed | Whether the Iru agent is installed on the device. | boolean |
| iru.device.agent.version | Installed Iru agent version. | keyword |
| iru.device.asset_tag | Asset tag assigned to the device. | keyword |
| iru.device.blueprint.id | Unique identifier of the assigned blueprint. | keyword |
| iru.device.blueprint.name | Name of the assigned blueprint. | keyword |
| iru.device.device_id | Unique identifier of the device in Iru. | keyword |
| iru.device.first_enrollment | Timestamp of the device's first enrollment. | date |
| iru.device.is_missing | Whether the device is missing or not checking in. | boolean |
| iru.device.is_removed | Whether the device has been removed from Iru. | boolean |
| iru.device.last_check_in | Timestamp of the device's last check-in. | date |
| iru.device.last_enrollment | Timestamp of the device's most recent enrollment. | date |
| iru.device.lost_mode_status | Lost Mode status reported by Iru. | keyword |
| iru.device.mdm_enabled | Whether MDM management is enabled for the device. | boolean |
| iru.device.model | Marketing model name of the device. | keyword |
| iru.device.platform | Vendor platform string (for example Mac, iPad, iPhone, Windows, or Android). | keyword |
| iru.device.serial_number | Hardware serial number of the device. | keyword |
| iru.device.supplemental_build_version | Supplemental OS build version supplied by Iru. | keyword |
| iru.device.supplemental_os_version_extra | Additional OS version metadata supplied by Iru. | keyword |
| iru.device.tags | Tag names assigned to the device. | keyword |
| iru.device.user.active | Whether the assigned directory user is active. | boolean |
| iru.device.user.is_archived | Whether the assigned directory user is archived. | boolean |
| labels.is_transform_source | Distinguishes between documents that are a source for a transform and documents that are an output of a transform, to facilitate easier filtering. | constant_keyword |
| log.offset | Log offset. | long |
| observer.product | The product name of the observer. | constant_keyword |
| observer.vendor | Vendor name of the observer. | constant_keyword |
| related.hosts | All hostnames or other host identifiers seen on your event. Example identifiers include FQDNs, domain names, workstation names, or aliases. | keyword |
| related.user | All the user names or other user identifiers seen on the event. | keyword |
| tags | List of keywords used to tag each event. | keyword |
| user.email | User email address. | keyword |
| user.full_name | User's full name, if available. | keyword |
| user.full_name.text | Multi-field of user.full_name. |
match_only_text |
| user.id | Unique identifier of the user. | keyword |
| user.name | Short name or login of the user. | keyword |
| user.name.text | Multi-field of user.name. |
match_only_text |
Example
{
    "@timestamp": "2023-03-24T00:45:18.674Z",
    "agent": {
        "ephemeral_id": "71dece63-5d28-4de5-a2b2-537d7d323780",
        "id": "1e5428d3-c86f-4a99-bbd8-7960c0e2f26a",
        "name": "elastic-agent-51935",
        "type": "filebeat",
        "version": "8.19.2"
    },
    "data_stream": {
        "dataset": "iru.device",
        "namespace": "72450",
        "type": "logs"
    },
    "device": {
        "serial_number": "DMPF2L00Q6LC"
    },
    "ecs": {
        "version": "9.5.0"
    },
    "elastic_agent": {
        "id": "1e5428d3-c86f-4a99-bbd8-7960c0e2f26a",
        "snapshot": false,
        "version": "8.19.2"
    },
    "entity": {
        "id": "bd4eb679-d679-4071-a395-5855807b6829",
        "last_seen_timestamp": "2023-03-24T00:45:18.674Z",
        "name": "example-ipad",
        "source": "iru",
        "type": [
            "host"
        ]
    },
    "event": {
        "agent_id_status": "verified",
        "category": [
            "host"
        ],
        "dataset": "iru.device",
        "ingested": "2026-09-23T11:50:55Z",
        "kind": "asset",
        "original": "{\"agent_installed\":true,\"agent_version\":\"4.1.3 (3795)\",\"asset_tag\":\"\",\"blueprint_id\":\"97e4e175-1631-43f6-a02b-33fd1c748ab8\",\"blueprint_name\":\"Example Blueprint\",\"device_id\":\"bd4eb679-d679-4071-a395-5855807b6829\",\"device_name\":\"example-ipad\",\"first_enrollment\":\"2022-07-21 15:00:06.470889+00:00\",\"is_missing\":false,\"is_removed\":false,\"last_check_in\":\"2023-03-24T00:45:18.674561Z\",\"last_enrollment\":\"2023-03-13 17:29:41.167646+00:00\",\"lost_mode_status\":\"\",\"mdm_enabled\":true,\"model\":\"iPad Pro (12.9-inch) (5th generation)\",\"os_version\":\"16.5.1\",\"platform\":\"iPad\",\"serial_number\":\"DMPF2L00Q6LC\",\"tags\":[],\"user\":\"\"}",
        "type": [
            "info"
        ]
    },
    "host": {
        "hostname": "example-ipad",
        "id": "bd4eb679-d679-4071-a395-5855807b6829",
        "name": "example-ipad",
        "os": {
            "platform": "iPad",
            "type": "ios",
            "version": "16.5.1"
        }
    },
    "input": {
        "type": "cel"
    },
    "iru": {
        "device": {
            "agent": {
                "installed": true,
                "version": "4.1.3 (3795)"
            },
            "blueprint": {
                "id": "97e4e175-1631-43f6-a02b-33fd1c748ab8",
                "name": "Example Blueprint"
            },
            "device_id": "bd4eb679-d679-4071-a395-5855807b6829",
            "first_enrollment": "2022-07-21T15:00:06.470Z",
            "is_missing": false,
            "is_removed": false,
            "last_check_in": "2023-03-24T00:45:18.674Z",
            "last_enrollment": "2023-03-13T17:29:41.167Z",
            "mdm_enabled": true,
            "model": "iPad Pro (12.9-inch) (5th generation)",
            "platform": "iPad",
            "serial_number": "DMPF2L00Q6LC"
        }
    },
    "observer": {
        "product": "Iru Endpoint",
        "vendor": "Iru"
    },
    "related": {
        "hosts": [
            "bd4eb679-d679-4071-a395-5855807b6829",
            "example-ipad",
            "DMPF2L00Q6LC"
        ]
    },
    "tags": [
        "preserve_original_event",
        "forwarded",
        "iru-device"
    ]
}
This integration includes one or more Kibana dashboards that visualizes the data collected by the integration. The screenshots below illustrate how the ingested data is displayed.
Changelog
| Version | Details | Minimum Kibana version |
|---|---|---|
| 0.1.0 | Enhancement (View pull request) Initial release. |
9.1.0 8.19.0 |