Nvidia GPU Monitoring
| Version | 0.4.1
|
| Subscription level What's this? |
Basic |
| Developed by What's this? |
Elastic |
| Ingestion method(s) | Prometheus |
| Minimum Kibana version(s) | 9.0.0 8.16.0 |
To use beta integrations, go to the Integrations page in Kibana, scroll down, and toggle on the Display beta integrations option.
Use the NVIDIA GPU Monitoring integration to monitor the health and performance of your NVIDIA GPUs. The integration collects metrics from the NVIDIA Datacenter GPU Manager and sends them to Elasticsearch.
You need Elasticsearch for storing and searching your data and Kibana for visualizing and managing it. You can use our hosted Elasticsearch Service on Elastic Cloud, which is recommended, or self-manage the Elastic Stack on your own hardware.
You need the NVIDIA Datacenter GPU Manager (DCGM) installed on your system (or exposed via a docker container with the GPU device mounted) to collect metrics from the NVIDIA GPUs. You can download the DCGM from the NVIDIA website. By default the DCGM exporter does not expose all available metrics, to customize the list of available metrics, a csv file with the desired metrics is required. For instructions on how to do this, review the dcgm-exporter documentation.
If DCGM Exporter is configured to provide enrichment of Kubernetes data, the pod, namespace, and container information will be attached to the corresponding metrics. This is useful for monitoring and attributing GPU usage in Kubernetes environments.
This integration has been tested with version 3.3.9 of the DCGM exporter.
For step-by-step instructions on how to set up an integration, see the Getting started guide.
When running on Kubernetes, you can use ${env.NODE_NAME} to get the node name for use in the hosts field. For example: hosts: http://${env.NODE_NAME}:9400/metrics.
With dcgm-exporter you can configure which fields are collected by specifying a custom CSV file.
You will find the default CSV file under etc/default-counters.csv in the repository, which is copied on your system or container to /etc/dcgm-exporter/default-counters.csv
The layout and format of this file is as follows:
# Format
# If line starts with a '#' it is considered a comment
# DCGM FIELD, Prometheus metric type, help message

# Clocks
DCGM_FI_DEV_SM_CLOCK,  gauge, SM clock frequency (in MHz).
DCGM_FI_DEV_MEM_CLOCK, gauge, Memory clock frequency (in MHz).
A custom csv file can be specified using the -f option or --collectors as follows:
dcgm-exporter -f /tmp/custom-collectors.csv
See more in the DCGM Github Repository
stats give you insight into the state of the NVIDIA GPUs.
Metric data streams collected by the Nvidia GPU Monitoring integration include stats. See more details in the Metrics.
Example
{
    "@timestamp": "2025-06-24T05:16:10.082Z",
    "agent": {
        "ephemeral_id": "158b1ab5-1d8f-40df-a960-73d24cffa507",
        "id": "c509a40e-38fb-4be5-8e70-ba382ce8eff0",
        "name": "elastic-agent-58660",
        "type": "metricbeat",
        "version": "8.17.0"
    },
    "data_stream": {
        "dataset": "nvidia_gpu.stats",
        "namespace": "52265",
        "type": "metrics"
    },
    "ecs": {
        "version": "8.17.0"
    },
    "elastic_agent": {
        "id": "c509a40e-38fb-4be5-8e70-ba382ce8eff0",
        "snapshot": false,
        "version": "8.17.0"
    },
    "event": {
        "agent_id_status": "verified",
        "dataset": "nvidia_gpu.stats",
        "duration": 3737970,
        "ingested": "2025-06-24T05:16:13Z",
        "module": "prometheus"
    },
    "gpu": {
        "clock": {
            "mem_frequency": 405,
            "streaming_multiprocessor_frequency": 300
        },
        "labels": {
            "device": "nvidia0",
            "driver_version": "525.105.17",
            "gpu": "0",
            "hostname": "924e17218b6f",
            "job": "prometheus",
            "model_name": "Tesla T4",
            "pci_bus_id": "00000000:00:04.0",
            "uuid": "GPU-2492e3fa-2252-1730-0d1a-8d12ab32cdf0"
        },
        "license_vgpu_status": 0,
        "memory": {
            "framebuffer": {
                "free_size": 14923,
                "used_size": 5
            }
        },
        "nvlink": {
            "bandwidth_total": 0
        },
        "pcie": {
            "replay": 0
        },
        "power": {
            "energy_consumption_total": 27649212030,
            "usage": 12.239
        },
        "temperature": {
            "gpu": 36,
            "memory": 0
        },
        "utilization": {
            "decoder": {
                "pct": 0
            },
            "encoder": {
                "pct": 0
            },
            "gpu": {
                "pct": 0
            },
            "memory_copy": {
                "pct": 0
            }
        }
    },
    "host": {
        "architecture": "x86_64",
        "containerized": true,
        "hostname": "elastic-agent-58660",
        "ip": [
            "172.18.0.7",
            "192.168.32.2"
        ],
        "mac": [
            "A6-27-18-C5-0D-F0",
            "EA-10-B8-A2-8C-94"
        ],
        "name": "elastic-agent-58660",
        "os": {
            "family": "",
            "kernel": "5.15.153.1-microsoft-standard-WSL2",
            "name": "Wolfi",
            "platform": "wolfi",
            "type": "linux",
            "version": "20230201"
        }
    },
    "metricset": {
        "name": "collector",
        "period": 10000
    },
    "server": {
        "address": "svc-nvidia_gpu:9400"
    },
    "service": {
        "address": "http://svc-nvidia_gpu:9400/metrics",
        "type": "prometheus"
    }
}
Exported fields
| Field | Description | Type | Unit | Metric Type |
|---|---|---|---|---|
| @timestamp | Event timestamp. | date | ||
| agent.id | Unique identifier of this agent (if one exists). Example: For Beats this would be beat.id. | keyword | ||
| cloud.account.id | The cloud account or organization id used to identify different entities in a multi-tenant environment. Examples: AWS account id, Google Cloud ORG Id, or other unique identifier. | keyword | ||
| cloud.availability_zone | Availability zone in which this host, resource, or service is located. | keyword | ||
| cloud.instance.id | Instance ID of the host machine. | keyword | ||
| cloud.provider | Name of the cloud provider. Example values are aws, azure, gcp, or digitalocean. | keyword | ||
| cloud.region | Region in which this host, resource, or service is located. | keyword | ||
| container.id | Unique container id. | keyword | ||
| data_stream.dataset | Data stream dataset. | constant_keyword | ||
| data_stream.namespace | Data stream namespace. | constant_keyword | ||
| data_stream.type | Data stream type. | constant_keyword | ||
| gpu.clock.mem_frequency | Memory clock frequency (in MHz). | float | gauge | |
| gpu.clock.streaming_multiprocessor_frequency | SM clock frequency (in MHz). | float | gauge | |
| gpu.dcp.dram.active | Ratio of cycles the device memory interface is active sending or receiving data. | float | gauge | |
| gpu.dcp.fp16_pipe.active | Ratio of cycles the fp16 pipes that are active. | float | gauge | |
| gpu.dcp.fp32_pipe.active | Ratio of cycles the fp32 pipes that are active. | float | gauge | |
| gpu.dcp.fp64_pipe.active | Ratio of cycles the fp64 pipes that are active. | float | gauge | |
| gpu.dcp.graphics_engine.active | Ratio of time the graphics engine is active. | float | gauge | |
| gpu.dcp.sm.active | The ratio of cycles an SM has at least one warp assigned. | float | gauge | |
| gpu.dcp.sm.occupancy | The ratio of number of warps resident on an SM. | float | gauge | |
| gpu.dcp.tensor_pipe.active | Ratio of cycles the tensor (HMMA) pipe is active. | float | gauge | |
| gpu.device.brand | Brand of the GPU device. | keyword | ||
| gpu.device.ecc_info_rom_version | ECC inforom version | keyword | ||
| gpu.device.power_info_rom_version | Power management object inforom version | keyword | ||
| gpu.device.serial_number | Device Serial Number | keyword | ||
| gpu.device.vbios_version | VBIOS version of the device | keyword | ||
| gpu.ecc.double_bit_persistent.count | Double-bit persistent errors count for GPU memory. | long | counter | |
| gpu.ecc.double_bit_volatile.count | Double-bit volatile errors count for GPU memory. | long | counter | |
| gpu.ecc.single_bit_persistent.count | Single-bit persistent errors count for GPU memory. | long | counter | |
| gpu.ecc.single_bit_volatile.count | Single-bit volatile errors count for GPU memory. | long | counter | |
| gpu.error.xid | The eXerience ID of the error being reported by the GPU. | float | gauge | |
| gpu.labels.device | Nvidia GPU device name | keyword | ||
| gpu.labels.driver_version | Nvidia GPU Driver version | keyword | ||
| gpu.labels.err_code | Nvidia GPU error code | keyword | ||
| gpu.labels.err_msg | Nvidia GPU error message | keyword | ||
| gpu.labels.gpu | Nvidia GPU | keyword | ||
| gpu.labels.hostname | Nvidia GPU hostname | keyword | ||
| gpu.labels.job | Nvidia GPU job | keyword | ||
| gpu.labels.model_name | Nvidia GPU model name | keyword | ||
| gpu.labels.pci_bus_id | Nvidia GPU pci bus id | keyword | ||
| gpu.labels.uuid | Nvidia GPU UUID | keyword | ||
| gpu.license_vgpu_status | vGPU License status. | long | gauge | |
| gpu.memory.framebuffer.free_size | Free size of the framebuffer (in MiB). | float | gauge | |
| gpu.memory.framebuffer.used_size | Used size of the framebuffer (in MiB). | float | gauge | |
| gpu.nvlink.bandwidth_l0_total | The number of bytes of active NVLink rx or tx data including both header and payload. | long | counter | |
| gpu.nvlink.bandwidth_total | Total number of NVLink bandwidth counters for all lanes. | long | counter | |
| gpu.nvlink.data_crc_errors.count | Total number of NVLink data CRC errors. | long | counter | |
| gpu.nvlink.flowcontrol_crc_errors.count | Total number of NVLink flow-control CRC errors. | long | counter | |
| gpu.nvlink.recovery_errors.count | Total number of NVLink recovery errors. | long | counter | |
| gpu.nvlink.replay_errors.count | Total number of NVLink retries. | long | counter | |
| gpu.pcie.replay | Replay counter for the PCIe connection. | long | counter | |
| gpu.pcie.rx_bytes | Total number of bytes received through PCIe RX via NVML. | long | byte | counter |
| gpu.pcie.tx_bytes | Total number of bytes transmitted through PCIe TX via NVML. | long | byte | counter |
| gpu.power.energy_consumption_total | Total energy consumption since boot (in mJ). | long | counter | |
| gpu.power.usage | Current power usage of the GPU in Watts. | float | gauge | |
| gpu.remapped.correctable_remapped_rows.count | Number of remapped rows for correctable errors | long | counter | |
| gpu.remapped.failed_remapped_rows.count | Whether remapping of rows has failed | long | gauge | |
| gpu.remapped.uncorrectable_remapped_rows.count | Number of remapped rows for uncorrectable errors | long | counter | |
| gpu.retired.double_bit_errors.count | Total number of retired pages due to double-bit errors. | long | counter | |
| gpu.retired.pending.count | Total number of pages pending retirement. | long | counter | |
| gpu.retired.single_bit_errors.count | Total number of retired pages due to single-bit errors. | long | counter | |
| gpu.temperature.gpu | GPU temperature (in C). | float | gauge | |
| gpu.temperature.memory | Memory temperature (in C). | float | gauge | |
| gpu.throttling.board_limit.us | Number of microseconds throttled due to Board limit. | long | counter | |
| gpu.throttling.low_utilization.us | Number of microseconds throttled due to low utilization. | long | counter | |
| gpu.throttling.power.us | Number of microseconds throttled due to power. | long | counter | |
| gpu.throttling.reliability.us | Number of microseconds throttled due to reliability. | long | counter | |
| gpu.throttling.sync_boost.us | Number of microseconds throttled due to Sync Boost. | long | counter | |
| gpu.throttling.thermal.us | Number of microseconds throttled due to thermals. | long | counter | |
| gpu.up | Fields related to Prometheus up data. |
keyword | ||
| gpu.utilization.decoder.pct | Decoder utilization (in %). | float | percent | gauge |
| gpu.utilization.encoder.pct | Encoder utilization (in %). | float | percent | gauge |
| gpu.utilization.gpu.pct | GPU utilization (in %). | float | percent | gauge |
| gpu.utilization.memory_copy.pct | Memory utilization (in %). | float | percent | gauge |
| host.name | Name of the host. It can contain what hostname returns on Unix systems, the fully qualified domain name (FQDN), or a name specified by the user. The recommended value is the lowercase FQDN of the host. | keyword | ||
| kubernetes.container.name | Kubernetes container name | keyword | ||
| kubernetes.namespace | Kubernetes namespace | keyword | ||
| kubernetes.pod.name | Kubernetes pod name | keyword | ||
| service.address | Address where data about this service was collected from. This should be a URI, network address (ipv4:port or [ipv6]:port) or a resource path (sockets). | keyword | ||
| service.type | The type of the service data is collected from. The type can be used to group and correlate logs and metrics from one service type. Example: If logs or metrics are collected from Elasticsearch, service.type would be elasticsearch. |
keyword |
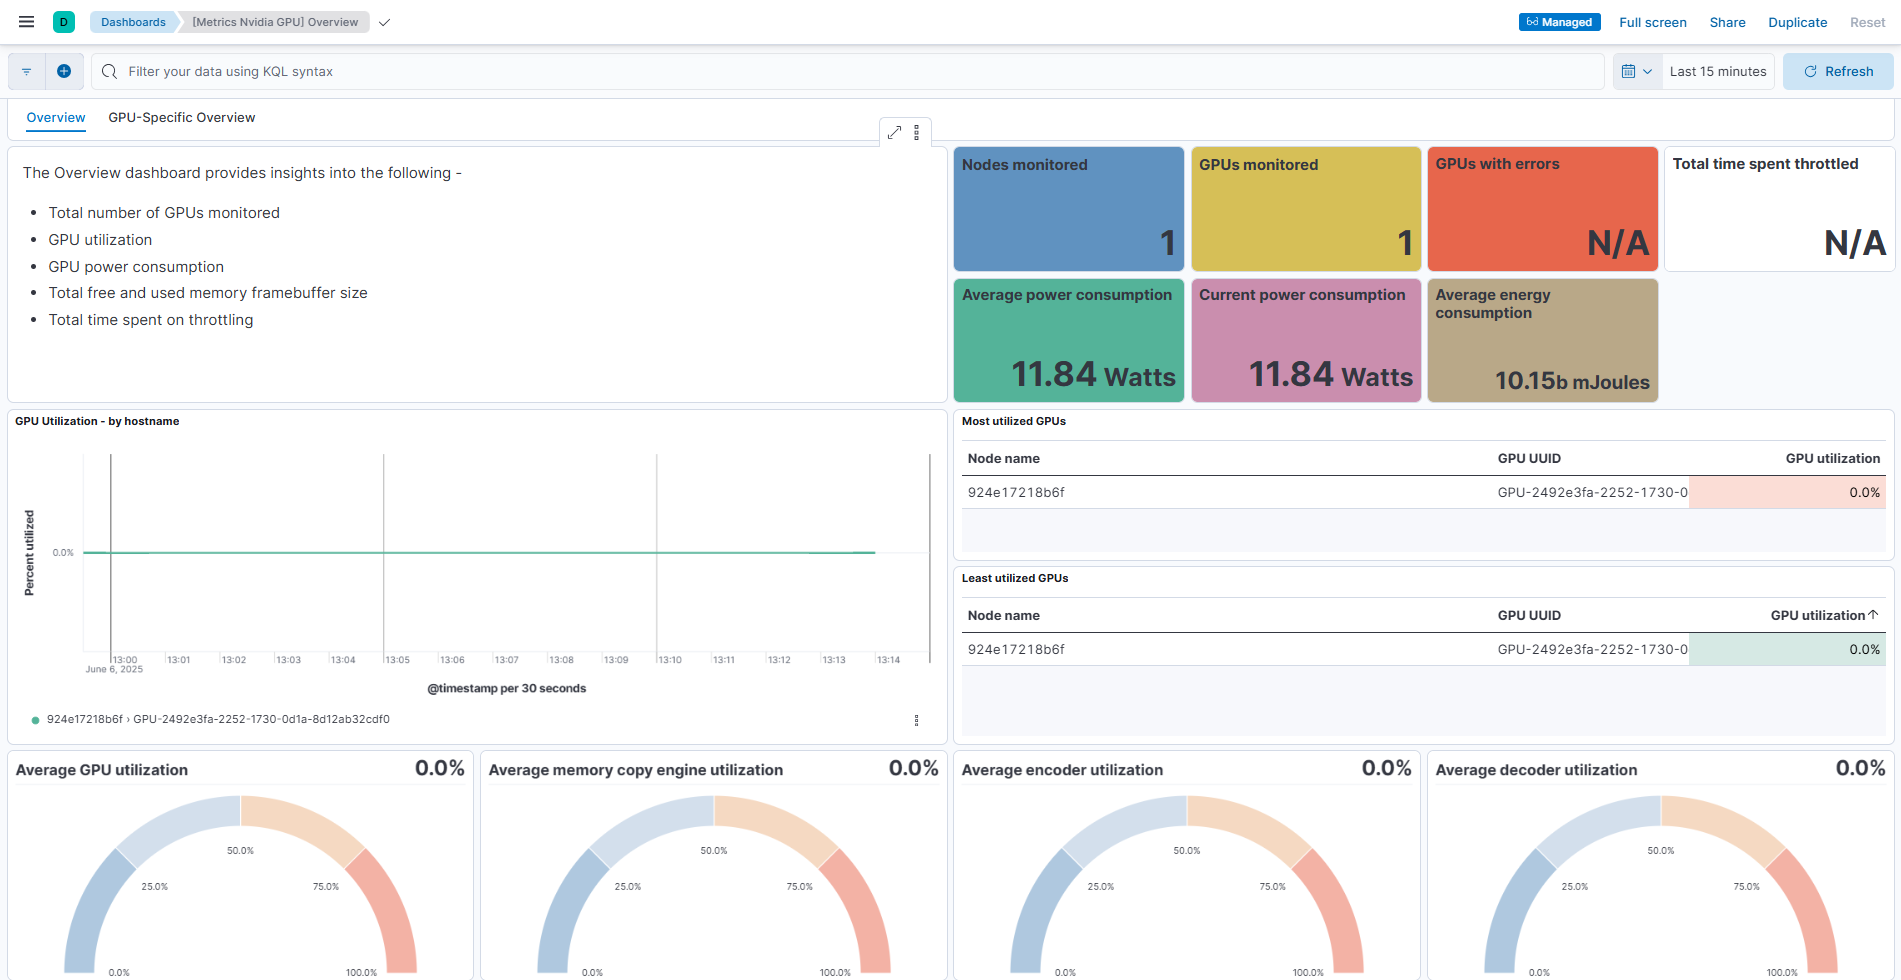
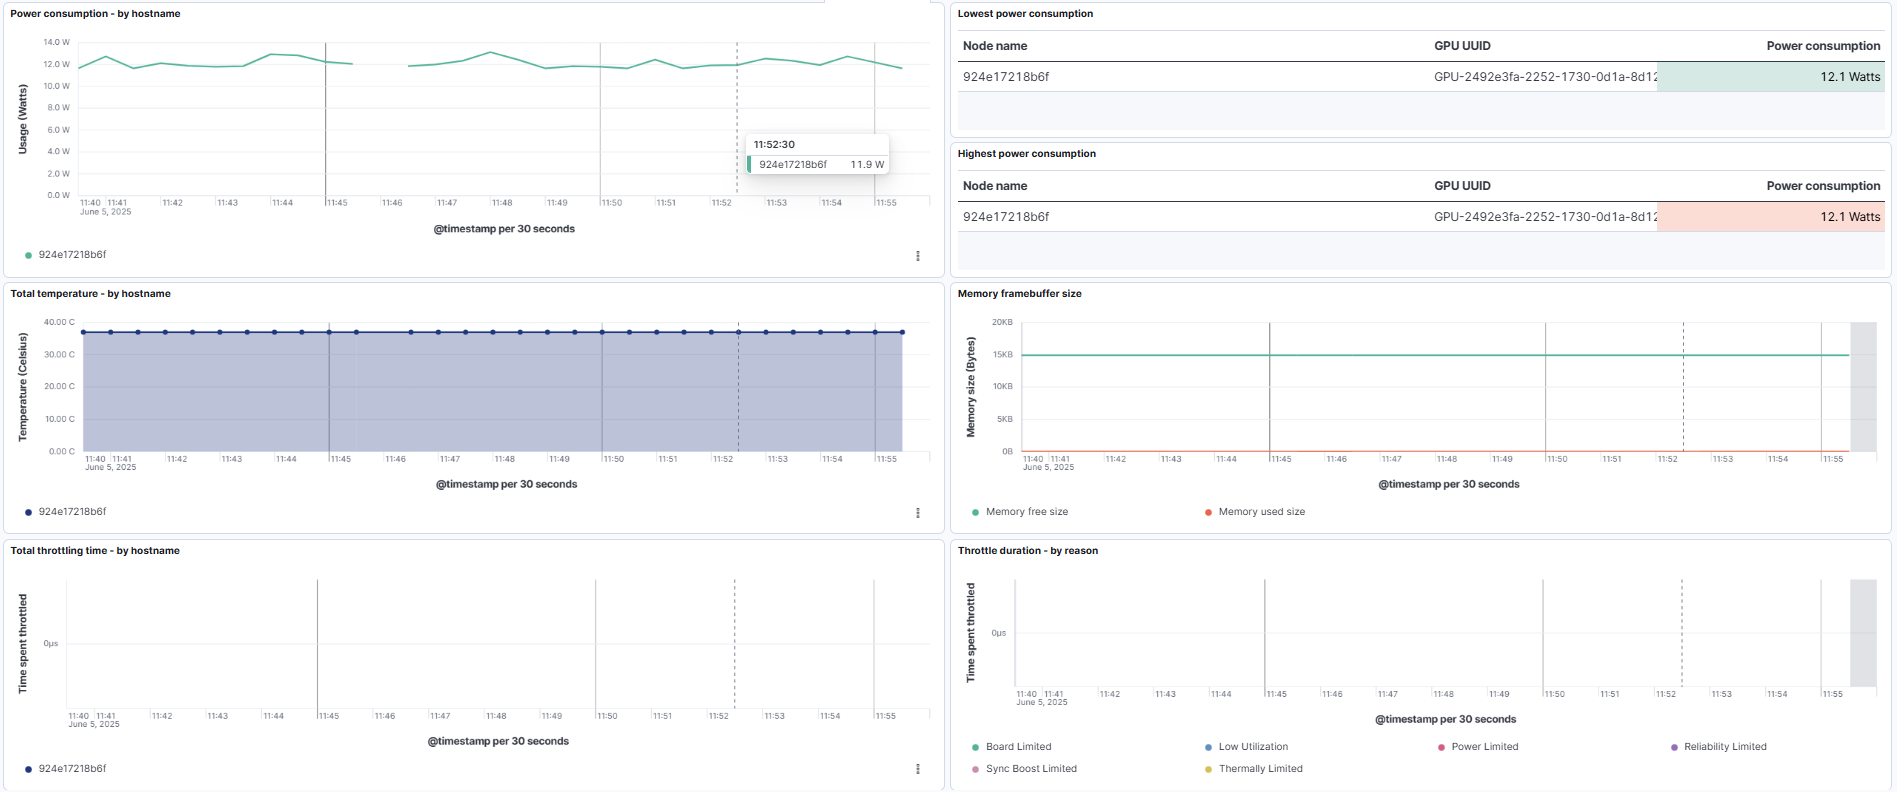
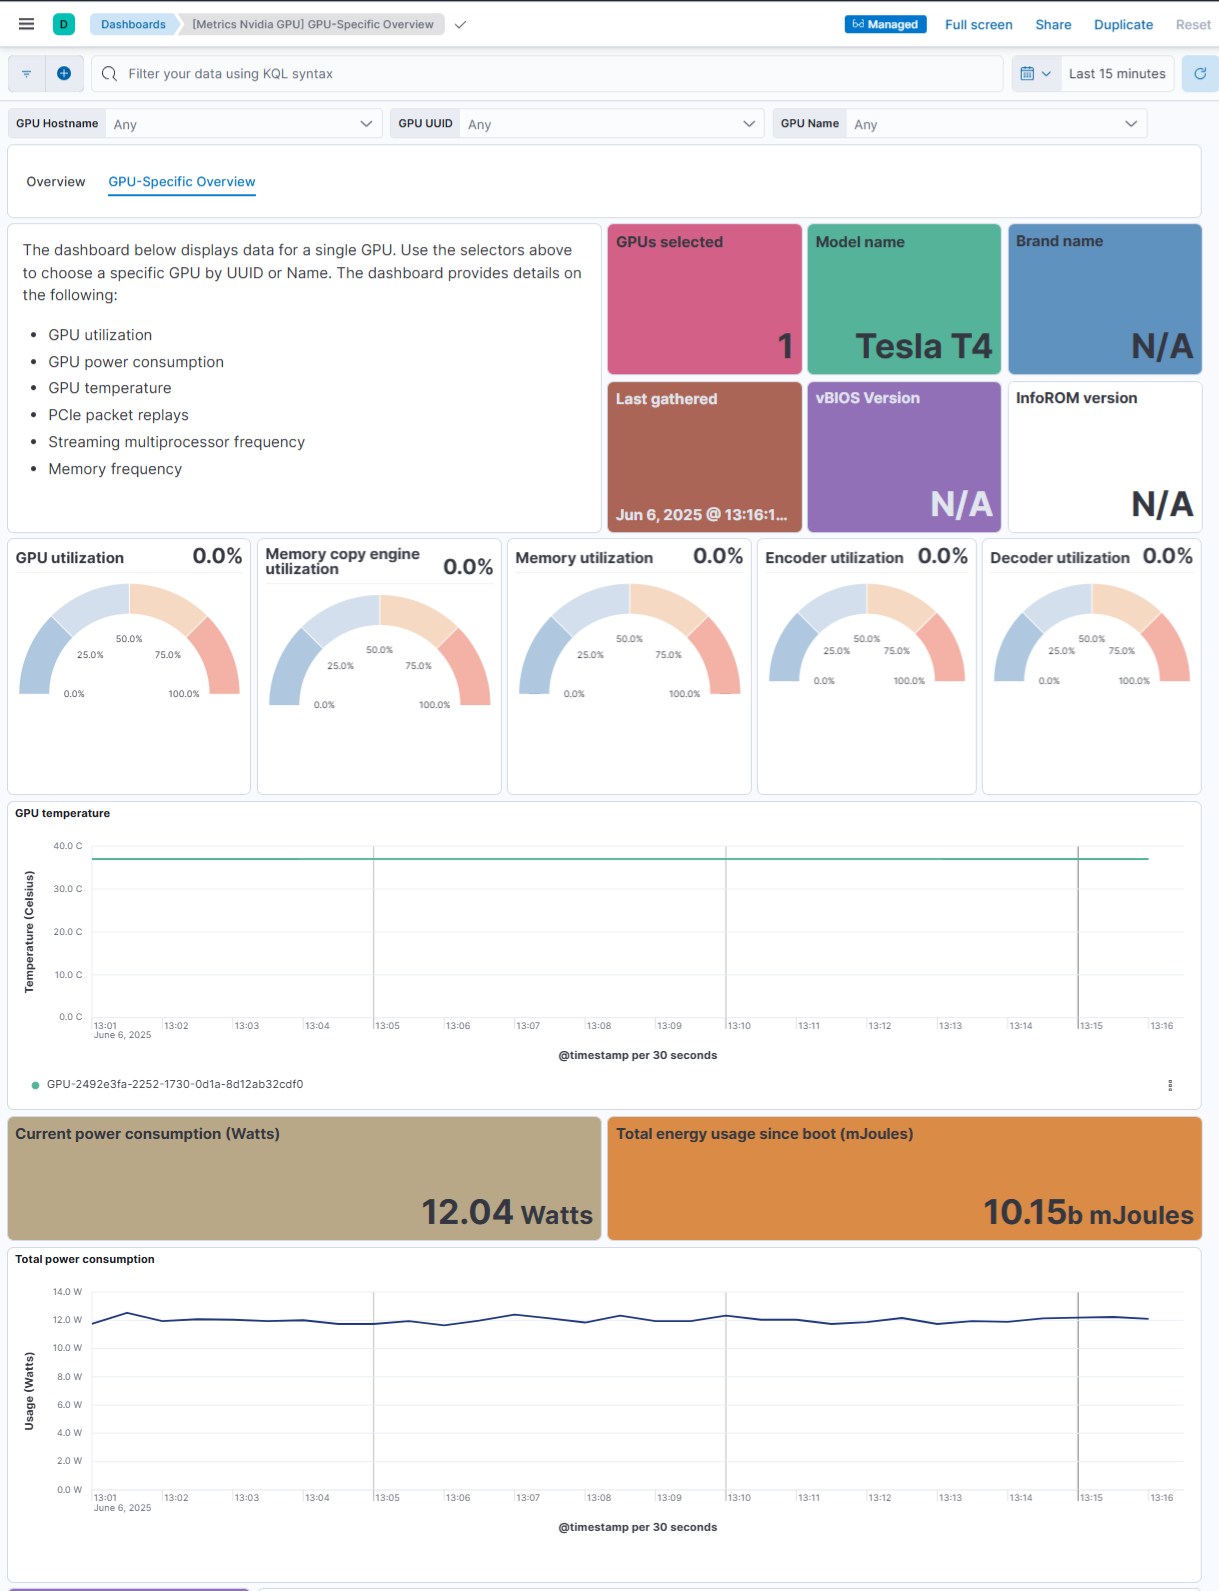
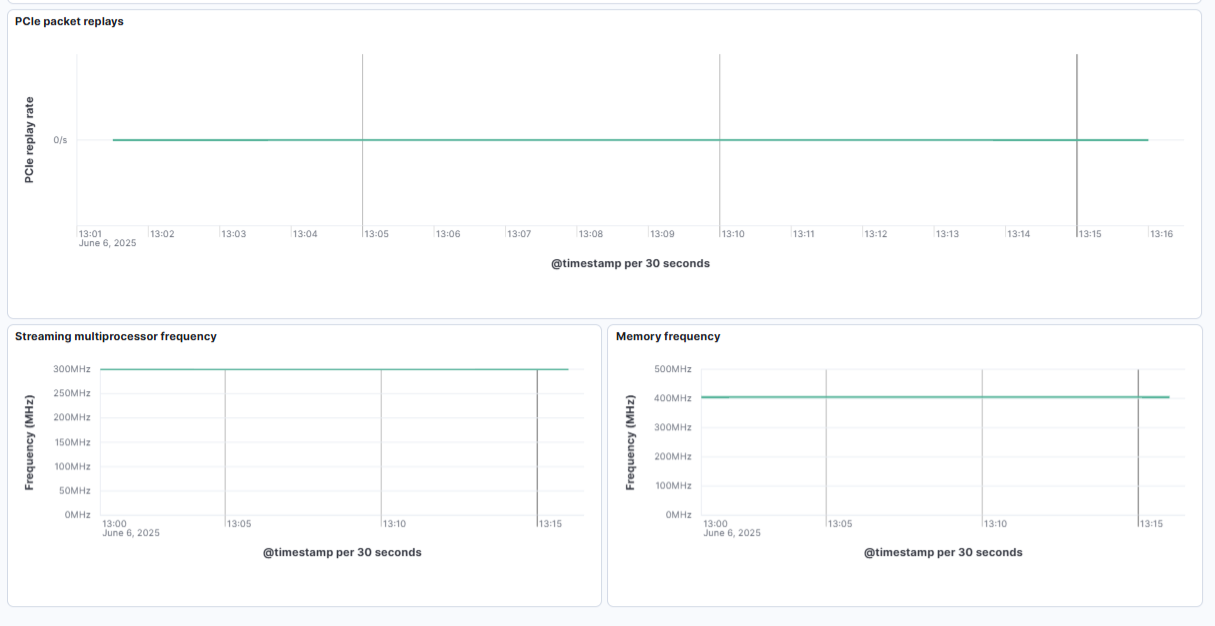
This integration includes one or more Kibana dashboards that visualizes the data collected by the integration. The screenshots below illustrate how the ingested data is displayed.
Changelog
| Version | Details | Minimum Kibana version |
|---|---|---|
| 0.4.1 | Bug fix (View pull request) SSL configuration is not expected to have multiple values. |
9.0.0 8.16.0 |
| 0.4.0 | Enhancement (View pull request) Enable TSDB and apply field renaming with corresponding dashboard and sample event changes. |
9.0.0 8.16.0 |
| 0.3.0 | Enhancement (View pull request) Add system test. |
9.0.0 8.16.0 |
| 0.2.0 | Enhancement (View pull request) Field renaming and dashboard enhancements. |
9.0.0 8.16.0 |
| 0.1.0 | Enhancement (View pull request) Initial introduction of Nvidia GPU Monitoring |
9.0.0 8.16.0 |


