RUM OpenTelemetry Assets
| Version | 0.0.3
|
| Subscription level What's this? |
Basic |
| Developed by What's this? |
Elastic |
| Minimum Kibana version(s) | 9.4.0 |
To use pre-release integrations, go to the Integrations page in Kibana, scroll down, and toggle on the Display beta integrations option.
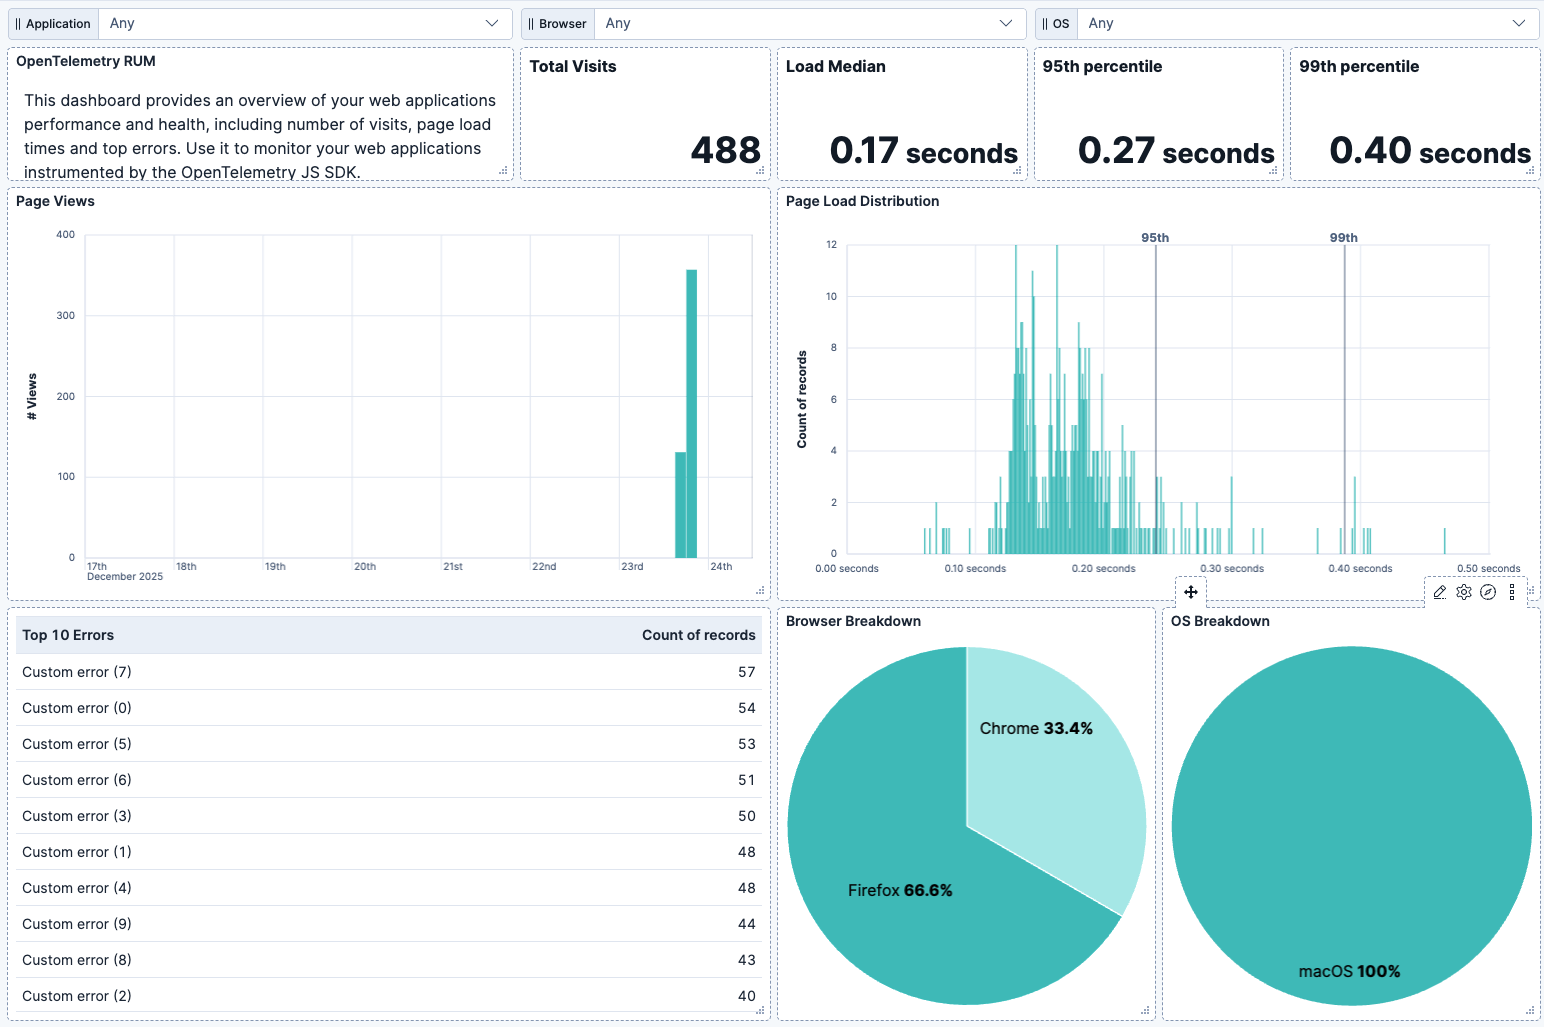
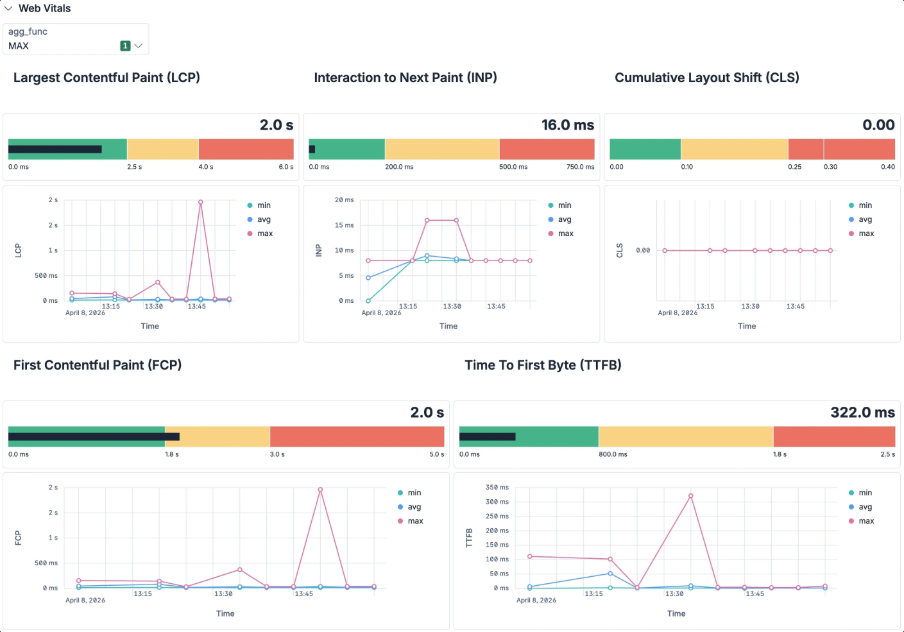
Use this package to get a dashboard which displays metrics from your web applications instrumented by Opentelemetry JS SDK. The metrics diplayed are:
- page load and visits: these metrics are calculated from the telemetry captured by
@opentelemetry/instrumentation-document-loadinstrumentation. - errors: the top errors are calculated from the telemetry captured by
@opentelemetry/instrumentation-web-exceptioninstrumentation. - web vitals: the web vitals are calculated from the telemetry captured by
WebVitalsInstrumentationwithin@opentelemetry/browser-instrumentationpackage.
You should have all instrumentations enabled in your web application to get the metrics populated in this dashboard.
This package has ben tested with OpenTelemetry JS SDK 2.2.0 and with OpenTelemetry semantic conventions 1.38.0. It should work with later versions as long as there are no breaking changes in browser.* namespace of semantic conventions.
This package will show metrics only if you are monitoring web applications with OpenTelemetry JS SDK. If you are new to OpenTelemetry RUM you can check the guide on how to start with the Elastic stack.
- In the top search bar in Kibana, search for Dashboards.
- In the search bar, type OpenTelemetry RUM JS.
- Select a dashboard for the dataset you are collecting, and verify the dashboard information is populated.
If you do not see data in the dashboard make sure that:
- Elastic search has recevied the documents from Opentelemetry JS SDK. You can search for them in discover with the filter
telemetry.sdk.language : "webjs" - You can run more detailed searches to ensure the data is available for specific sections of the dashboard:
- use the filter
scope.name : "@opentelemetry/instrumentation-document-load"to check if the data for page load metrics is present. - use the filter
scope.name : "@opentelemetry/instrumentation-web-exception"to check if the data for error metrics is present. - use the filter
scope.name : "@opentelemetry/instrumentation-web-vitals"to check if the data for web vitals metrics is present.
- use the filter
This integration includes one or more Kibana dashboards that visualizes the data collected by the integration. The screenshots below illustrate how the ingested data is displayed.
Changelog
| Version | Details | Minimum Kibana version |
|---|---|---|
| 0.0.3 | Enhancement (View pull request) Add web vitals metrics |
9.4.0 |
| 0.0.2 | Bug fix (View pull request) Fix filters on metrics and errors panels |
9.2.1 |
| 0.0.1 | Enhancement (View pull request) Initial draft of the package |
9.2.1 |

