AWS ECS Metrics OpenTelemetry Assets
| Version | 0.12.0
|
| Subscription level What's this? |
Basic |
| Developed by What's this? |
Elastic |
| Minimum Kibana version(s) | 9.5.0 |
To use pre-release integrations, go to the Integrations page in Kibana, scroll down, and toggle on the Display beta integrations option.
This package contains Kibana assets for monitoring ECS services with AWS CloudWatch metrics collected by the OpenTelemetry Collector.
The package is content only. It provides a curated metrics dashboard, but it does not configure data collection. Use the AWS CloudWatch OpenTelemetry Input Package (aws_cloudwatch_input_otel) to configure the OpenTelemetry Collector CloudWatch receiver and collect the required AWS service metrics into Elasticsearch.
- CloudWatch metrics collected by the OpenTelemetry Collector AWS CloudWatch receiver.
- Documents indexed into the
metrics-aws.ecs.otel-*data stream. - The relevant AWS dimensions for this service, such as resource name, region, and service-specific identifiers.
Requires Kibana ^9.5.0.
This package includes one pre-built Kibana dashboard:
| Name | Description |
|---|---|
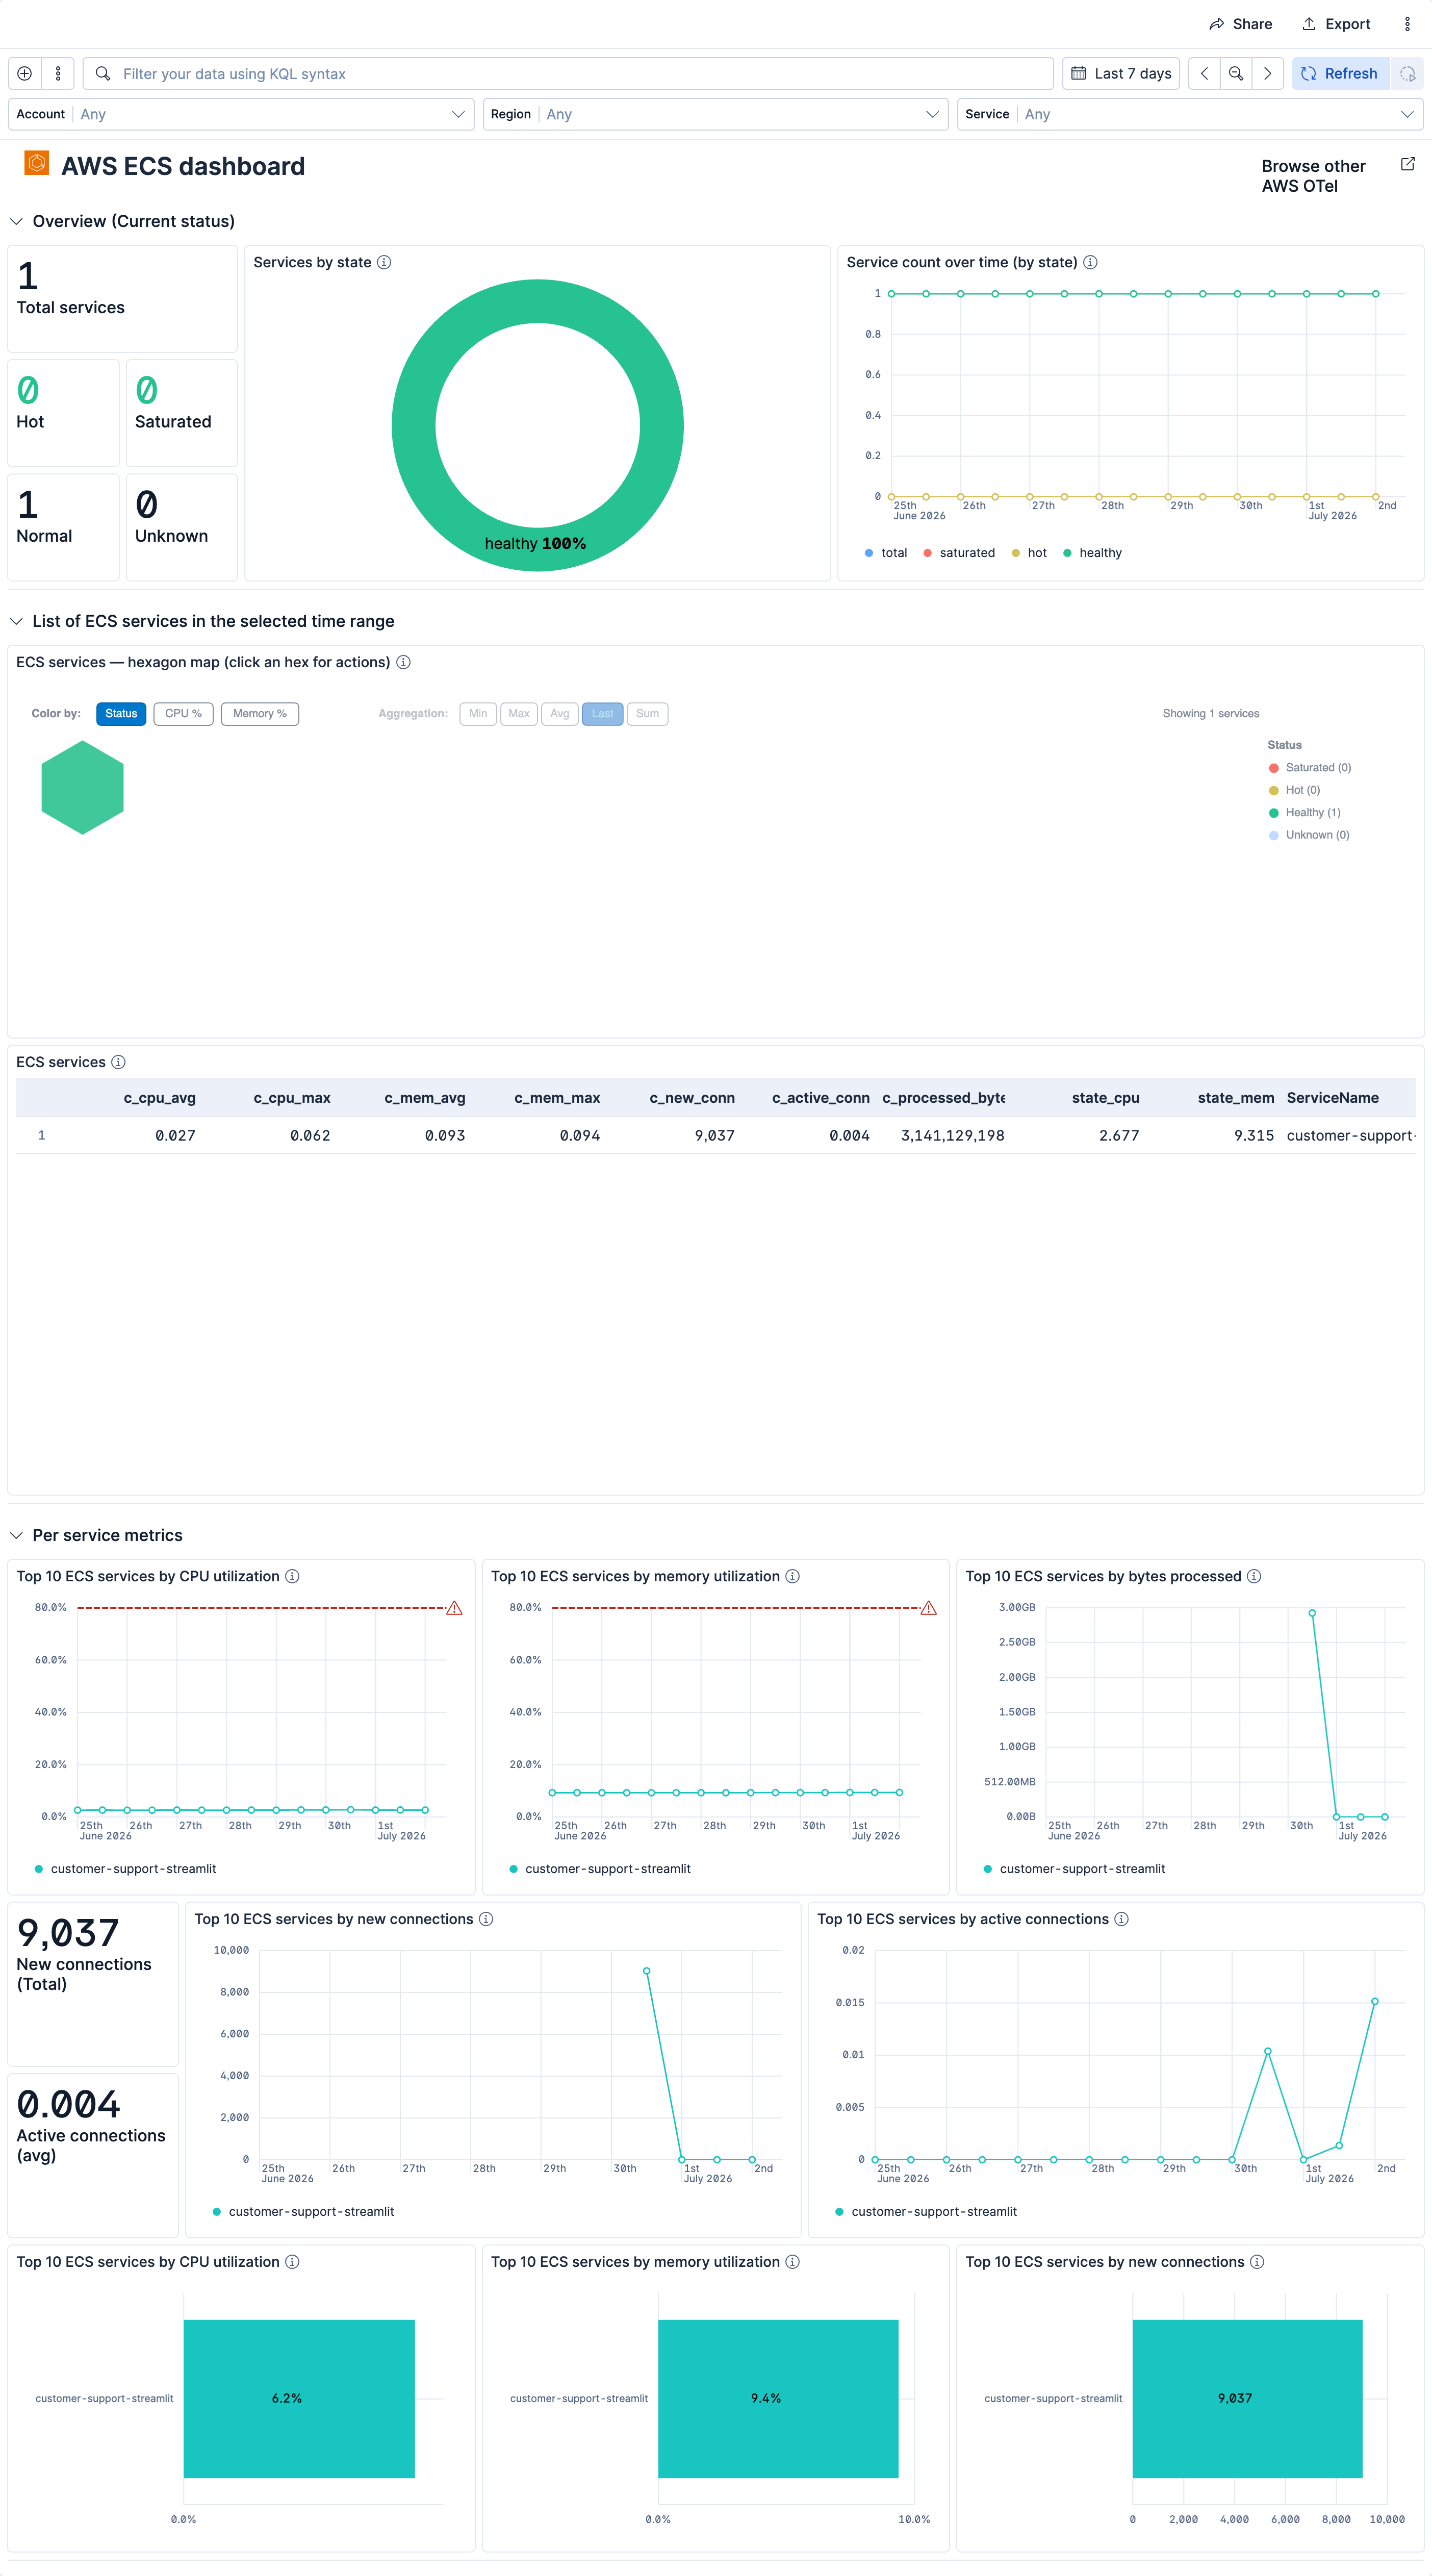
| [AWS ECS OTel] Metrics | AWS ECS dashboard for CloudWatch metrics collected by the OpenTelemetry Collector. |
Alert rule templates provide pre-defined configurations for creating alert rules in Kibana.
For more information, refer to the Elastic documentation.
Alert rule templates require Elastic Stack version 9.2.0 or later.
The following alert rule templates are available:
View the alert rule templates
| Name | Description |
|---|---|
| [AWS ECS OTel] CPU reservation high | Alerts when the percentage of CPU units reserved by running tasks approaches the cluster's total registered CPU capacity. High reservation means new tasks cannot be placed without adding capacity. |
| [AWS ECS OTel] CPU utilization high | Alerts when average CPU utilization of reserved task CPU exceeds a threshold. Sustained high CPU throttles workloads and raises application latency. |
| [AWS ECS OTel] Memory reservation high | Alerts when the percentage of memory reserved by running tasks approaches the cluster's total registered memory capacity. High reservation means new tasks cannot be placed without adding capacity. |
| [AWS ECS OTel] Memory utilization high | Alerts when average memory utilization of reserved task memory exceeds a threshold. Sustained high memory risks OOM kills and task churn. |
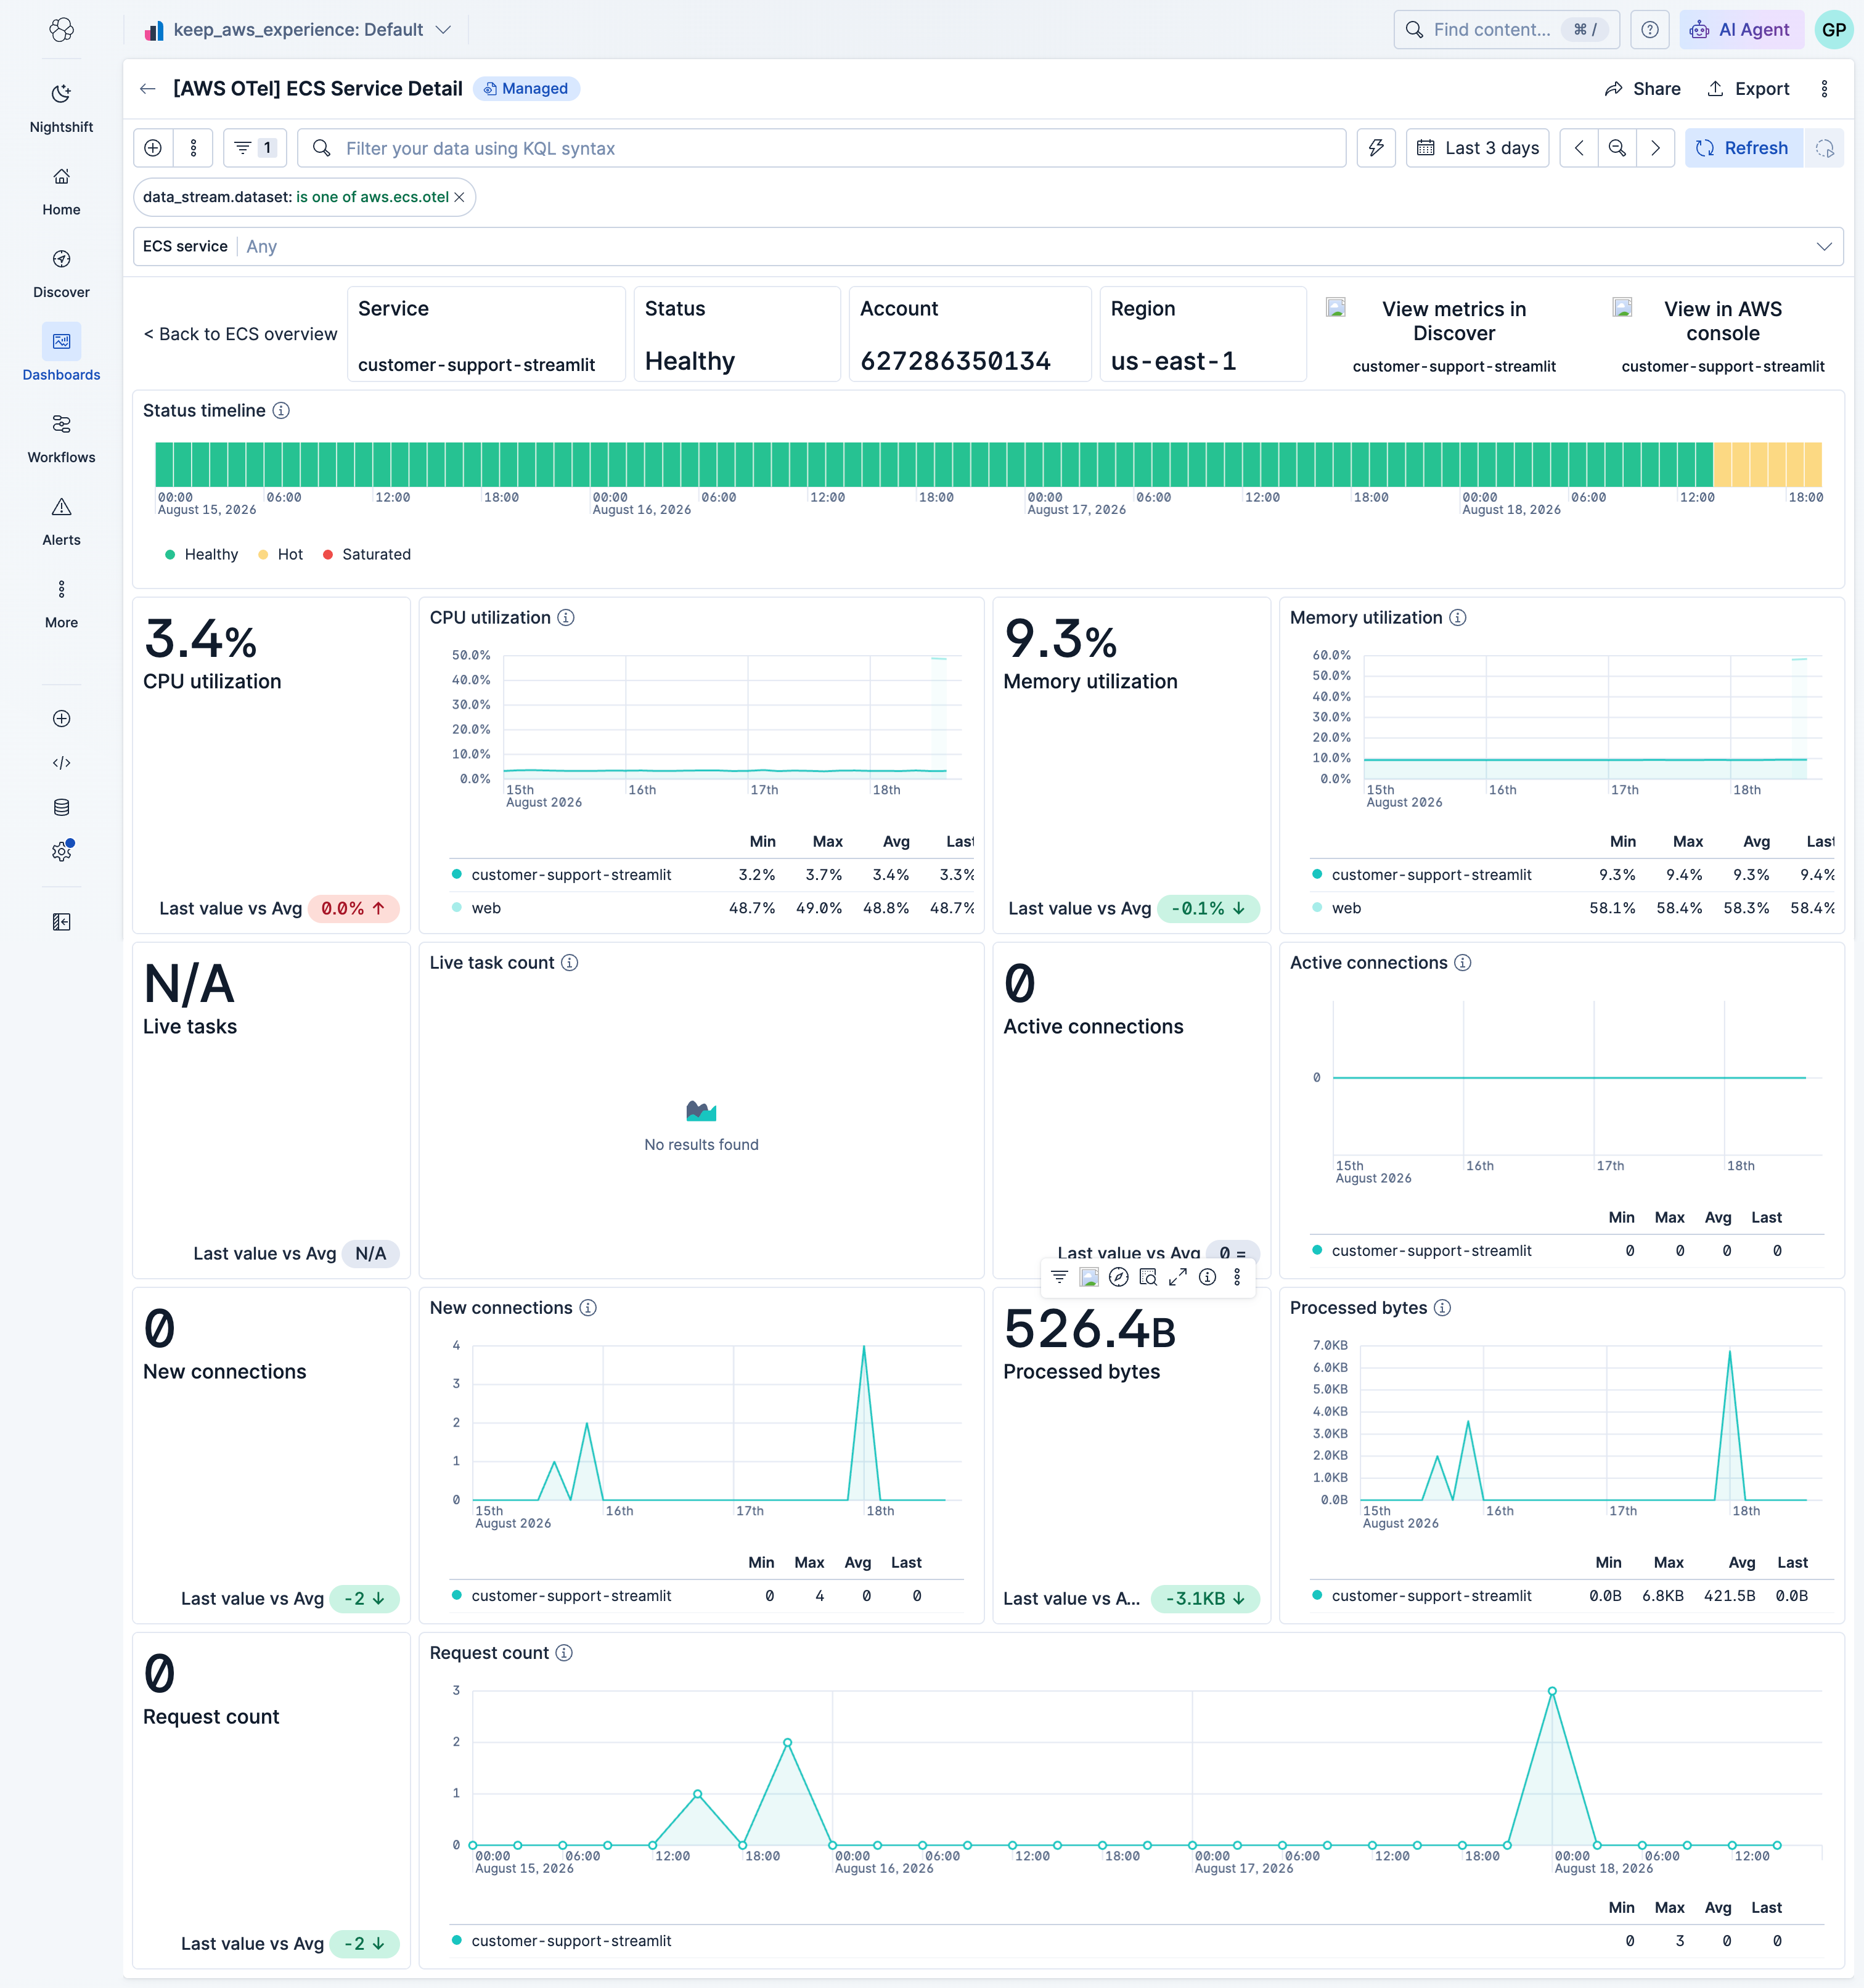
This integration includes one or more Kibana dashboards that visualizes the data collected by the integration. The screenshots below illustrate how the ingested data is displayed.
Changelog
| Version | Details | Minimum Kibana version |
|---|---|---|
| 0.12.0 | Bug fix (View pull request) Replace the deprecated popout icon with external so dashboard navigation cards render correctly. |
9.5.0 |
| 0.11.0 | Enhancement (View pull request) Add ECS service detail dashboard with drilldowns from the overview dashboard. |
9.5.0 |
| 0.10.0 | Enhancement (View pull request) Add ML anomaly detection module for ECS service CPU and memory utilization. Enhancement (View pull request) Add ml_module to the Kibana asset tags. |
9.5.0 |
| 0.9.0 | Enhancement (View pull request) Add missing recommended alerts for CPU and memory reservation high. |
9.5.0 |
| 0.8.0 | Enhancement (View pull request) Add tags to Kibana assets |
9.5.0 |
| 0.7.1 | Enhancement (View pull request) Rename the dashboard to "[AWS ECS OTel] Metrics". |
9.5.0 |
| 0.7.0 | Enhancement (View pull request) Remove the idle status and map "no data" to "Unknown" across ECS dashboard panels. |
9.5.0 |
| 0.6.0 | Enhancement (View pull request) Improve ESQL queries in dashboards |
9.5.0 |
| 0.5.0 | Enhancement (View pull request) Add _dev/build/docs/README.md |
9.5.0 |
| 0.4.0 | Enhancement (View pull request) Improve dashboard queries and visualizations |
9.5.0 |
| 0.3.0 | Enhancement (View pull request) Add alert rules to README |
9.5.0 |
| 0.2.1 | Enhancement (View pull request) Standardize the package title and description to the AWS <service> <signal> OpenTelemetry Assets naming convention. |
9.5.0 |
| 0.2.0 | Enhancement (View pull request) Create new Alert assets |
9.5.0 |
| 0.1.0 | Enhancement (View pull request) Initial AWS ECS OpenTelemetry metrics dashboard package |
9.5.0 |