XM Cyber Integration
| Version | 0.5.0
|
| Managed integration release status | GA |
| Subscription level What's this? |
Basic |
| Developed by What's this? |
Elastic |
| Ingestion method(s) | API |
| Minimum Kibana version(s) | 9.1.0 8.18.0 |
You can use this integration as an Elastic Managed integration on Elastic Cloud Hosted deployments running this version or later.
To use pre-release integrations, go to the Integrations page in Kibana, scroll down, and toggle on the Display beta integrations option.
XM Cyber is a Continuous Threat Exposure Management (CTEM) and attack path management platform. It continuously simulates attacker movement across hybrid environments including on-premises, cloud, and identity infrastructure — combining vulnerabilities, misconfigurations, and overly permissive access into prioritized attack paths that lead to critical assets.
This integration collects data from the XM Cyber REST API using scheduled polling. It provides visibility into your organization's security posture across your environment.
The XM Cyber integration is compatible with the API version v2.
The integration uses the Elastic Agent CEL (Common Expression Language) input to poll the XM Cyber REST API on a configurable schedule. Each poll:
- Authenticates with a two-step flow: exchanges the API key for a short-lived Bearer access token via
POST /api/auth - Fetches data from the configured endpoint.
- Emits each record as an individual event for ingestion and enrichment via the built-in ingest pipeline
The XM Cyber integration collects the following types of data:
| Data stream | Description | Endpoint |
|---|---|---|
audit_trail |
Audit Records | /api/audit-trail/auditRecords |
vulnerability |
Open CVE records from XM Cyber's Vulnerability Risk Management (VRM) feed, including CVSS v2/v3/v4 scores, EPSS metrics, CISA KEV / Exploit-DB flags, vendor advisory URLs, and per-CVE counts of devices, products, and critical assets at risk | /api/v2/vrm/public/vrmReport/vulnerabilities |
entity_inventory |
Inventory of entities (devices, identities, and cloud resources) tracked by XM Cyber, enriched with OS, network, agent, and cloud-account metadata. | /api/entityInventory/entities |
risk_score |
Organization-level security grade (A–F), numeric risk score, trend data, and per-scenario breakdowns | /api/scenarios/v2/scenarios/riskScore |
device |
Device inventory from XM Cyber VRM: identity (device id, name, type), network and directory context (IP, subnet, FQDN, domain, OU, OS), choke-point level and critical-asset flag, aggregate vulnerability counts and max CVSS scores, and XM Cyber risk score | /api/v2/vrm/public/vrmReport/devices |
product |
Product-level aggregates from VRM: one event per software product with fleet-wide counts (devices where it appears, choke-point presence, affected critical assets, products critical assets at risk, vulnerability count), vendor, and reported operating systems. | /api/v2/vrm/public/vrmReport/products |
vulnerability_instance |
Per-device CVE instances from VRM: one event per device listing its installed product versions, each with vendor, version, file paths, active CVEs (and safe versions), and closed CVE IDs | /api/v2/vrm/public/vrmReport/vulnerabilityInstances |
- Audit and compliance monitoring: Track administrative and user activity within your XM Cyber tenant — including console logins, sensor scan results, and configuration changes — and correlate it with the rest of your security telemetry to support compliance reviews and incident investigations.
- Risk-based vulnerability prioritization: Rank open CVEs by CVSS impact, EPSS exploit probability, and CISA KEV / Exploit-DB flags to focus remediation effort where it actually reduces business risk.
- Attack-path-aware exposure analysis: Correlate detected CVEs with XM Cyber's attack-technique simulations to identify which vulnerabilities act as choke points or stepping stones to crown-jewel assets.
- Asset and exposure visibility: Maintain a unified inventory of the devices, identities, and cloud resources XM Cyber discovers across hybrid environments — with OS, network, agent, and cloud-account context — to support asset management, attack-surface monitoring, and prioritization of critical assets.
- Security posture tracking: Monitor your organization's XM Cyber risk score over time and correlate score changes with security events.
- Hybrid device inventory: Track which assets XM Cyber has discovered, how they are classified, and how they are labeled across on-premises and cloud footprints.
- Exposure-aware asset triage: Use choke-point level and critical-asset signals together with per-device vulnerability counts and max CVSS to prioritize which hosts warrant review first.
- Software exposure across the fleet: Rank products by
product_vulnerabilities,devices_found_on, andchoke_points_found_on, and slice byproduct_operating_systemto align remediation with platform mix. - Critical-asset risk from products: Use
affected_critical_assetsandproducts_critical_assets_at_riskwith vendor and OS context to prioritize patch and upgrade work. - Instance-level remediation: Use
vulnerability_instanceto see which product version on which device still has an active CVE, and whether a safe version is already known.
This integration installs Elastic latest transforms. For more details, check the Transform setup and requirements.
- XM Cyber tenant: An active XM Cyber deployment with access to
https://<your-org>.clients.xmcyber.com - API key: An XM Cyber API key associated with a user holding at minimum the Security Analyst role. Create one in Settings → API / Integrations in your XM Cyber admin console (refer to the XM Cyber customer portal at https://customers.xmcyber.com for current navigation steps)
- Elastic Agent: Version 8.18+ or 9.0+ with Fleet enrollment
This integration supports both Elastic Agentless-based and Agent-based installations.
Agentless integrations allow you to collect data without having to manage Elastic Agent in your cloud. They make manual agent deployment unnecessary, so you can focus on your data instead of the agent that collects it. For more information, refer to Agentless integrations and the Agentless integrations FAQ.
Agentless deployments are only supported in Elastic Serverless and Elastic Cloud environments. This functionality is in beta and is subject to change. Beta features are not subject to the support SLA of official GA features.
Elastic Agent must be installed. For more details, check the Elastic Agent installation instructions. You can install only one Elastic Agent per host.
- In Kibana, navigate to Fleet → Integrations and search for XM Cyber
- Click Add XM Cyber
- Configure the integration settings:
- URL: Your XM Cyber base URL, for example
https://your-org.clients.xmcyber.com - API Key: Your XM Cyber API key.
- Interval: How often to poll for new data (default:
24h). - Initial interval: How far back to fetch risk score data, in days (e.g.
30,90,200). Default:30.
- URL: Your XM Cyber base URL, for example
- Select Save and continue to save the integration.
- In the top search bar in Kibana, search for Dashboards.
- In the search bar, type XM Cyber, and verify the dashboard information is populated.
- In the top search bar in Kibana, search for Transforms.
- Select the Data / Transforms from the search results.
- In the search bar, type XM Cyber.
- All transforms from the search results should indicate Healthy under the Health column.
An Elastic Transform is created for each data stream, to provide a view of the most recent, active XM Cyber data. Use the relevant destination alias from the table below to access the latest data, whether for use in dashboards, rules, or elsewhere.
Destinations indices are aliased to logs-xm_cyber_latest.<data_stream_name>.
| Source Data stream | Destination Index Pattern | Destination Alias |
|---|---|---|
logs-xm_cyber.vulnerability-* |
logs-xm_cyber_latest.dest_vulnerability-* |
logs-xm_cyber_latest.vulnerability |
For more information on architectures that can be used for scaling this integration, check the Ingest Architectures documentation.
- Authentication failures: Verify the API key is valid and the URL includes the full
https://prefix with no trailing slash - No data collected: Check the Elastic Agent logs for CEL program errors. Ensure your XM Cyber user has the Security Analyst role and API access is enabled in your tenant settings
- Rate limiting: XM Cyber API rate limits are not publicly documented. If you observe HTTP 429 responses in agent logs, increase the collection interval
For help with Elastic ingest tools, check Common problems.
Exported fields
| Field | Description | Type |
|---|---|---|
| @timestamp | Event timestamp. | date |
| data_stream.dataset | Data stream dataset. | constant_keyword |
| data_stream.namespace | Data stream namespace. | constant_keyword |
| data_stream.type | Data stream type. | constant_keyword |
| event.dataset | Event dataset. | constant_keyword |
| event.module | Event module. | constant_keyword |
| input.type | Type of filebeat input. | keyword |
| observer.product | The product name of the observer. | constant_keyword |
| observer.vendor | Vendor name of the observer. | constant_keyword |
| xm_cyber.audit_trail._id | XM Cyber's unique audit record identifier. Mapped to ECS event.id. |
keyword |
| xm_cyber.audit_trail.details | Free-form details about the action. | keyword |
| xm_cyber.audit_trail.event_sub_type | Finer-grained action detail (for example, SettingsChanged, PasswordReset). | keyword |
| xm_cyber.audit_trail.event_type | High-level action performed (for example, Create, Update, Delete, Login). | keyword |
| xm_cyber.audit_trail.object_name | The name or identifier of the object affected. | keyword |
| xm_cyber.audit_trail.object_type | The type of object affected by the action (for example, Policy, User, Scenario). | keyword |
| xm_cyber.audit_trail.tenant | XM Cyber tenant identifier. | keyword |
| xm_cyber.audit_trail.terminal_id.hostname | Hostname of the terminal from which the action originated. | keyword |
| xm_cyber.audit_trail.terminal_id.ip | IP address of the terminal from which the action originated. | ip |
| xm_cyber.audit_trail.terminal_id.ip_string | IP address of the terminal from which the action originated as a string. | keyword |
| xm_cyber.audit_trail.timestamp | Vendor event timestamp. Mapped to ECS @timestamp. |
date |
| xm_cyber.audit_trail.user_id.email | Email of the user who performed the action. | keyword |
| xm_cyber.audit_trail.user_id.name | Display name of the user who performed the action. | keyword |
Example
{
    "@timestamp": "2023-01-03T19:13:54.358Z",
    "agent": {
        "ephemeral_id": "f5f3af84-3cc2-449f-9229-93d4e5bc51dc",
        "id": "23583cd2-0340-47d1-8ec4-e48eaadf4eb9",
        "name": "elastic-agent-99885",
        "type": "filebeat",
        "version": "8.19.0"
    },
    "data_stream": {
        "dataset": "xm_cyber.audit_trail",
        "namespace": "60399",
        "type": "logs"
    },
    "ecs": {
        "version": "9.5.0"
    },
    "elastic_agent": {
        "id": "23583cd2-0340-47d1-8ec4-e48eaadf4eb9",
        "snapshot": false,
        "version": "8.19.0"
    },
    "event": {
        "action": "console-login",
        "agent_id_status": "verified",
        "dataset": "xm_cyber.audit_trail",
        "id": "64b2c3d4e5f60718293a4b5c",
        "ingested": "2026-09-22T11:31:30Z",
        "kind": "event",
        "original": "{\"_id\":\"64b2c3d4e5f60718293a4b5c\",\"details\":\"john.doe@example.com Logged in via user\",\"eventSubType\":\"CONSOLE_LOGIN\",\"eventType\":\"ACCESS\",\"objectName\":\"User\",\"objectType\":\"USER\",\"tenant\":\"demo\",\"terminalId\":{\"hostname\":\"demo.clients.example.com\",\"ip\":\"192.0.2.0\"},\"timestamp\":\"2023-01-03T19:13:54.358Z\",\"userId\":{\"email\":\"john.doe@example.com\",\"name\":\"John Doe\"}}",
        "type": [
            "access"
        ]
    },
    "input": {
        "type": "cel"
    },
    "message": "john.doe@example.com Logged in via user",
    "related": {
        "hosts": [
            "demo.clients.example.com"
        ],
        "ip": [
            "192.0.2.0"
        ],
        "user": [
            "John Doe",
            "john.doe@example.com"
        ]
    },
    "source": {
        "as": {
            "number": 64500,
            "organization": {
                "name": "Documentation ASN"
            }
        },
        "domain": "demo.clients.example.com",
        "geo": {
            "city_name": "Las Vegas",
            "continent_name": "North America",
            "country_iso_code": "US",
            "country_name": "United States",
            "location": {
                "lat": 36.17497,
                "lon": -115.13722
            },
            "region_iso_code": "US-NV",
            "region_name": "Nevada"
        },
        "ip": "192.0.2.0"
    },
    "tags": [
        "preserve_original_event",
        "forwarded",
        "xm_cyber-audit_trail"
    ],
    "user": {
        "domain": "example.com",
        "email": "john.doe@example.com",
        "name": "John Doe"
    },
    "xm_cyber": {
        "audit_trail": {
            "details": "john.doe@example.com Logged in via user",
            "event_type": "access",
            "object_name": "User",
            "object_type": "USER",
            "tenant": "demo"
        }
    }
}
Exported fields
| Field | Description | Type |
|---|---|---|
| @timestamp | Date/time when the event originated. This is the date/time extracted from the event, typically representing when the event was generated by the source. If the event source has no original timestamp, this value is typically populated by the first time the event was received by the pipeline. Required field for all events. | date |
| data_stream.dataset | The field can contain anything that makes sense to signify the source of the data. Examples include nginx.access, prometheus, endpoint etc. For data streams that otherwise fit, but that do not have dataset set we use the value "generic" for the dataset value. event.dataset should have the same value as data_stream.dataset. Beyond the Elasticsearch data stream naming criteria noted above, the dataset value has additional restrictions: * Must not contain - * No longer than 100 characters |
constant_keyword |
| data_stream.namespace | A user defined namespace. Namespaces are useful to allow grouping of data. Many users already organize their indices this way, and the data stream naming scheme now provides this best practice as a default. Many users will populate this field with default. If no value is used, it falls back to default. Beyond the Elasticsearch index naming criteria noted above, namespace value has the additional restrictions: * Must not contain - * No longer than 100 characters |
constant_keyword |
| data_stream.type | An overarching type for the data stream. Currently allowed values are "logs" and "metrics". We expect to also add "traces" and "synthetics" in the near future. | constant_keyword |
| event.dataset | Name of the dataset. If an event source publishes more than one type of log or events (e.g. access log, error log), the dataset is used to specify which one the event comes from. It's recommended but not required to start the dataset name with the module name, followed by a dot, then the dataset name. | constant_keyword |
| event.module | Name of the module this data is coming from. If your monitoring agent supports the concept of modules or plugins to process events of a given source (e.g. Apache logs), event.module should contain the name of this module. |
constant_keyword |
| input.type | Type of filebeat input. | keyword |
| labels.is_transform_source | Distinguishes between documents that are a source for a transform and documents that are an output of a transform, to facilitate easier filtering. | constant_keyword |
| observer.product | The product name of the observer. | constant_keyword |
| observer.vendor | Vendor name of the observer. | constant_keyword |
| vulnerability.scanner.vendor | The name of the vulnerability scanner vendor. | constant_keyword |
| xm_cyber.vulnerability.amazon_linux_url | Amazon Linux ALA/ALAS CVE URL, when applicable. | keyword |
| xm_cyber.vulnerability.choke_point_found_on | Number of choke-point devices where the CVE was detected. | long |
| xm_cyber.vulnerability.critical_assets_at_risk | Number of critical assets reachable via attack paths that include this CVE. | long |
| xm_cyber.vulnerability.critical_assets_found_on | Number of critical-asset devices where the CVE was detected. | long |
| xm_cyber.vulnerability.cve_org_url | CVE.org record URL for the CVE. | keyword |
| xm_cyber.vulnerability.cvss2 | CVSS v2 base score. 0 when the CVE has no v2 vector. |
double |
| xm_cyber.vulnerability.cvss2vector | CVSS v2 vector string. | keyword |
| xm_cyber.vulnerability.cvss30 | CVSS v3.0 base score. 0 when the CVE has no v3.0 vector. |
double |
| xm_cyber.vulnerability.cvss31 | CVSS v3.1 base score. 0 when the CVE has no v3.1 vector. |
double |
| xm_cyber.vulnerability.cvss31vector | CVSS v3.1 vector string. | keyword |
| xm_cyber.vulnerability.cvss3vector | CVSS v3.0 vector string. | keyword |
| xm_cyber.vulnerability.cvss4 | CVSS v4 base score. 0 when the CVE has no v4 vector. |
double |
| xm_cyber.vulnerability.cvss4vector | CVSS v4 vector string. | keyword |
| xm_cyber.vulnerability.debian_url | Debian security tracker URL for the CVE, when applicable. | keyword |
| xm_cyber.vulnerability.device_found_on | Number of devices on which the CVE was detected in the environment. | long |
| xm_cyber.vulnerability.epss_percentile | Percentile of the current EPSS score — the proportion of all scored vulnerabilities at or below this score. | double |
| xm_cyber.vulnerability.epss_probability | Probability of exploitation in the wild within 30 days, in the range 0..1. | double |
| xm_cyber.vulnerability.epss_score | Raw EPSS exploitation likelihood score, in the range 0..1. | double |
| xm_cyber.vulnerability.first_detected | Timestamp of the first detection of the vulnerability. | date |
| xm_cyber.vulnerability.has_attack_technique | Whether XM Cyber has built an attack-technique simulation for this vulnerability. | boolean |
| xm_cyber.vulnerability.in_cisa_kev | Whether the vulnerability appears in CISA's Known Exploited Vulnerabilities (KEV) catalog. | boolean |
| xm_cyber.vulnerability.in_exploit_db | Whether public exploit code exists in the Exploit-DB database. | boolean |
| xm_cyber.vulnerability.msrc_url | Microsoft Security Response Center URL for the CVE, when applicable. | keyword |
| xm_cyber.vulnerability.nvd_url | National Vulnerability Database (NVD) URL for the CVE. | keyword |
| xm_cyber.vulnerability.oracle_url | Oracle security CVE URL, when applicable. | keyword |
| xm_cyber.vulnerability.products | Number of products affected by the CVE. | long |
| xm_cyber.vulnerability.published_date | Date the CVE was first published in NVD. | date |
| xm_cyber.vulnerability.red_hat_url | Red Hat security CVE URL, when applicable. | keyword |
| xm_cyber.vulnerability.severity | Numeric severity score returned by the XM Cyber VRM API. | long |
| xm_cyber.vulnerability.suse_url | SUSE security CVE URL, when applicable. | keyword |
| xm_cyber.vulnerability.ubuntu_url | Ubuntu security CVE URL, when applicable. | keyword |
Example
{
    "@timestamp": "2026-09-07T01:32:06.000Z",
    "agent": {
        "ephemeral_id": "58433550-4bc3-414f-8e32-cfeeb7ffa8cf",
        "id": "2ced4344-3533-4032-a63e-4b65b1a8bcbb",
        "name": "elastic-agent-73817",
        "type": "filebeat",
        "version": "8.19.0"
    },
    "data_stream": {
        "dataset": "xm_cyber.vulnerability",
        "namespace": "97053",
        "type": "logs"
    },
    "ecs": {
        "version": "9.5.0"
    },
    "elastic_agent": {
        "id": "2ced4344-3533-4032-a63e-4b65b1a8bcbb",
        "snapshot": false,
        "version": "8.19.0"
    },
    "event": {
        "agent_id_status": "verified",
        "category": [
            "vulnerability"
        ],
        "dataset": "xm_cyber.vulnerability",
        "ingested": "2026-09-22T11:35:39Z",
        "kind": "event",
        "original": "{\"AmazonLinuxURL\":\"https://explore.alas.aws.amazon.com/CVE-2013-6629.html\",\"CVEOrgURL\":\"https://www.cve.org/CVERecord?id=CVE-2013-6629\",\"DebianURL\":\"https://security-tracker.debian.org/tracker/CVE-2013-6629\",\"MSRCURL\":\"https://msrc.microsoft.com/update-guide/vulnerability/CVE-2013-6629\",\"NVDURL\":\"https://nvd.nist.gov/vuln/detail/CVE-2013-6629\",\"OracleURL\":\"\",\"RedHatURL\":\"https://access.redhat.com/security/cve/CVE-2013-6629\",\"SUSEURL\":\"https://www.suse.com/security/cve/CVE-2013-6629.html\",\"UbuntuURL\":\"\",\"chokePointFoundOn\":1,\"criticalAssetsAtRisk\":29,\"criticalAssetsFoundOn\":1,\"cve\":\"CVE-2013-6629\",\"cvss2\":5,\"cvss2Vector\":\"AV:N/AC:M/Au:N/C:P/I:N/A:N\",\"cvss30\":0,\"cvss31\":0,\"cvss31Vector\":\"\",\"cvss3Vector\":\"\",\"cvss4\":0,\"cvss4Vector\":\"\",\"description\":\"The get_sos function in jdmarker.c in libjpeg does not check for certain duplications of component data, which allows remote attackers to obtain sensitive information via a crafted JPEG image.\",\"deviceFoundOn\":18,\"epssPercentile\":0.95322,\"epssProbability\":0.10117,\"epssScore\":0.10117,\"firstDetected\":\"2025-04-03T00:00:00.000Z\",\"hasAttackTechnique\":false,\"inCisaKev\":false,\"inExploitDb\":false,\"lastDataUpdate\":\"2026-09-07T01:32:06.000Z\",\"products\":2,\"publishedDate\":\"2013-11-19T00:00:00.000Z\",\"severity\":20,\"severityLevel\":\"Medium\"}",
        "type": [
            "info"
        ]
    },
    "input": {
        "type": "cel"
    },
    "tags": [
        "preserve_original_event",
        "forwarded",
        "xm_cyber-vulnerability"
    ],
    "vulnerability": {
        "classification": "CVSS",
        "description": "The get_sos function in jdmarker.c in libjpeg does not check for certain duplications of component data, which allows remote attackers to obtain sensitive information via a crafted JPEG image.",
        "enumeration": "CVE",
        "id": "CVE-2013-6629",
        "score": {
            "base": 5,
            "version": "2.0"
        },
        "severity": "medium"
    },
    "xm_cyber": {
        "vulnerability": {
            "amazon_linux_url": "https://explore.alas.aws.amazon.com/CVE-2013-6629.html",
            "choke_point_found_on": 1,
            "critical_assets_at_risk": 29,
            "critical_assets_found_on": 1,
            "cve_org_url": "https://www.cve.org/CVERecord?id=CVE-2013-6629",
            "cvss2": 5,
            "cvss2vector": "AV:N/AC:M/Au:N/C:P/I:N/A:N",
            "cvss30": 0,
            "cvss31": 0,
            "cvss4": 0,
            "debian_url": "https://security-tracker.debian.org/tracker/CVE-2013-6629",
            "device_found_on": 18,
            "epss_percentile": 0.95322,
            "epss_probability": 0.10117,
            "epss_score": 0.10117,
            "first_detected": "2025-04-03T00:00:00.000Z",
            "has_attack_technique": false,
            "in_cisa_kev": false,
            "in_exploit_db": false,
            "msrc_url": "https://msrc.microsoft.com/update-guide/vulnerability/CVE-2013-6629",
            "nvd_url": "https://nvd.nist.gov/vuln/detail/CVE-2013-6629",
            "products": 2,
            "published_date": "2013-11-19T00:00:00.000Z",
            "red_hat_url": "https://access.redhat.com/security/cve/CVE-2013-6629",
            "severity": 20,
            "suse_url": "https://www.suse.com/security/cve/CVE-2013-6629.html"
        }
    }
}
Exported fields
| Field | Description | Type | ||
|---|---|---|---|---|
| @timestamp | Event timestamp. | date | ||
| data_stream.dataset | Data stream dataset. | constant_keyword | ||
| data_stream.namespace | Data stream namespace. | constant_keyword | ||
| data_stream.type | Data stream type. | constant_keyword | ||
| event.dataset | Event dataset. | constant_keyword | ||
| event.module | Event module. | constant_keyword | ||
| input.type | Type of filebeat input. | keyword | ||
| observer.product | The product name of the observer. | constant_keyword | ||
| observer.vendor | Vendor name of the observer. | constant_keyword | ||
| xm_cyber.entity_inventory.access_key_creation_date | Access key creation date (e.g. 2024-10-01T10:06:58.000Z). | date | ||
| xm_cyber.entity_inventory.account_id | AWS account identifier associated with the entity. | keyword | ||
| xm_cyber.entity_inventory.account_name | AWS account name associated with the entity. | keyword | ||
| xm_cyber.entity_inventory.activity_period | Activity period (e.g. Inactive: Never Used). | keyword | ||
| xm_cyber.entity_inventory.agent_type | Type of XM Cyber agent reporting the entity (when applicable). | keyword | ||
| xm_cyber.entity_inventory.agent_version.major | Agent version major component. | long | ||
| xm_cyber.entity_inventory.agent_version.minor | Agent version minor component. | long | ||
| xm_cyber.entity_inventory.agent_version.patch | Agent version patch component. | long | ||
| xm_cyber.entity_inventory.agent_version_str | XM Cyber agent version reported as a single string (e.g. 1.8.210). | keyword | ||
| xm_cyber.entity_inventory.arch | Hardware architecture reported for the entity. | keyword | ||
| xm_cyber.entity_inventory.architecture | Architecture (e.g. amd64). | keyword | ||
| xm_cyber.entity_inventory.arn | AWS resource ARN associated with the entity. | keyword | ||
| xm_cyber.entity_inventory.availability_zone | Availability zone (e.g. us-east-1b). | keyword | ||
| xm_cyber.entity_inventory.aws_tags | AWS tags attached to the entity (array of key/value pairs). | flattened | ||
| xm_cyber.entity_inventory.aws_user_name | Aws user name (e.g. example-user). | keyword | ||
| xm_cyber.entity_inventory.behavior_version | Behavior version (e.g. 7). | keyword | ||
| xm_cyber.entity_inventory.boot_id | Boot id (e.g. 004c6ece-9317-40e7-9a15-d24df7709df0). | keyword | ||
| xm_cyber.entity_inventory.canonical_name | Canonical name (e.g. vpn.example.com/). | keyword | ||
| xm_cyber.entity_inventory.category | Vendor category classification for the entity. | keyword | ||
| xm_cyber.entity_inventory.cloud_provider | Cloud provider (e.g. UNSUPPORTED_CLOUD_PROVIDER). | keyword | ||
| xm_cyber.entity_inventory.cluster_name | Cluster name (e.g. udoawsk8s). | keyword | ||
| xm_cyber.entity_inventory.cluster_role_rules.api_groups | Api groups (e.g. ["authorization.k8s.io"]). | keyword | ||
| xm_cyber.entity_inventory.cluster_role_rules.non_resource_urls | Non resource urls (e.g. ["/version/", "/apis/*", "/openapi", "/api", "/version", "/livez", "/apis", "/re). | keyword | ||
| xm_cyber.entity_inventory.cluster_role_rules.resource_names | Resource names (e.g. ["kubernetes.io/kube-apiserver-client"]). | keyword | ||
| xm_cyber.entity_inventory.cluster_role_rules.resources | Resources (e.g. ["localsubjectaccessreviews"]). | keyword | ||
| xm_cyber.entity_inventory.cluster_role_rules.verbs | Verbs (e.g. ["create"]). | keyword | ||
| xm_cyber.entity_inventory.cluster_role_rules_to_display | Cluster role rules to display (e.g. [ { "apiGroups": [ "authorization.k8s.io" ], "resources": [ ). | keyword | ||
| xm_cyber.entity_inventory.cluster_unique_id | Cluster unique id (e.g. 0617e36e156eacec443c98be905fb028ff739448fb763421528f2034ea3058a8). | keyword | ||
| xm_cyber.entity_inventory.cm_id | Configuration management identifier for the entity. | keyword | ||
| xm_cyber.entity_inventory.comments | Comments (e.g. []). | flattened | ||
| xm_cyber.entity_inventory.connection_counter | Number of times the entity has connected to XM Cyber. | long | ||
| xm_cyber.entity_inventory.container_runtime_version | Container runtime version (e.g. containerd://2.1.5-k3s1.33). | keyword | ||
| xm_cyber.entity_inventory.create_time | Create time (e.g. 2026-03-02T18:36:07.000Z). | date | ||
| xm_cyber.entity_inventory.created | Created (e.g. 2025-09-24T10:10:32.413Z). | date | ||
| xm_cyber.entity_inventory.created_by | Created by (e.g. arn:aws:sts<>000000000002:assumed-role/AWSReservedSSO_ExampleAccess_0123456789abcdef). | keyword | ||
| xm_cyber.entity_inventory.created_date | Created date (e.g. 2022-08-03T07:44:06.000Z). | date | ||
| xm_cyber.entity_inventory.creation_timestamp | Creation timestamp (e.g. 2025-12-04T14:10:01.000Z). | date | ||
| xm_cyber.entity_inventory.cred_type | Cred type (e.g. NTLM_HASH). | keyword | ||
| xm_cyber.entity_inventory.custom_properties.custom_labels | User-defined labels attached to the entity. | flattened | ||
| xm_cyber.entity_inventory.custom_properties.domain_workgroup.data | Domain or workgroup name. | keyword | ||
| xm_cyber.entity_inventory.custom_properties.domain_workgroup.type | Discriminator (e.g., domain, workgroup). | keyword | ||
| xm_cyber.entity_inventory.custom_properties.hardware_info.cpu_core_count | Number of CPU cores reported for the host. | long | ||
| xm_cyber.entity_inventory.custom_properties.hardware_info.cpu_count | Number of CPUs reported for the host. | long | ||
| xm_cyber.entity_inventory.custom_properties.hardware_info.cpu_manufacturer | CPU manufacturer string. | keyword | ||
| xm_cyber.entity_inventory.custom_properties.hardware_info.cpu_processor_type | CPU processor type string. | keyword | ||
| xm_cyber.entity_inventory.custom_properties.hardware_info.cpu_speed_mhz | CPU speed in MHz. | long | ||
| xm_cyber.entity_inventory.custom_properties.hardware_info.system_manufacturer | System manufacturer string. | keyword | ||
| xm_cyber.entity_inventory.custom_properties.hardware_info.system_model | System model string. | keyword | ||
| xm_cyber.entity_inventory.custom_properties.hardware_info.total_ram_mb | Total RAM in MB as reported by the vendor (string). | keyword | ||
| xm_cyber.entity_inventory.custom_properties.labels | Vendor-managed labels attached to the entity. | flattened | ||
| xm_cyber.entity_inventory.custom_properties.mac_addresses | MAC addresses reported for the entity. | keyword | ||
| xm_cyber.entity_inventory.custom_properties.ou_computer | Organisational unit path for the computer object. | keyword | ||
| xm_cyber.entity_inventory.custom_properties.ou_user | Organisational unit path for the user object. | keyword | ||
| xm_cyber.entity_inventory.custom_properties.sniffer_status | Current sniffer status string. | keyword | ||
| xm_cyber.entity_inventory.custom_properties.sniffer_status_changeable | Whether the sniffer status is user-changeable. | boolean | ||
| xm_cyber.entity_inventory.custom_properties.sniffer_status_configuration | Sniffer status configuration string. | keyword | ||
| xm_cyber.entity_inventory.custom_properties.subnet_info | Subnet information string when reported. | keyword | ||
| xm_cyber.entity_inventory.customer_id | XM Cyber customer identifier. | keyword | ||
| xm_cyber.entity_inventory.default_version | Default version (e.g. True). | boolean | ||
| xm_cyber.entity_inventory.deployment_type | Deployment type (e.g. ReplicaSet). | keyword | ||
| xm_cyber.entity_inventory.disabled | Whether the entity is disabled. | boolean | ||
| xm_cyber.entity_inventory.disabled_changed_at | Time at which the disabled state last changed. | date | ||
| xm_cyber.entity_inventory.disabled_reason | Reason the entity was disabled. | keyword | ||
| xm_cyber.entity_inventory.display_name | Human-readable display name for the entity. | keyword | ||
| xm_cyber.entity_inventory.distinguished_name | Distinguished name (e.g. DC=vpn,DC=example,DC=com). | keyword | ||
| xm_cyber.entity_inventory.dns_host_name | Dns host name (e.g. vpndc.vpn.example.com). | keyword | ||
| xm_cyber.entity_inventory.dns_policy | Dns policy (e.g. ClusterFirst). | keyword | ||
| xm_cyber.entity_inventory.domain_name | Domain name associated with the entity when reported. | keyword | ||
| xm_cyber.entity_inventory.domain_owner | Domain owner (e.g. 000000000002). | keyword | ||
| xm_cyber.entity_inventory.domain_sid | Domain sid (e.g. S-1-5-21-3955220616-103436932-1560667138). | keyword | ||
| xm_cyber.entity_inventory.dynamo_db_table_creation_date_time | Dynamo db table creation date time (e.g. 2021-10-26T07:59:54.362Z). | date | ||
| xm_cyber.entity_inventory.dynamo_db_table_item_count | Dynamo db table item count (e.g. 0). | long | ||
| xm_cyber.entity_inventory.dynamo_db_table_size_bytes | Dynamo db table size bytes (e.g. 0). | long | ||
| xm_cyber.entity_inventory.ebs_volume_attachments.attach_time | Attach time (e.g. 2026-03-18T14:45:23.000Z). | date | ||
| xm_cyber.entity_inventory.ebs_volume_attachments.delete_on_termination | Delete on termination (e.g. True). | boolean | ||
| xm_cyber.entity_inventory.ebs_volume_attachments.device | Device (e.g. /dev/sdb). | keyword | ||
| xm_cyber.entity_inventory.ebs_volume_attachments.ebs_card_index | Ebs card index (e.g. 0). | long | ||
| xm_cyber.entity_inventory.ebs_volume_attachments.instance_id | Instance id (e.g. i-0e03149a06907c827). | keyword | ||
| xm_cyber.entity_inventory.ebs_volume_attachments.state | State (e.g. attached). | keyword | ||
| xm_cyber.entity_inventory.ebs_volume_attachments.volume_id | Volume id (e.g. vol-00073da63bfe48dad). | keyword | ||
| xm_cyber.entity_inventory.ebs_volume_create_time | Ebs volume create time (e.g. 2026-03-18T14:45:23.445Z). | date | ||
| xm_cyber.entity_inventory.ebs_volume_id | Ebs volume id (e.g. vol-00073da63bfe48dad). | keyword | ||
| xm_cyber.entity_inventory.ebs_volume_iops | Ebs volume iops (e.g. 100). | long | ||
| xm_cyber.entity_inventory.ebs_volume_kms_key_id | Ebs volume kms key id (e.g. arn:aws:kms:us-east-1:000000000002:key/00000000-0000-0000-0000-000000000003). | keyword | ||
| xm_cyber.entity_inventory.ebs_volume_multi_attach_enabled | Ebs volume multi attach enabled (e.g. False). | boolean | ||
| xm_cyber.entity_inventory.ebs_volume_size | Ebs volume size (e.g. 32). | long | ||
| xm_cyber.entity_inventory.ebs_volume_snapshot_id | Ebs volume snapshot id (e.g. snap-02b09548e23285e0b). | keyword | ||
| xm_cyber.entity_inventory.ebs_volume_volume_type | Ebs volume volume type (e.g. gp2). | keyword | ||
| xm_cyber.entity_inventory.ec2auto_scale_group | Ec2auto scale group (e.g. No AutoScale). | keyword | ||
| xm_cyber.entity_inventory.ec2instance_id | Ec2instance id (e.g. i-00d0af67458cb4d24). | keyword | ||
| xm_cyber.entity_inventory.ec2internet_access_via_lb | Ec2internet access via lb (e.g. No). | keyword | ||
| xm_cyber.entity_inventory.ec2internet_access_via_vpc | Ec2internet access via vpc (e.g. Yes). | keyword | ||
| xm_cyber.entity_inventory.ec2key_name | Ec2key name (e.g. Itay-key). | keyword | ||
| xm_cyber.entity_inventory.ec2private_ip_address | Ec2private ip address (e.g. 192.168.2.102). | ip | ||
| xm_cyber.entity_inventory.ec2public_ip_address | Ec2public ip address (e.g. 3.69.20.107). | ip | ||
| xm_cyber.entity_inventory.ec2security_groups.group_id | Group id (e.g. sg-08415938e0f0debf7). | keyword | ||
| xm_cyber.entity_inventory.ec2security_groups.group_name | Group name (e.g. itay-subnet2-SecurityGroup). | keyword | ||
| xm_cyber.entity_inventory.ec2subnet_id | Ec2subnet id (e.g. subnet-01b0888a263591ac6). | keyword | ||
| xm_cyber.entity_inventory.ec2tags.key | Key (e.g. Name). | keyword | ||
| xm_cyber.entity_inventory.ec2tags.value | Value (e.g. win11). | keyword | ||
| xm_cyber.entity_inventory.ec2vpc_id | Ec2vpc id (e.g. vpc-0e9f502a4d1b70878). | keyword | ||
| xm_cyber.entity_inventory.ecr_repository_arn | Ecr repository arn (e.g. arn:aws:ecr:ca-central-1:000000000003:repository/example-security). | keyword | ||
| xm_cyber.entity_inventory.ecr_repository_creation_date | Ecr repository creation date (e.g. 2024-05-16T14:21:23.373Z). | date | ||
| xm_cyber.entity_inventory.ecr_repository_image_scanning_on_push | Ecr repository image scanning on push (e.g. False). | boolean | ||
| xm_cyber.entity_inventory.ecr_repository_image_tag_mutability | Ecr repository image tag mutability (e.g. IMMUTABLE). | keyword | ||
| xm_cyber.entity_inventory.ecr_repository_images.artifact_media_type | Artifact media type (e.g. application/vnd.docker.container.image.v1+json). | keyword | ||
| xm_cyber.entity_inventory.ecr_repository_images.image_digest | Image digest (e.g. sha256:4576dc9c5c25b82b3c9af9e015772bef0d1885c65af40ee57635efa27762fbc7). | keyword | ||
| xm_cyber.entity_inventory.ecr_repository_images.image_manifest_media_type | Image manifest media type (e.g. application/vnd.docker.distribution.manifest.v2+json). | keyword | ||
| xm_cyber.entity_inventory.ecr_repository_images.image_pushed_at | Image pushed at (e.g. 2024-07-01T10:43:58.000Z). | date | ||
| xm_cyber.entity_inventory.ecr_repository_images.image_size_in_bytes | Image size in bytes (e.g. 87302242). | long | ||
| xm_cyber.entity_inventory.ecr_repository_images.image_status | Image status (e.g. ACTIVE). | keyword | ||
| xm_cyber.entity_inventory.ecr_repository_images.image_tags | Image tags (e.g. ["pr-148"]). | keyword | ||
| xm_cyber.entity_inventory.ecr_repository_images.last_recorded_pull_time | Last recorded pull time (e.g. 2026-05-06T23:37:16.835Z). | date | ||
| xm_cyber.entity_inventory.ecr_repository_images.registry_id | Registry id (e.g. 000000000002). | keyword | ||
| xm_cyber.entity_inventory.ecr_repository_images.repository_name | Repository name (e.g. example-api-keys-manager). | keyword | ||
| xm_cyber.entity_inventory.ecr_repository_name | Ecr repository name (e.g. example-security). | keyword | ||
| xm_cyber.entity_inventory.ecr_repository_registry_id | Ecr repository registry id (e.g. 000000000003). | keyword | ||
| xm_cyber.entity_inventory.ecr_repository_uri | Ecr repository uri (e.g. 000000000003.dkr.ecr.ca-central-1.amazonaws.com/example-security). | keyword | ||
| xm_cyber.entity_inventory.elasticache_cache_cache_security_groups | Elasticache cache cache security groups (e.g. 0). | long | ||
| xm_cyber.entity_inventory.elasticache_cache_cluster_auth_token | Elasticache cache cluster auth token (e.g. False). | boolean | ||
| xm_cyber.entity_inventory.elasticache_cache_cluster_create_time | Elasticache cache cluster create time (e.g. 2026-02-18T08:35:45.012Z). | date | ||
| xm_cyber.entity_inventory.elasticache_cache_cluster_id | Elasticache cache cluster id (e.g. redis-maor-0002-002). | keyword | ||
| xm_cyber.entity_inventory.elasticache_cache_cluster_num_cache_nodes | Elasticache cache cluster num cache nodes (e.g. 1). | long | ||
| xm_cyber.entity_inventory.elasticache_cache_cluster_preferred_availability_zone | Elasticache cache cluster preferred availability zone (e.g. eu-west-1b). | keyword | ||
| xm_cyber.entity_inventory.elasticache_cache_cluster_transit_encryption | Elasticache cache cluster transit encryption (e.g. True). | boolean | ||
| xm_cyber.entity_inventory.elasticache_cache_cluster_vpc_id | Elasticache cache cluster vpc id (e.g. vpc-6e8b8708). | keyword | ||
| xm_cyber.entity_inventory.elasticache_cache_node_type | Elasticache cache node type (e.g. cache.r7g.xlarge). | keyword | ||
| xm_cyber.entity_inventory.elasticache_cache_parameter_group_name | Elasticache cache parameter group name (e.g. default.redis7.cluster.on). | keyword | ||
| xm_cyber.entity_inventory.elasticache_cache_security_groups | Elasticache cache security groups (e.g. 1). | long | ||
| xm_cyber.entity_inventory.elasticache_cache_subnet_group_name | Elasticache cache subnet group name (e.g. maor). | keyword | ||
| xm_cyber.entity_inventory.elb_v2load_balancer_name | Elb v2load balancer name (e.g. example-97kjg-ext). | keyword | ||
| xm_cyber.entity_inventory.elb_v2target_group_name | Elb v2target group name (e.g. example-97kjg-aext). | keyword | ||
| xm_cyber.entity_inventory.encryption | Encryption (e.g. True). | boolean | ||
| xm_cyber.entity_inventory.encryption_key | Encryption key (e.g. arn:aws:kms:us-east-1:000000000002:alias/aws/s3). | keyword | ||
| xm_cyber.entity_inventory.encryption_type | Encryption type (e.g. AES256). | keyword | ||
| xm_cyber.entity_inventory.endpoint_address | Endpoint address (e.g. redshift-cluster.c8ri4vjslsze.us-west-1.redshift.amazonaws.com). | keyword | ||
| xm_cyber.entity_inventory.endpoint_port | Endpoint port (e.g. 5439). | long | ||
| xm_cyber.entity_inventory.engine | Engine (e.g. redis). | keyword | ||
| xm_cyber.entity_inventory.engine_version | Engine version (e.g. 7.1.0). | keyword | ||
| xm_cyber.entity_inventory.entity_details.id | Inner entity details identifier. | keyword | ||
| xm_cyber.entity_inventory.entity_details.is_asset | Whether the inner entity is marked as a critical asset. | boolean | ||
| xm_cyber.entity_inventory.entity_details.name | Inner entity details name. | keyword | ||
| xm_cyber.entity_inventory.entity_details.sub_type | Inner entity details subtype value. | keyword | ||
| xm_cyber.entity_inventory.entity_details.sub_type_display_name | Inner entity details subtype display label. | keyword | ||
| xm_cyber.entity_inventory.entity_type | Entity type discriminator (e.g., agent, azureUser, awsSsmParameter). | keyword | ||
| xm_cyber.entity_inventory.environment_image | Environment image (e.g. aws/codebuild/amazonlinux-x86_64-standard:5.0). | keyword | ||
| xm_cyber.entity_inventory.environment_type | Environment type (e.g. LINUX_CONTAINER). | keyword | ||
| xm_cyber.entity_inventory.expire_at | Expire at (e.g. 2026-07-05T10:41:14.000Z). | date | ||
| xm_cyber.entity_inventory.first_seen | First observation time reported for the entity. | date | ||
| xm_cyber.entity_inventory.fqdn | Fqdn (e.g. vpndc.vpn.example.com). | keyword | ||
| xm_cyber.entity_inventory.gp_link | Gp link (e.g. [LDAP://CN={31B2F340-016D-11D2-945F-00C04FB984F9},CN=Policies,CN=System,DC=vpn,D). | keyword | ||
| xm_cyber.entity_inventory.guid | Guid (e.g. {C624BD51-11AA-4646-BD13-C752853BD2DA}). | keyword | ||
| xm_cyber.entity_inventory.has_matching_sid | Whether the entity has a matching SID in another directory source. | boolean | ||
| xm_cyber.entity_inventory.has_update_available | Whether an update is available for the entity (e.g., agent upgrade). | boolean | ||
| xm_cyber.entity_inventory.host_ip | Host ip (e.g. 192.168.5.97). | ip | ||
| xm_cyber.entity_inventory.iam_unique_id | Iam unique id (e.g. AROA5HCBCYKFFYRQOIDLG). | keyword | ||
| xm_cyber.entity_inventory.id | Vendor-provided unique identifier for the entity record. | keyword | ||
| xm_cyber.entity_inventory.image_pull_secrets_name | Image pull secrets name (e.g. ["registry-secret"]). | keyword | ||
| xm_cyber.entity_inventory.image_pull_secrets_name_to_display | Image pull secrets name to display (e.g. [ null ]). | keyword | ||
| xm_cyber.entity_inventory.images | Images (e.g. [ "example/security-agent:1.50.1" ]). | keyword | ||
| xm_cyber.entity_inventory.images_to_display | Images to display (e.g. [ "docker.io/rancher/mirrored-metrics-server@sha256:89258156d0e9af60403eafd44d). | keyword | ||
| xm_cyber.entity_inventory.imported_labels | Imported labels associated with the entity. | keyword | ||
| xm_cyber.entity_inventory.installation_id | Installation identifier reported for the entity. | keyword | ||
| xm_cyber.entity_inventory.instance_id | Instance id (e.g. i-00d0af67458cb4d24). | keyword | ||
| xm_cyber.entity_inventory.ipv4 | IPv4 addresses reported for the entity as strings. | keyword | ||
| xm_cyber.entity_inventory.ipv4_buffer.data | IPv4 address data as an array of integers. | long | ||
| xm_cyber.entity_inventory.ipv4_buffer.type | Buffer indicator value, typically "Buffer". | keyword | ||
| xm_cyber.entity_inventory.ipv4num | IPv4 addresses reported for the entity as 32-bit integers. | long | ||
| xm_cyber.entity_inventory.ipv4str | IPv4 addresses reported for the entity as strings. | ip | ||
| xm_cyber.entity_inventory.ipv6 | IPv6 addresses reported for the entity. | keyword | ||
| xm_cyber.entity_inventory.ipv6_buffer.data | IPv6 address data as an array of integers. | long | ||
| xm_cyber.entity_inventory.ipv6_buffer.type | Buffer indicator value, typically "Buffer". | keyword | ||
| xm_cyber.entity_inventory.ipv6str | IPv6 addresses reported for the entity as strings. | ip | ||
| xm_cyber.entity_inventory.is_highly_privileged | Is highly privileged (e.g. False). | boolean | ||
| xm_cyber.entity_inventory.is_mfaenabled | Is mfaenabled (e.g. False). | boolean | ||
| xm_cyber.entity_inventory.is_owner | Is owner (e.g. No). | keyword | ||
| xm_cyber.entity_inventory.is_public | Is public (e.g. True). | boolean | ||
| xm_cyber.entity_inventory.is_running | Is running (e.g. False). | boolean | ||
| xm_cyber.entity_inventory.is_valid | Is valid (e.g. True). | boolean | ||
| xm_cyber.entity_inventory.is_watched | Is watched (e.g. False). | boolean | ||
| xm_cyber.entity_inventory.kernel_version | Kernel version (e.g. 6.17.5-200.fc42.x86_64). | keyword | ||
| xm_cyber.entity_inventory.kms_key_aliases | KMS key alias names associated with the entity. | keyword | ||
| xm_cyber.entity_inventory.kms_key_creation_date | Time at which the KMS key was created. | date | ||
| xm_cyber.entity_inventory.kms_key_description | KMS key description string. | keyword | ||
| xm_cyber.entity_inventory.kms_key_manager | KMS key manager (e.g., AWS, CUSTOMER). | keyword | ||
| xm_cyber.entity_inventory.kms_key_origin | KMS key origin (e.g., AWS_KMS, EXTERNAL). | keyword | ||
| xm_cyber.entity_inventory.kms_key_state | Current KMS key state. | keyword | ||
| xm_cyber.entity_inventory.kms_key_usage | KMS key usage (e.g., ENCRYPT_DECRYPT, SIGN_VERIFY). | keyword | ||
| xm_cyber.entity_inventory.kube_proxy_version | Kube proxy version (e.g. ). | keyword | ||
| xm_cyber.entity_inventory.kubelet_version | Kubelet version (e.g. v1.33.6+k3s1). | keyword | ||
| xm_cyber.entity_inventory.kubernetes_annotations | Kubernetes annotations (e.g. {}). | keyword | ||
| xm_cyber.entity_inventory.kubernetes_labels | Kubernetes labels (e.g. ["name: security-agent", "app.kubernetes.io/instance: example-security-agent", "pod-template-). | keyword | ||
| xm_cyber.entity_inventory.labels | Vendor labels attached to the entity (array of id/type pairs). | flattened | ||
| xm_cyber.entity_inventory.lambda_description | Lambda description (e.g. dddd). | keyword | ||
| xm_cyber.entity_inventory.lambda_runtime | Lambda runtime (e.g. nodejs20.x). | keyword | ||
| xm_cyber.entity_inventory.lambda_version | Lambda version (e.g. $LATEST). | keyword | ||
| xm_cyber.entity_inventory.last_activity_date | Last activity date (e.g. 2025-04-03T22:20:42.000Z). | date | ||
| xm_cyber.entity_inventory.last_connection_time | Last time the entity (typically a managed device) connected to XM Cyber. | date | ||
| xm_cyber.entity_inventory.last_disconnection_reason | Reason the entity last disconnected. | keyword | ||
| xm_cyber.entity_inventory.last_modified | Last modified (e.g. 2025-09-24T10:10:32.413Z). | date | ||
| xm_cyber.entity_inventory.last_reboot_time | Last reboot time reported for the entity. | date | ||
| xm_cyber.entity_inventory.last_running_time | Last running time (e.g. 2026-05-06T09:05:15.079Z). | date | ||
| xm_cyber.entity_inventory.last_status_change | Time of the most recent status change for the entity. | date | ||
| xm_cyber.entity_inventory.last_updated_at | Time at which the entity record was last updated by XM Cyber. | date | ||
| xm_cyber.entity_inventory.latest_possible_agent_version.build | Build (e.g. 0). | long | ||
| xm_cyber.entity_inventory.latest_possible_agent_version.major | Latest possible agent version major component. | long | ||
| xm_cyber.entity_inventory.latest_possible_agent_version.minor | Latest possible agent version minor component. | long | ||
| xm_cyber.entity_inventory.latest_possible_agent_version.patch | Latest possible agent version patch component. | long | ||
| xm_cyber.entity_inventory.latest_possible_agent_version_str | Latest agent version available for the entity as a string. | keyword | ||
| xm_cyber.entity_inventory.launch_template_id | Launch template id (e.g. lt-056da5bfafc08dfb7). | keyword | ||
| xm_cyber.entity_inventory.launch_template_name | Launch template name (e.g. shani). | keyword | ||
| xm_cyber.entity_inventory.machine_account_quota | Machine account quota (e.g. 10). | long | ||
| xm_cyber.entity_inventory.machine_id | Vendor machine identifier when reported. | keyword | ||
| xm_cyber.entity_inventory.metadata | Metadata associated with the entity. | flattened | ||
| xm_cyber.entity_inventory.name | Vendor name of the entity (hostname for devices, principal name for identities, etc.). | keyword | ||
| xm_cyber.entity_inventory.name_uppercase | Entity name normalised to uppercase for case-insensitive matching. | keyword | ||
| xm_cyber.entity_inventory.namespace | Namespace (e.g. haxm). | keyword | ||
| xm_cyber.entity_inventory.node_images.names | Names (e.g. ["docker.io/rancher/mirrored-metrics-server@sha256:89258156d0e9af60403eafd44da96). | keyword | ||
| xm_cyber.entity_inventory.node_images.size_in_bytes | Size in bytes (e.g. 22493802). | long | ||
| xm_cyber.entity_inventory.node_name | Node name (e.g. udoawslinux03.eu-north-1.compute.internal). | keyword | ||
| xm_cyber.entity_inventory.nodes_in_node_group_count | Nodes in node group count (e.g. 0). | long | ||
| xm_cyber.entity_inventory.not_included_in_attacks | Whether the entity is excluded from attack-path simulations. | boolean | ||
| xm_cyber.entity_inventory.not_reported_by_south_at | Not reported by south at (e.g. null). | keyword | ||
| xm_cyber.entity_inventory.object_class | Object class (e.g. domainDNS). | keyword | ||
| xm_cyber.entity_inventory.organization_id | XM Cyber organization identifier. | keyword | ||
| xm_cyber.entity_inventory.os.distribution_name | OS distribution name (e.g., centos, ubuntu). | keyword | ||
| xm_cyber.entity_inventory.os.distribution_version | OS distribution version string. | keyword | ||
| xm_cyber.entity_inventory.os.name | Full OS name string as reported by XM Cyber. | keyword | ||
| xm_cyber.entity_inventory.os.service_pack.build | OS service pack build component. | long | ||
| xm_cyber.entity_inventory.os.service_pack.major | OS service pack major component. | long | ||
| xm_cyber.entity_inventory.os.service_pack.minor | OS service pack minor component. | long | ||
| xm_cyber.entity_inventory.os.service_pack.patch | OS service pack patch component. | long | ||
| xm_cyber.entity_inventory.os.version.build | OS version build component. | long | ||
| xm_cyber.entity_inventory.os.version.major | OS version major component. | long | ||
| xm_cyber.entity_inventory.os.version.minor | OS version minor component. | long | ||
| xm_cyber.entity_inventory.os.version.patch | OS version patch component. | long | ||
| xm_cyber.entity_inventory.os_image | Os image (e.g. Fedora Linux 42 (Adams)). | keyword | ||
| xm_cyber.entity_inventory.os_type | Top-level OS type discriminator string. | keyword | ||
| xm_cyber.entity_inventory.os_version_str | Os version str (e.g. 10.0.19045). | keyword | ||
| xm_cyber.entity_inventory.owner_references.block_owner_deletion | Block owner deletion (e.g. True). | boolean | ||
| xm_cyber.entity_inventory.owner_references.controller | Controller (e.g. True). | boolean | ||
| xm_cyber.entity_inventory.owner_references.kind | Kind (e.g. ReplicaSet). | keyword | ||
| xm_cyber.entity_inventory.owner_references.name | Name (e.g. example-security-agent-85f5586455). | keyword | ||
| xm_cyber.entity_inventory.owner_references.uid | Uid (e.g. 8c5aa788-5284-4807-a918-f1d3d9445c7f). | keyword | ||
| xm_cyber.entity_inventory.owner_references_to_display | Owner references to display (e.g. [ { "blockOwnerDeletion": true, "controller": true, "kind": "Repli). | keyword | ||
| xm_cyber.entity_inventory.password_hash | Password hash (e.g. 147317149651d67246e5e5f0de7f72b6c26ee1855f5eb10d33ace6df8adb6ed39742f1523b7e9613). | keyword | ||
| xm_cyber.entity_inventory.pod_ip | Pod ip (e.g. 10.42.0.10). | ip | ||
| xm_cyber.entity_inventory.product_type | Vendor product type string. | keyword | ||
| xm_cyber.entity_inventory.public | Public (e.g. False). | boolean | ||
| xm_cyber.entity_inventory.redshift_cluster_availability_status | Redshift cluster availability status (e.g. Available). | keyword | ||
| xm_cyber.entity_inventory.redshift_cluster_cluster_version | Redshift cluster cluster version (e.g. 1.0). | keyword | ||
| xm_cyber.entity_inventory.redshift_cluster_create_time | Redshift cluster create time (e.g. 2025-11-10T09:42:02.804Z). | date | ||
| xm_cyber.entity_inventory.redshift_cluster_db_name | Redshift cluster db name (e.g. dev). | keyword | ||
| xm_cyber.entity_inventory.redshift_cluster_identifier | Redshift cluster identifier (e.g. redshift-cluster). | keyword | ||
| xm_cyber.entity_inventory.redshift_cluster_number_of_nodes | Redshift cluster number of nodes (e.g. 1). | long | ||
| xm_cyber.entity_inventory.redshift_cluster_private_ipaddress | Redshift cluster private ipaddress (e.g. 10.0.1.198). | ip | ||
| xm_cyber.entity_inventory.redshift_cluster_public_ipaddress | Redshift cluster public ipaddress (e.g. 52.8.99.248). | ip | ||
| xm_cyber.entity_inventory.redshift_cluster_subnet_group_name | Redshift cluster subnet group name (e.g. discoverandresetpasswordnotpublicredshiftwithreachableec2-redshiftvpcsubnetgroup). | keyword | ||
| xm_cyber.entity_inventory.redshift_cluster_vpc_id | Redshift cluster vpc id (e.g. vpc-05de6e857850c05f3). | keyword | ||
| xm_cyber.entity_inventory.region | Cloud region associated with the entity. | keyword | ||
| xm_cyber.entity_inventory.remote_address | Remote address reported for the entity. | keyword | ||
| xm_cyber.entity_inventory.repository_name | Repository name (e.g. test). | keyword | ||
| xm_cyber.entity_inventory.resource_version | Resource version (e.g. 1070). | keyword | ||
| xm_cyber.entity_inventory.restart_policy | Restart policy (e.g. Always). | keyword | ||
| xm_cyber.entity_inventory.role_description | Role description (e.g. Allows EC2 instances to call AWS services on your behalf.). | keyword | ||
| xm_cyber.entity_inventory.role_max_session_duration | Role max session duration (e.g. 3600). | long | ||
| xm_cyber.entity_inventory.rule_display_name | Display name of the matching rule when reported. | keyword | ||
| xm_cyber.entity_inventory.rules.api_groups | Api groups (e.g. [""]). | keyword | ||
| xm_cyber.entity_inventory.rules.resource_names | Resource names (e.g. ["kube-controller-manager"]). | keyword | ||
| xm_cyber.entity_inventory.rules.resources | Resources (e.g. ["configmaps"]). | keyword | ||
| xm_cyber.entity_inventory.rules.verbs | Verbs (e.g. ["watch"]). | keyword | ||
| xm_cyber.entity_inventory.rules_to_display | Rules to display (e.g. [ { "apiGroups": [ "" ], "resources": [ "configmaps" ). | keyword | ||
| xm_cyber.entity_inventory.secret_description | Description of the AWS Secrets Manager secret. | keyword | ||
| xm_cyber.entity_inventory.secret_kms_key_id | KMS key identifier protecting the secret. | keyword | ||
| xm_cyber.entity_inventory.secret_names | Secret names (e.g. []). | keyword | ||
| xm_cyber.entity_inventory.secret_rotation_lambda_arn | Secret rotation lambda arn (e.g. arn:aws:lambda:eu-west-1:000000000002:function:exampleRotation). | keyword | ||
| xm_cyber.entity_inventory.secret_type | Secret type (e.g. helm.sh/release.v1). | keyword | ||
| xm_cyber.entity_inventory.security_context | Security context (e.g. { "fsGroup": 1031, "runAsNonRoot": true, "runAsUser": 1031, "seccompProf). | keyword | ||
| xm_cyber.entity_inventory.security_flags | Security flags reported for the entity. | flattened | ||
| xm_cyber.entity_inventory.security_flags_for_display.expires | Expiration value of the security flag, if any. | keyword | ||
| xm_cyber.entity_inventory.security_flags_for_display.key | Security flag key. | keyword | ||
| xm_cyber.entity_inventory.security_flags_for_display.reason | Security flag reason. | keyword | ||
| xm_cyber.entity_inventory.security_group_name | Security group name (e.g. vulnerable-sg-0cb516b). | keyword | ||
| xm_cyber.entity_inventory.service_account | Service account (e.g. security-service-account). | keyword | ||
| xm_cyber.entity_inventory.service_account_name | Service account name (e.g. security-service-account). | keyword | ||
| xm_cyber.entity_inventory.service_role | Service role (e.g. arn:aws:iam000000000002:role/service-role/codebuild-example-service-role). | keyword | ||
| xm_cyber.entity_inventory.service_spec.allocate_load_balancer_node_ports | Allocate load balancer node ports (e.g. True). | boolean | ||
| xm_cyber.entity_inventory.service_spec.cluster_ip | Cluster ip (e.g. 10.43.227.17). | ip | ||
| xm_cyber.entity_inventory.service_spec.cluster_ips | Cluster ips (e.g. ["10.43.227.17"]). | ip | ||
| xm_cyber.entity_inventory.service_spec.external_ips | External ips (e.g. []). | keyword | ||
| xm_cyber.entity_inventory.service_spec.external_name | External name (e.g. ). | keyword | ||
| xm_cyber.entity_inventory.service_spec.external_traffic_policy | External traffic policy (e.g. Cluster). | keyword | ||
| xm_cyber.entity_inventory.service_spec.health_check_node_port | Health check node port (e.g. 0). | long | ||
| xm_cyber.entity_inventory.service_spec.internal_traffic_policy | Internal traffic policy (e.g. Cluster). | keyword | ||
| xm_cyber.entity_inventory.service_spec.ip_families | Ip families (e.g. ["IPv4"]). | keyword | ||
| xm_cyber.entity_inventory.service_spec.ip_family_policy | Ip family policy (e.g. PreferDualStack). | keyword | ||
| xm_cyber.entity_inventory.service_spec.load_balancer_class | Load balancer class (e.g. ). | keyword | ||
| xm_cyber.entity_inventory.service_spec.load_balancer_ip | Load balancer ip (e.g. ). | keyword | ||
| xm_cyber.entity_inventory.service_spec.load_balancer_source_ranges | Load balancer source ranges (e.g. []). | keyword | ||
| xm_cyber.entity_inventory.service_spec.ports.app_protocol | App protocol (e.g. ). | keyword | ||
| xm_cyber.entity_inventory.service_spec.ports.name | Name (e.g. web). | keyword | ||
| xm_cyber.entity_inventory.service_spec.ports.node_port | Node port (e.g. 32570). | long | ||
| xm_cyber.entity_inventory.service_spec.ports.port | Port (e.g. 80). | long | ||
| xm_cyber.entity_inventory.service_spec.ports.protocol | Protocol (e.g. TCP). | keyword | ||
| xm_cyber.entity_inventory.service_spec.ports.target_port | Target port (e.g. web). | keyword | ||
| xm_cyber.entity_inventory.service_spec.publish_not_ready_addresses | Publish not ready addresses (e.g. False). | boolean | ||
| xm_cyber.entity_inventory.service_spec.selector | Selector (e.g. {"app.kubernetes.io/instance": "traefik-kube-system", "app.kubernetes.io/name": ). | flattened | ||
| xm_cyber.entity_inventory.service_spec.session_affinity | Session affinity (e.g. None). | keyword | ||
| xm_cyber.entity_inventory.service_spec.session_affinity_config.client_ip.timeout_seconds | Timeout seconds (e.g. 0). | long | ||
| xm_cyber.entity_inventory.service_spec.type | Type (e.g. LoadBalancer). | keyword | ||
| xm_cyber.entity_inventory.sid | Sid (e.g. S-1-5-21-3955220616-103436932-1560667138). | keyword | ||
| xm_cyber.entity_inventory.south_owner | South component owner identifier when reported. | keyword | ||
| xm_cyber.entity_inventory.spec.controller | Controller (e.g. traefik.io/ingress-controller). | keyword | ||
| xm_cyber.entity_inventory.spec.parameters.group | Group (e.g. ). | keyword | ||
| xm_cyber.entity_inventory.spec.parameters.kind | Kind (e.g. ). | keyword | ||
| xm_cyber.entity_inventory.spec.parameters.name | Name (e.g. ). | keyword | ||
| xm_cyber.entity_inventory.spec.parameters.namespace | Namespace (e.g. ). | keyword | ||
| xm_cyber.entity_inventory.sqs_queue_arn | Sqs queue arn (e.g. arn:aws:sqs:us-east-1:000000000002:example-queue). | keyword | ||
| xm_cyber.entity_inventory.sqs_queue_created_timestamp | Sqs queue created timestamp (e.g. 1735769555). | keyword | ||
| xm_cyber.entity_inventory.sqs_queue_last_modified_date | Sqs queue last modified date (e.g. 1970-01-21T02:09:29.642Z). | date | ||
| xm_cyber.entity_inventory.sqs_queue_last_modified_timestamp | Sqs queue last modified timestamp (e.g. 1735769642). | keyword | ||
| xm_cyber.entity_inventory.sqs_queue_name | Sqs queue name (e.g. roi-yadgar-queue). | keyword | ||
| xm_cyber.entity_inventory.sqs_queue_url | Sqs queue url (e.g. https://sqs.us-east-1.amazonaws.com/000000000002/example-queue). | keyword | ||
| xm_cyber.entity_inventory.ssm_parameter_data_type | SSM parameter data type. | keyword | ||
| xm_cyber.entity_inventory.ssm_parameter_description | SSM parameter description. | keyword | ||
| xm_cyber.entity_inventory.ssm_parameter_key_id | KMS key id used to encrypt the SSM parameter. | keyword | ||
| xm_cyber.entity_inventory.ssm_parameter_last_modified_date | Last modification time of the SSM parameter. | date | ||
| xm_cyber.entity_inventory.ssm_parameter_last_modified_user | User who last modified the SSM parameter. | keyword | ||
| xm_cyber.entity_inventory.ssm_parameter_name | SSM parameter name. | keyword | ||
| xm_cyber.entity_inventory.ssm_parameter_tier | SSM parameter tier. | keyword | ||
| xm_cyber.entity_inventory.ssm_parameter_type | SSM parameter type (String, StringList, SecureString). | keyword | ||
| xm_cyber.entity_inventory.ssm_parameter_version | SSM parameter version number. | long | ||
| xm_cyber.entity_inventory.state | State (e.g. In-use). | keyword | ||
| xm_cyber.entity_inventory.status | Entity operational status string when reported. | keyword | ||
| xm_cyber.entity_inventory.system_uuid | System uuid (e.g. a3a7d001-bc73-48bd-0609-c63b9d59ff7d). | keyword | ||
| xm_cyber.entity_inventory.tags_str | Vendor-provided tags reported as plain strings. | keyword | ||
| xm_cyber.entity_inventory.time_to_revive_at | Time at which the entity is scheduled to be revived. | date | ||
| xm_cyber.entity_inventory.top_owner_name | Top owner name (e.g. example-security-agent). | keyword | ||
| xm_cyber.entity_inventory.type | Vendor type discriminator returned alongside entity_type. |
keyword | ||
| xm_cyber.entity_inventory.type_display_name | Human-readable label for type. |
keyword | ||
| xm_cyber.entity_inventory.uid | Uid (e.g. 27c684bf-90ea-40c2-8e61-65e5f4156b2b). | keyword | ||
| xm_cyber.entity_inventory.use_type | Vendor useType discriminator. |
keyword | ||
| xm_cyber.entity_inventory.user_access_keys_count | User access keys count (e.g. 0). | long | ||
| xm_cyber.entity_inventory.user_name | User name (e.g. wdagutilityaccount). | keyword | ||
| xm_cyber.entity_inventory.version_number | Version number (e.g. 1). | long | ||
| xm_cyber.entity_inventory.vpc_config.ipv6allowed_for_dual_stack | Ipv6allowed for dual stack (e.g. False). | boolean | ||
| xm_cyber.entity_inventory.vpc_config.security_group_ids | Security group ids (e.g. []). | keyword | ||
| xm_cyber.entity_inventory.vpc_config.subnet_ids | Subnet ids (e.g. []). | keyword | ||
| xm_cyber.entity_inventory.vpc_config.vpc_id | Vpc id (e.g. ). | keyword | ||
| xm_cyber.entity_inventory.when_created | When created (e.g. 2020-03-27T20:42:23.000Z). | date | ||
| xm_cyber.entity_inventory.xm_labels | XM Cyber managed labels attached to the entity. | flattened | ||
| xm_cyber.entity_inventory.xm_mongo_update_time | Source Mongo update time (e.g. 2026-05-06T10:43:14.469Z). | date | ||
| xm_cyber.entity_inventory.xm_provider_account | XM Cyber provider account identifier. | keyword | ||
| xm_cyber.entity_inventory.xm_update_time | Time at which XM Cyber last updated the entity record. | date | ||
| xm_cyber.entity_inventory.yaml_representation | Yaml representation (e.g. metadata: annotations: meta.helm.sh/release-name: "traefik" meta.helm.). | keyword |
Example
{
    "@timestamp": "2026-05-05T21:05:15.079Z",
    "agent": {
        "ephemeral_id": "2167a0bd-9733-462c-a6ca-9d7ce0c4e1a4",
        "id": "f324639d-515c-4929-ba7d-6ef0d8c7a5de",
        "name": "elastic-agent-41339",
        "type": "filebeat",
        "version": "8.19.0"
    },
    "cloud": {
        "account": {
            "id": "000000000001",
            "name": "example-account"
        },
        "instance": {
            "name": "/ExampleBuild/testKeys"
        },
        "region": "us-east-1"
    },
    "data_stream": {
        "dataset": "xm_cyber.entity_inventory",
        "namespace": "54902",
        "type": "logs"
    },
    "ecs": {
        "version": "9.5.0"
    },
    "elastic_agent": {
        "id": "f324639d-515c-4929-ba7d-6ef0d8c7a5de",
        "snapshot": false,
        "version": "8.19.0"
    },
    "event": {
        "agent_id_status": "verified",
        "dataset": "xm_cyber.entity_inventory",
        "id": "awsSsmParameter-arn:aws:ssm:us-east-1:000000000001:parameter/ExampleBuild/testKeys",
        "ingested": "2026-09-22T11:33:09Z",
        "kind": "asset",
        "original": "{\"accountId\":\"000000000001\",\"accountName\":\"example-account\",\"arn\":\"arn:aws:ssm:us-east-1:000000000001:parameter/ExampleBuild/testKeys\",\"category\":\"Cloud\",\"customProperties\":{\"domainWorkgroup\":{\"data\":\"AWS/000000000001\",\"type\":\"domain\"},\"ouComputer\":\"AWS/000000000001/us-east-1/SSM/ParameterMetadata\",\"ouUser\":\"AWS/000000000001/SSM/ParameterMetadata\",\"subnetInfo\":\"AWS_000000000001_us-east-1\"},\"disabled\":false,\"displayName\":\"/ExampleBuild/testKeys\",\"entityDetails\":{\"id\":\"awsSsmParameter-arn:aws:ssm:us-east-1:000000000001:parameter/ExampleBuild/testKeys\",\"isAsset\":null,\"name\":\"/ExampleBuild/testKeys\",\"subType\":\"awsSsmParameter\",\"subTypeDisplayName\":\"AWS SSM Parameter\"},\"entityType\":\"AwsSsmParameterEntity\",\"id\":\"awsSsmParameter-arn:aws:ssm:us-east-1:000000000001:parameter/ExampleBuild/testKeys\",\"name\":\"/ExampleBuild/testKeys\",\"notIncludedInAttacks\":false,\"organizationId\":\"o-abc123def4\",\"region\":\"us-east-1\",\"ruleDisplayName\":\"000000000001 / /ExampleBuild/testKeys\",\"ssmParameterDataType\":\"text\",\"ssmParameterKeyId\":\"alias/aws/ssm\",\"ssmParameterLastModifiedDate\":\"2020-07-19T09:53:58.629Z\",\"ssmParameterLastModifiedUser\":\"arn:aws:sts::000000000001:assumed-role/AWSReservedSSO_ExampleAccess_0123456789abcdef/alice.johnson@example.org\",\"ssmParameterName\":\"/ExampleBuild/testKeys\",\"ssmParameterTier\":\"Standard\",\"ssmParameterType\":\"SecureString\",\"ssmParameterVersion\":1,\"status\":\"active\",\"type\":\"awsSsmParameter\",\"typeDisplayName\":\"AWS SSM Parameter\",\"useType\":\"Storage\",\"xmProviderAccount\":\"example-account\",\"xmUpdateTime\":\"2026-05-05T21:05:15.079Z\"}"
    },
    "input": {
        "type": "cel"
    },
    "organization": {
        "id": "o-abc123def4"
    },
    "related": {
        "hosts": [
            "arn:aws:ssm:us-east-1:000000000001:parameter/ExampleBuild/testKeys",
            "/ExampleBuild/testKeys"
        ]
    },
    "tags": [
        "preserve_original_event",
        "forwarded",
        "xm_cyber-entity_inventory"
    ],
    "xm_cyber": {
        "entity_inventory": {
            "arn": "arn:aws:ssm:us-east-1:000000000001:parameter/ExampleBuild/testKeys",
            "category": "Cloud",
            "custom_properties": {
                "domain_workgroup": {
                    "data": "AWS/000000000001",
                    "type": "domain"
                },
                "ou_computer": "AWS/000000000001/us-east-1/SSM/ParameterMetadata",
                "ou_user": "AWS/000000000001/SSM/ParameterMetadata",
                "subnet_info": "AWS_000000000001_us-east-1"
            },
            "disabled": false,
            "display_name": "/ExampleBuild/testKeys",
            "entity_details": {
                "id": "awsSsmParameter-arn:aws:ssm:us-east-1:000000000001:parameter/ExampleBuild/testKeys",
                "name": "/ExampleBuild/testKeys",
                "sub_type": "awsSsmParameter",
                "sub_type_display_name": "AWS SSM Parameter"
            },
            "entity_type": "AwsSsmParameterEntity",
            "name": "/ExampleBuild/testKeys",
            "not_included_in_attacks": false,
            "rule_display_name": "000000000001 / /ExampleBuild/testKeys",
            "ssm_parameter_data_type": "text",
            "ssm_parameter_key_id": "alias/aws/ssm",
            "ssm_parameter_last_modified_date": "2020-07-19T09:53:58.629Z",
            "ssm_parameter_last_modified_user": "arn:aws:sts::000000000001:assumed-role/AWSReservedSSO_ExampleAccess_0123456789abcdef/alice.johnson@example.org",
            "ssm_parameter_name": "/ExampleBuild/testKeys",
            "ssm_parameter_tier": "Standard",
            "ssm_parameter_type": "SecureString",
            "ssm_parameter_version": 1,
            "status": "active",
            "type": "awsSsmParameter",
            "type_display_name": "AWS SSM Parameter",
            "use_type": "Storage",
            "xm_provider_account": "example-account"
        }
    }
}
Exported fields
| Field | Description | Type |
|---|---|---|
| @timestamp | Date/time when the event originated. This is the date/time extracted from the event, typically representing when the event was generated by the source. If the event source has no original timestamp, this value is typically populated by the first time the event was received by the pipeline. Required field for all events. | date |
| data_stream.dataset | The field can contain anything that makes sense to signify the source of the data. Examples include nginx.access, prometheus, endpoint etc. For data streams that otherwise fit, but that do not have dataset set we use the value "generic" for the dataset value. event.dataset should have the same value as data_stream.dataset. Beyond the Elasticsearch data stream naming criteria noted above, the dataset value has additional restrictions: * Must not contain - * No longer than 100 characters |
constant_keyword |
| data_stream.namespace | A user defined namespace. Namespaces are useful to allow grouping of data. Many users already organize their indices this way, and the data stream naming scheme now provides this best practice as a default. Many users will populate this field with default. If no value is used, it falls back to default. Beyond the Elasticsearch index naming criteria noted above, namespace value has the additional restrictions: * Must not contain - * No longer than 100 characters |
constant_keyword |
| data_stream.type | An overarching type for the data stream. Currently allowed values are "logs" and "metrics". We expect to also add "traces" and "synthetics" in the near future. | constant_keyword |
| event.dataset | Name of the dataset. If an event source publishes more than one type of log or events (e.g. access log, error log), the dataset is used to specify which one the event comes from. It's recommended but not required to start the dataset name with the module name, followed by a dot, then the dataset name. | constant_keyword |
| event.module | Name of the module this data is coming from. If your monitoring agent supports the concept of modules or plugins to process events of a given source (e.g. Apache logs), event.module should contain the name of this module. |
constant_keyword |
| input.type | Type of filebeat input. | keyword |
| labels.risk_grade | The risk grade of the scenario. | keyword |
| labels.risk_score | The risk score of the scenario as a keyword label. | keyword |
| labels.scenario_name | The name of the scenario. | keyword |
| observer.product | The product name of the observer. | constant_keyword |
| observer.vendor | Vendor name of the observer. | constant_keyword |
| xm_cyber.risk_score.avg_graph_data.date | The date of the average graph data point. | date |
| xm_cyber.risk_score.avg_graph_data.grade | The risk grade for the average graph data point. | keyword |
| xm_cyber.risk_score.avg_graph_data.score | The average risk score for the given date. | float |
| xm_cyber.risk_score.graph_data.campaigns | The campaigns associated with the risk score graph data. | keyword |
| xm_cyber.risk_score.graph_data.from_date | The start date of the time window for the graph data. | date |
| xm_cyber.risk_score.graph_data.grade | The risk grade for the scenario within the given time window. | keyword |
| xm_cyber.risk_score.graph_data.score | The risk score for the scenario within the given time window. | float |
| xm_cyber.risk_score.graph_data.to_date | The end date of the time window for the graph data. | date |
| xm_cyber.risk_score.resolution | The resolution (granularity in days) of the risk score graph data. | integer |
| xm_cyber.risk_score.scenario.grade | The risk grade of the attack scenario. | keyword |
| xm_cyber.risk_score.scenario.id | The unique identifier of the attack scenario. | keyword |
| xm_cyber.risk_score.scenario.name | The name of the attack scenario. | keyword |
| xm_cyber.risk_score.scenario.score | The risk score of the scenario as a keyword label. | keyword |
| xm_cyber.risk_score.scenario.score_float | The risk score of the scenario as a floating-point number. | float |
| xm_cyber.risk_score.stats.grade | The overall risk grade across all scenarios. | keyword |
| xm_cyber.risk_score.stats.score | The overall risk score across all scenarios. | float |
| xm_cyber.risk_score.stats.trend | The trend of the risk score compared to the previous period (positive means improving, negative means worsening). | long |
| xm_cyber.risk_score.time_id | The time window for the risk score report. | keyword |
Example
{
    "@timestamp": "2026-09-22T11:34:46.227Z",
    "agent": {
        "ephemeral_id": "42680ac4-2c38-4173-b79c-84bfc00424d0",
        "id": "90c194d8-c1c5-412d-a903-0453fea7f1a3",
        "name": "elastic-agent-31080",
        "type": "filebeat",
        "version": "8.19.0"
    },
    "data_stream": {
        "dataset": "xm_cyber.risk_score",
        "namespace": "79158",
        "type": "logs"
    },
    "ecs": {
        "version": "9.5.0"
    },
    "elastic_agent": {
        "id": "90c194d8-c1c5-412d-a903-0453fea7f1a3",
        "snapshot": false,
        "version": "8.19.0"
    },
    "event": {
        "agent_id_status": "verified",
        "dataset": "xm_cyber.risk_score",
        "ingested": "2026-09-22T11:34:49Z",
        "kind": "event",
        "original": "{\"avgGraphData\":[{\"date\":\"2025-12-03T00:00:00.000Z\",\"grade\":\"A\",\"score\":95}],\"graphData\":{\"campaigns\":null,\"fromDate\":\"2025-12-02T00:00:00.000Z\",\"grade\":\"A\",\"score\":95,\"toDate\":\"2025-12-03T00:00:00.000Z\"},\"scenario\":{\"grade\":\"B\",\"id\":\"A101\",\"name\":\"(EX) Endpoint to Servers\",\"score\":82},\"stats\":{\"grade\":\"A\",\"score\":90,\"trend\":1}}"
    },
    "input": {
        "type": "cel"
    },
    "labels": {
        "risk_grade": "B",
        "risk_score": "82",
        "scenario_name": "(EX) Endpoint to Servers"
    },
    "tags": [
        "preserve_original_event",
        "forwarded",
        "xm_cyber-risk_score"
    ],
    "xm_cyber": {
        "risk_score": {
            "avg_graph_data": [
                {
                    "date": "2025-12-03T00:00:00.000Z",
                    "grade": "A",
                    "score": 95
                }
            ],
            "graph_data": {
                "from_date": "2025-12-02T00:00:00.000Z",
                "grade": "A",
                "score": 95,
                "to_date": "2025-12-03T00:00:00.000Z"
            },
            "scenario": {
                "id": "A101",
                "score_float": 82
            },
            "stats": {
                "grade": "A",
                "score": 90,
                "trend": 1
            }
        }
    }
}
Exported fields
| Field | Description | Type |
|---|---|---|
| @timestamp | Event timestamp. | date |
| data_stream.dataset | Data stream dataset. | constant_keyword |
| data_stream.namespace | Data stream namespace. | constant_keyword |
| data_stream.type | Data stream type. | constant_keyword |
| event.dataset | Event dataset. | constant_keyword |
| event.module | Event module. | constant_keyword |
| input.type | Type of filebeat input. | keyword |
| observer.product | The product name of the observer. | constant_keyword |
| observer.vendor | Vendor name of the observer. | constant_keyword |
| xm_cyber.device.affected_entities | Number of related entities affected for this device context. | long |
| xm_cyber.device.choke_point_level | Qualitative choke-point level (e.g. text tier from the API). | keyword |
| xm_cyber.device.choke_point_score | Numeric choke-point score from XM Cyber. | long |
| xm_cyber.device.critical_assets_at_risk | Count of critical assets at risk in relation to this device. | long |
| xm_cyber.device.critical_vulnerabilities | Count of critical-severity vulnerabilities on the device. | long |
| xm_cyber.device.device_id | XM Cyber device identifier. | keyword |
| xm_cyber.device.device_name | Human-readable device name. | keyword |
| xm_cyber.device.device_type | XM Cyber device type classification. | keyword |
| xm_cyber.device.domain | Active Directory or DNS domain name. | keyword |
| xm_cyber.device.enitity_vulnerabilities | Entity vulnerability count as returned by the API (vendor field name retains the historical spelling "enitity"). | long |
| xm_cyber.device.enrichment_labels | Enrichment labels applied by XM Cyber. | keyword |
| xm_cyber.device.fqdn | Fully qualified domain name when present. | keyword |
| xm_cyber.device.high_vulnerabilities | Count of high-severity vulnerabilities on the device. | long |
| xm_cyber.device.ip_address | Primary IP address associated with the device. | ip |
| xm_cyber.device.is_critical_asset | Whether the device is treated as a critical asset. | boolean |
| xm_cyber.device.labels | Vendor-supplied labels attached to the device. | keyword |
| xm_cyber.device.last_compromised | Timestamp of the last simulated or observed compromise when provided; may be absent. | date |
| xm_cyber.device.last_scan | Timestamp of the last vulnerability or inventory scan for the device. | date |
| xm_cyber.device.low_vulnerabilities | Count of low-severity vulnerabilities on the device. | long |
| xm_cyber.device.max_cvss_v2 | Maximum CVSS v2 base score observed on the device. | double |
| xm_cyber.device.max_cvss_v3 | Maximum CVSS v3.0 base score observed on the device. | double |
| xm_cyber.device.max_cvss_v31 | Maximum CVSS v3.1 base score observed on the device. | double |
| xm_cyber.device.max_cvss_v4 | Maximum CVSS v4 base score observed on the device. | double |
| xm_cyber.device.medium_vulnerabilities | Count of medium-severity vulnerabilities on the device. | long |
| xm_cyber.device.os | Operating system string reported for the device. | keyword |
| xm_cyber.device.ou | Organizational unit path or label. | keyword |
| xm_cyber.device.products | Number of distinct products detected on the device. | long |
| xm_cyber.device.risk_score | XM Cyber risk score for the device. | long |
| xm_cyber.device.subnet | Subnet associated with the device. | keyword |
| xm_cyber.device.type | Device type or category label from the vendor payload. | keyword |
| xm_cyber.device.unknown_vulnerabilities | Count of unknown-severity vulnerabilities on the device. | long |
Example
{
    "@timestamp": "2026-09-07T01:32:06.000Z",
    "agent": {
        "ephemeral_id": "c879fb95-ca15-43fa-85c6-b410fb02d6cf",
        "id": "a48f02ea-221f-46e1-a630-ad21833a0a0c",
        "name": "elastic-agent-69759",
        "type": "filebeat",
        "version": "8.19.0"
    },
    "data_stream": {
        "dataset": "xm_cyber.device",
        "namespace": "65930",
        "type": "logs"
    },
    "device": {
        "id": "9000000000000000001",
        "type": "Workstation"
    },
    "ecs": {
        "version": "9.5.0"
    },
    "elastic_agent": {
        "id": "a48f02ea-221f-46e1-a630-ad21833a0a0c",
        "snapshot": false,
        "version": "8.19.0"
    },
    "event": {
        "agent_id_status": "verified",
        "category": [
            "host"
        ],
        "dataset": "xm_cyber.device",
        "ingested": "2026-09-22T11:32:19Z",
        "kind": "event",
        "original": "{\"affectedEntities\":4,\"chokePointLevel\":\"Low\",\"chokePointScore\":38,\"criticalAssetsAtRisk\":2,\"criticalVulnerabilities\":2,\"deviceId\":\"9000000000000000001\",\"deviceName\":\"host-01\",\"deviceType\":\"Workstation\",\"domain\":\"corp.example.com\",\"enitityVulnerabilities\":1,\"enrichmentLabels\":[\"enriched\"],\"fqdn\":\"host-01.corp.example.com\",\"highVulnerabilities\":5,\"ipAddress\":\"175.16.199.0\",\"isCriticalAsset\":false,\"labels\":[\"lab\",\"example-security-test\"],\"lastCompromised\":\"2026-09-04T00:00:00.000Z\",\"lastDataUpdate\":\"2026-09-07T01:32:06.000Z\",\"lastScan\":\"2026-09-06T14:08:10.982Z\",\"lowVulnerabilities\":3,\"maxCvssV2\":8,\"maxCvssV3\":9.1,\"maxCvssV31\":8.8,\"maxCvssV4\":7.2,\"mediumVulnerabilities\":10,\"os\":\"Windows 11\",\"ou\":\"OU=Workstations,DC=corp,DC=example,DC=com\",\"products\":4,\"riskScore\":75,\"subnet\":\"175.16.199.0/24\",\"type\":\"agent\",\"unknownVulnerabilities\":0}",
        "type": [
            "info"
        ]
    },
    "host": {
        "domain": "corp.example.com",
        "hostname": "host-01",
        "id": "9000000000000000001",
        "ip": [
            "175.16.199.0"
        ],
        "name": "host-01.corp.example.com",
        "os": {
            "full": "Windows 11"
        },
        "type": "Workstation"
    },
    "input": {
        "type": "cel"
    },
    "related": {
        "ip": [
            "175.16.199.0"
        ]
    },
    "tags": [
        "preserve_original_event",
        "forwarded",
        "xm_cyber-device"
    ],
    "vulnerability": {
        "classification": "CVSS",
        "score": {
            "base": 7.2,
            "version": "4.0"
        }
    },
    "xm_cyber": {
        "device": {
            "affected_entities": 4,
            "choke_point_level": "Low",
            "choke_point_score": 38,
            "critical_assets_at_risk": 2,
            "critical_vulnerabilities": 2,
            "enitity_vulnerabilities": 1,
            "enrichment_labels": [
                "enriched"
            ],
            "high_vulnerabilities": 5,
            "is_critical_asset": false,
            "labels": [
                "lab",
                "example-security-test"
            ],
            "last_compromised": "2026-09-04T00:00:00.000Z",
            "last_scan": "2026-09-06T14:08:10.982Z",
            "low_vulnerabilities": 3,
            "max_cvss_v2": 8,
            "max_cvss_v3": 9.1,
            "max_cvss_v31": 8.8,
            "max_cvss_v4": 7.2,
            "medium_vulnerabilities": 10,
            "ou": "OU=Workstations,DC=corp,DC=example,DC=com",
            "products": 4,
            "risk_score": 75,
            "subnet": "175.16.199.0/24",
            "type": "agent",
            "unknown_vulnerabilities": 0
        }
    }
}
Exported fields
| Field | Description | Type |
|---|---|---|
| @timestamp | Event timestamp. | date |
| data_stream.dataset | Data stream dataset. | constant_keyword |
| data_stream.namespace | Data stream namespace. | constant_keyword |
| data_stream.type | Data stream type. | constant_keyword |
| event.dataset | Event dataset. | constant_keyword |
| event.module | Event module. | constant_keyword |
| input.type | Type of filebeat input. | keyword |
| observer.product | The product name of the observer. | constant_keyword |
| observer.vendor | Vendor name of the observer. | constant_keyword |
| xm_cyber.product.affected_critical_assets | Affected critical assets count for this product. | long |
| xm_cyber.product.choke_points_found_on | Count of choke-point contexts where this product appears. | long |
| xm_cyber.product.devices_found_on | Number of devices where this product is installed. | long |
| xm_cyber.product.product_name | Product display name from the API. | keyword |
| xm_cyber.product.product_operating_system | OS strings where the product is reported. | keyword |
| xm_cyber.product.product_vulnerabilities | Vulnerability count associated with this product. | long |
| xm_cyber.product.products_critical_assets_at_risk | Critical assets at risk attributed to this product. | long |
| xm_cyber.product.vendor | Software vendor when present. | keyword |
Example
{
    "@timestamp": "2026-09-07T01:32:06.000Z",
    "agent": {
        "ephemeral_id": "5e8be395-1dd3-4e0b-889f-5f1d1c6125b8",
        "id": "a3117c18-3b87-420d-9a12-d75bf4a80e10",
        "name": "elastic-agent-37269",
        "type": "filebeat",
        "version": "8.19.0"
    },
    "data_stream": {
        "dataset": "xm_cyber.product",
        "namespace": "97858",
        "type": "logs"
    },
    "ecs": {
        "version": "9.5.0"
    },
    "elastic_agent": {
        "id": "a3117c18-3b87-420d-9a12-d75bf4a80e10",
        "snapshot": false,
        "version": "8.19.0"
    },
    "event": {
        "agent_id_status": "verified",
        "dataset": "xm_cyber.product",
        "ingested": "2026-09-22T11:33:59Z",
        "kind": "event",
        "original": "{\"affectedCriticalAssets\":3,\"chokePointsFoundOn\":0,\"devicesFoundOn\":8,\"lastDataUpdate\":\"2026-09-07T01:32:06.000Z\",\"productName\":\"windows remote desktop services\",\"productOperatingSystem\":[\"Windows 7 SP 1.0\",\"Windows Server 2012 R2\",\"Windows Server 2012 R2 (DC)\"],\"productVulnerabilities\":2,\"productsCriticalAssetsAtRisk\":29,\"vendor\":null}"
    },
    "input": {
        "type": "cel"
    },
    "tags": [
        "preserve_original_event",
        "forwarded",
        "xm_cyber-product"
    ],
    "xm_cyber": {
        "product": {
            "affected_critical_assets": 3,
            "choke_points_found_on": 0,
            "devices_found_on": 8,
            "product_name": "windows remote desktop services",
            "product_operating_system": [
                "Windows 7 SP 1.0",
                "Windows Server 2012 R2",
                "Windows Server 2012 R2 (DC)"
            ],
            "product_vulnerabilities": 2,
            "products_critical_assets_at_risk": 29
        }
    }
}
Exported fields
| Field | Description | Type |
|---|---|---|
| @timestamp | Date/time when the event originated. This is the date/time extracted from the event, typically representing when the event was generated by the source. If the event source has no original timestamp, this value is typically populated by the first time the event was received by the pipeline. Required field for all events. | date |
| data_stream.dataset | The field can contain anything that makes sense to signify the source of the data. Examples include nginx.access, prometheus, endpoint etc. For data streams that otherwise fit, but that do not have dataset set we use the value "generic" for the dataset value. event.dataset should have the same value as data_stream.dataset. Beyond the Elasticsearch data stream naming criteria noted above, the dataset value has additional restrictions: * Must not contain - * No longer than 100 characters |
constant_keyword |
| data_stream.namespace | A user defined namespace. Namespaces are useful to allow grouping of data. Many users already organize their indices this way, and the data stream naming scheme now provides this best practice as a default. Many users will populate this field with default. If no value is used, it falls back to default. Beyond the Elasticsearch index naming criteria noted above, namespace value has the additional restrictions: * Must not contain - * No longer than 100 characters |
constant_keyword |
| data_stream.type | An overarching type for the data stream. Currently allowed values are "logs" and "metrics". We expect to also add "traces" and "synthetics" in the near future. | constant_keyword |
| event.dataset | Name of the dataset. If an event source publishes more than one type of log or events (e.g. access log, error log), the dataset is used to specify which one the event comes from. It's recommended but not required to start the dataset name with the module name, followed by a dot, then the dataset name. | constant_keyword |
| event.module | Name of the module this data is coming from. If your monitoring agent supports the concept of modules or plugins to process events of a given source (e.g. Apache logs), event.module should contain the name of this module. |
constant_keyword |
| input.type | Type of filebeat input. | keyword |
| observer.product | The product name of the observer. | constant_keyword |
| observer.vendor | Vendor name of the observer. | constant_keyword |
| vulnerability.scanner.vendor | The name of the vulnerability scanner vendor. | constant_keyword |
| xm_cyber.vulnerability_instance.device_id | XM Cyber device identifier. | keyword |
| xm_cyber.vulnerability_instance.product_versions.active_cves.cve | CVE identifier. | keyword |
| xm_cyber.vulnerability_instance.product_versions.active_cves.safe_version | Vendor-recommended safe version when provided. | keyword |
| xm_cyber.vulnerability_instance.product_versions.closed_cve_ids | CVE identifiers that have been closed for this product version. | keyword |
| xm_cyber.vulnerability_instance.product_versions.file_paths | File paths associated with this product version on the device, when reported. | keyword |
| xm_cyber.vulnerability_instance.product_versions.product_name | Product display name. | keyword |
| xm_cyber.vulnerability_instance.product_versions.product_vendor | Software vendor. Empty in the API for about half of product versions. | keyword |
| xm_cyber.vulnerability_instance.product_versions.version | Installed product version string. Can be free text such as "Not Available." | keyword |
Example
{
    "@timestamp": "2026-09-07T01:32:06.000Z",
    "agent": {
        "ephemeral_id": "38b1b08a-48a4-47d4-b9e1-36051fca8ca2",
        "id": "75e93feb-2d94-42db-a402-5093a963d384",
        "name": "elastic-agent-35137",
        "type": "filebeat",
        "version": "8.18.0"
    },
    "data_stream": {
        "dataset": "xm_cyber.vulnerability_instance",
        "namespace": "95894",
        "type": "logs"
    },
    "device": {
        "id": "9000000000000000001"
    },
    "ecs": {
        "version": "9.5.0"
    },
    "elastic_agent": {
        "id": "75e93feb-2d94-42db-a402-5093a963d384",
        "snapshot": false,
        "version": "8.18.0"
    },
    "event": {
        "agent_id_status": "verified",
        "category": [
            "vulnerability",
            "host"
        ],
        "dataset": "xm_cyber.vulnerability_instance",
        "ingested": "2026-09-23T07:17:56Z",
        "kind": "event",
        "original": "{\"deviceId\":\"9000000000000000001\",\"lastDataUpdate\":\"2026-09-07T01:32:06.000Z\",\"productVersions\":[{\"activeCves\":[{\"cve\":\"CVE-2021-34527\",\"safeVersion\":null}],\"closedCveIds\":[],\"filePaths\":[\"C:/Windows/System32/ntoskrnl.exe\"],\"productName\":\"windows print spooler\",\"productVendor\":\"\",\"version\":\"Not Available\"},{\"activeCves\":[{\"cve\":\"CVE-2021-24111\",\"safeVersion\":null},{\"cve\":\"CVE-2022-21911\",\"safeVersion\":null},{\"cve\":\"CVE-2022-26832\",\"safeVersion\":null}],\"closedCveIds\":[],\"filePaths\":[],\"productName\":\".net framework\",\"productVendor\":\"microsoft\",\"version\":\"4.8\"}]}",
        "type": [
            "info"
        ]
    },
    "host": {
        "id": "9000000000000000001"
    },
    "input": {
        "type": "cel"
    },
    "tags": [
        "preserve_original_event",
        "forwarded",
        "xm_cyber-vulnerability_instance"
    ],
    "vulnerability": {
        "enumeration": "CVE",
        "id": [
            "CVE-2021-34527",
            "CVE-2021-24111",
            "CVE-2022-21911",
            "CVE-2022-26832"
        ]
    },
    "xm_cyber": {
        "vulnerability_instance": {
            "product_versions": [
                {
                    "active_cves": [
                        {
                            "cve": "CVE-2021-34527"
                        }
                    ],
                    "file_paths": [
                        "C:/Windows/System32/ntoskrnl.exe"
                    ],
                    "product_name": "windows print spooler",
                    "version": "Not Available"
                },
                {
                    "active_cves": [
                        {
                            "cve": "CVE-2021-24111"
                        },
                        {
                            "cve": "CVE-2022-21911"
                        },
                        {
                            "cve": "CVE-2022-26832"
                        }
                    ],
                    "product_name": ".net framework",
                    "product_vendor": "microsoft",
                    "version": "4.8"
                }
            ]
        }
    }
}
These inputs can be used with this integration:
cel
For more details about the CEL input settings, check the Filebeat documentation.
Before configuring the CEL input, make sure you have:
- Network connectivity to the target API endpoint
- Valid authentication credentials (API keys, tokens, or certificates as required)
- Appropriate permissions to read from the target data source
To configure the CEL input, you must specify the request.url value pointing to the API endpoint. The interval parameter controls how frequently requests are made and is the primary way to balance data freshness with API rate limits and costs. Authentication is often configured through the request.headers section using the appropriate method for the service.
To access the API service, make sure you have the necessary API credentials and that the Filebeat instance can reach the endpoint URL. Some services may require IP whitelisting or VPN access.
To collect logs via API endpoint, configure the following parameters:
- API Endpoint URL
- API credentials (tokens, keys, or username/password)
- Request interval (how often to fetch data)
These XM Cyber REST API endpoints are used by this integration:
| Endpoint | Method | Data stream | Description |
|---|---|---|---|
/api/auth |
POST | all | Exchange API key for Bearer access token |
/api/refresh-token |
POST | all | Refresh an expired access token |
/api/audit-trail/auditRecords |
GET | audit_trail |
Audit Records |
/api/v2/vrm/public/vrmReport/vulnerabilities |
GET | vulnerability |
Paginated open CVE records (CVSS, EPSS, CISA KEV / Exploit-DB, advisory URLs) |
/api/entityInventory/entities |
GET | entity_inventory |
List entities (devices, identities, cloud resources) tracked by XM Cyber |
/api/scenarios/v2/scenarios/riskScore |
GET | risk_score |
Organization risk score and grade |
/api/v2/vrm/public/vrmReport/devices |
GET | device |
Paginated device inventory with vulnerability aggregates |
/api/v2/vrm/public/vrmReport/products |
GET | product |
Paginated product-level exposure aggregates (counts and OS list per product) |
/api/v2/vrm/public/vrmReport/vulnerabilityInstances |
GET | vulnerability_instance |
Paginated device records with per-product-version active CVEs and safe versions |
The device, product, vulnerability and vulnerability_instance data streams collect a full snapshot of the XM Cyber VRM report on every polling interval. Each new report (identified by its lastDataUpdate timestamp) is indexed as a new set of documents, so the backing indices .ds-logs-xm_cyber.device-*, .ds-logs-xm_cyber.product-*, .ds-logs-xm_cyber.vulnerability-* and .ds-logs-xm_cyber.vulnerability_instance-* accumulate one copy of each record per report.
To prevent unbounded growth, each of these data streams ships with its own ILM policy (logs-xm_cyber.device-default_policy, logs-xm_cyber.product-default_policy, logs-xm_cyber.vulnerability-default_policy and logs-xm_cyber.vulnerability_instance-default_policy) and a matching data stream lifecycle. Documents in these source indices are deleted 30 days after they are ingested. The latest_vulnerability transform maintains the current view of each CVE in its own destination index, which is not affected by this retention.
This integration includes one or more Kibana dashboards that visualizes the data collected by the integration. The screenshots below illustrate how the ingested data is displayed.
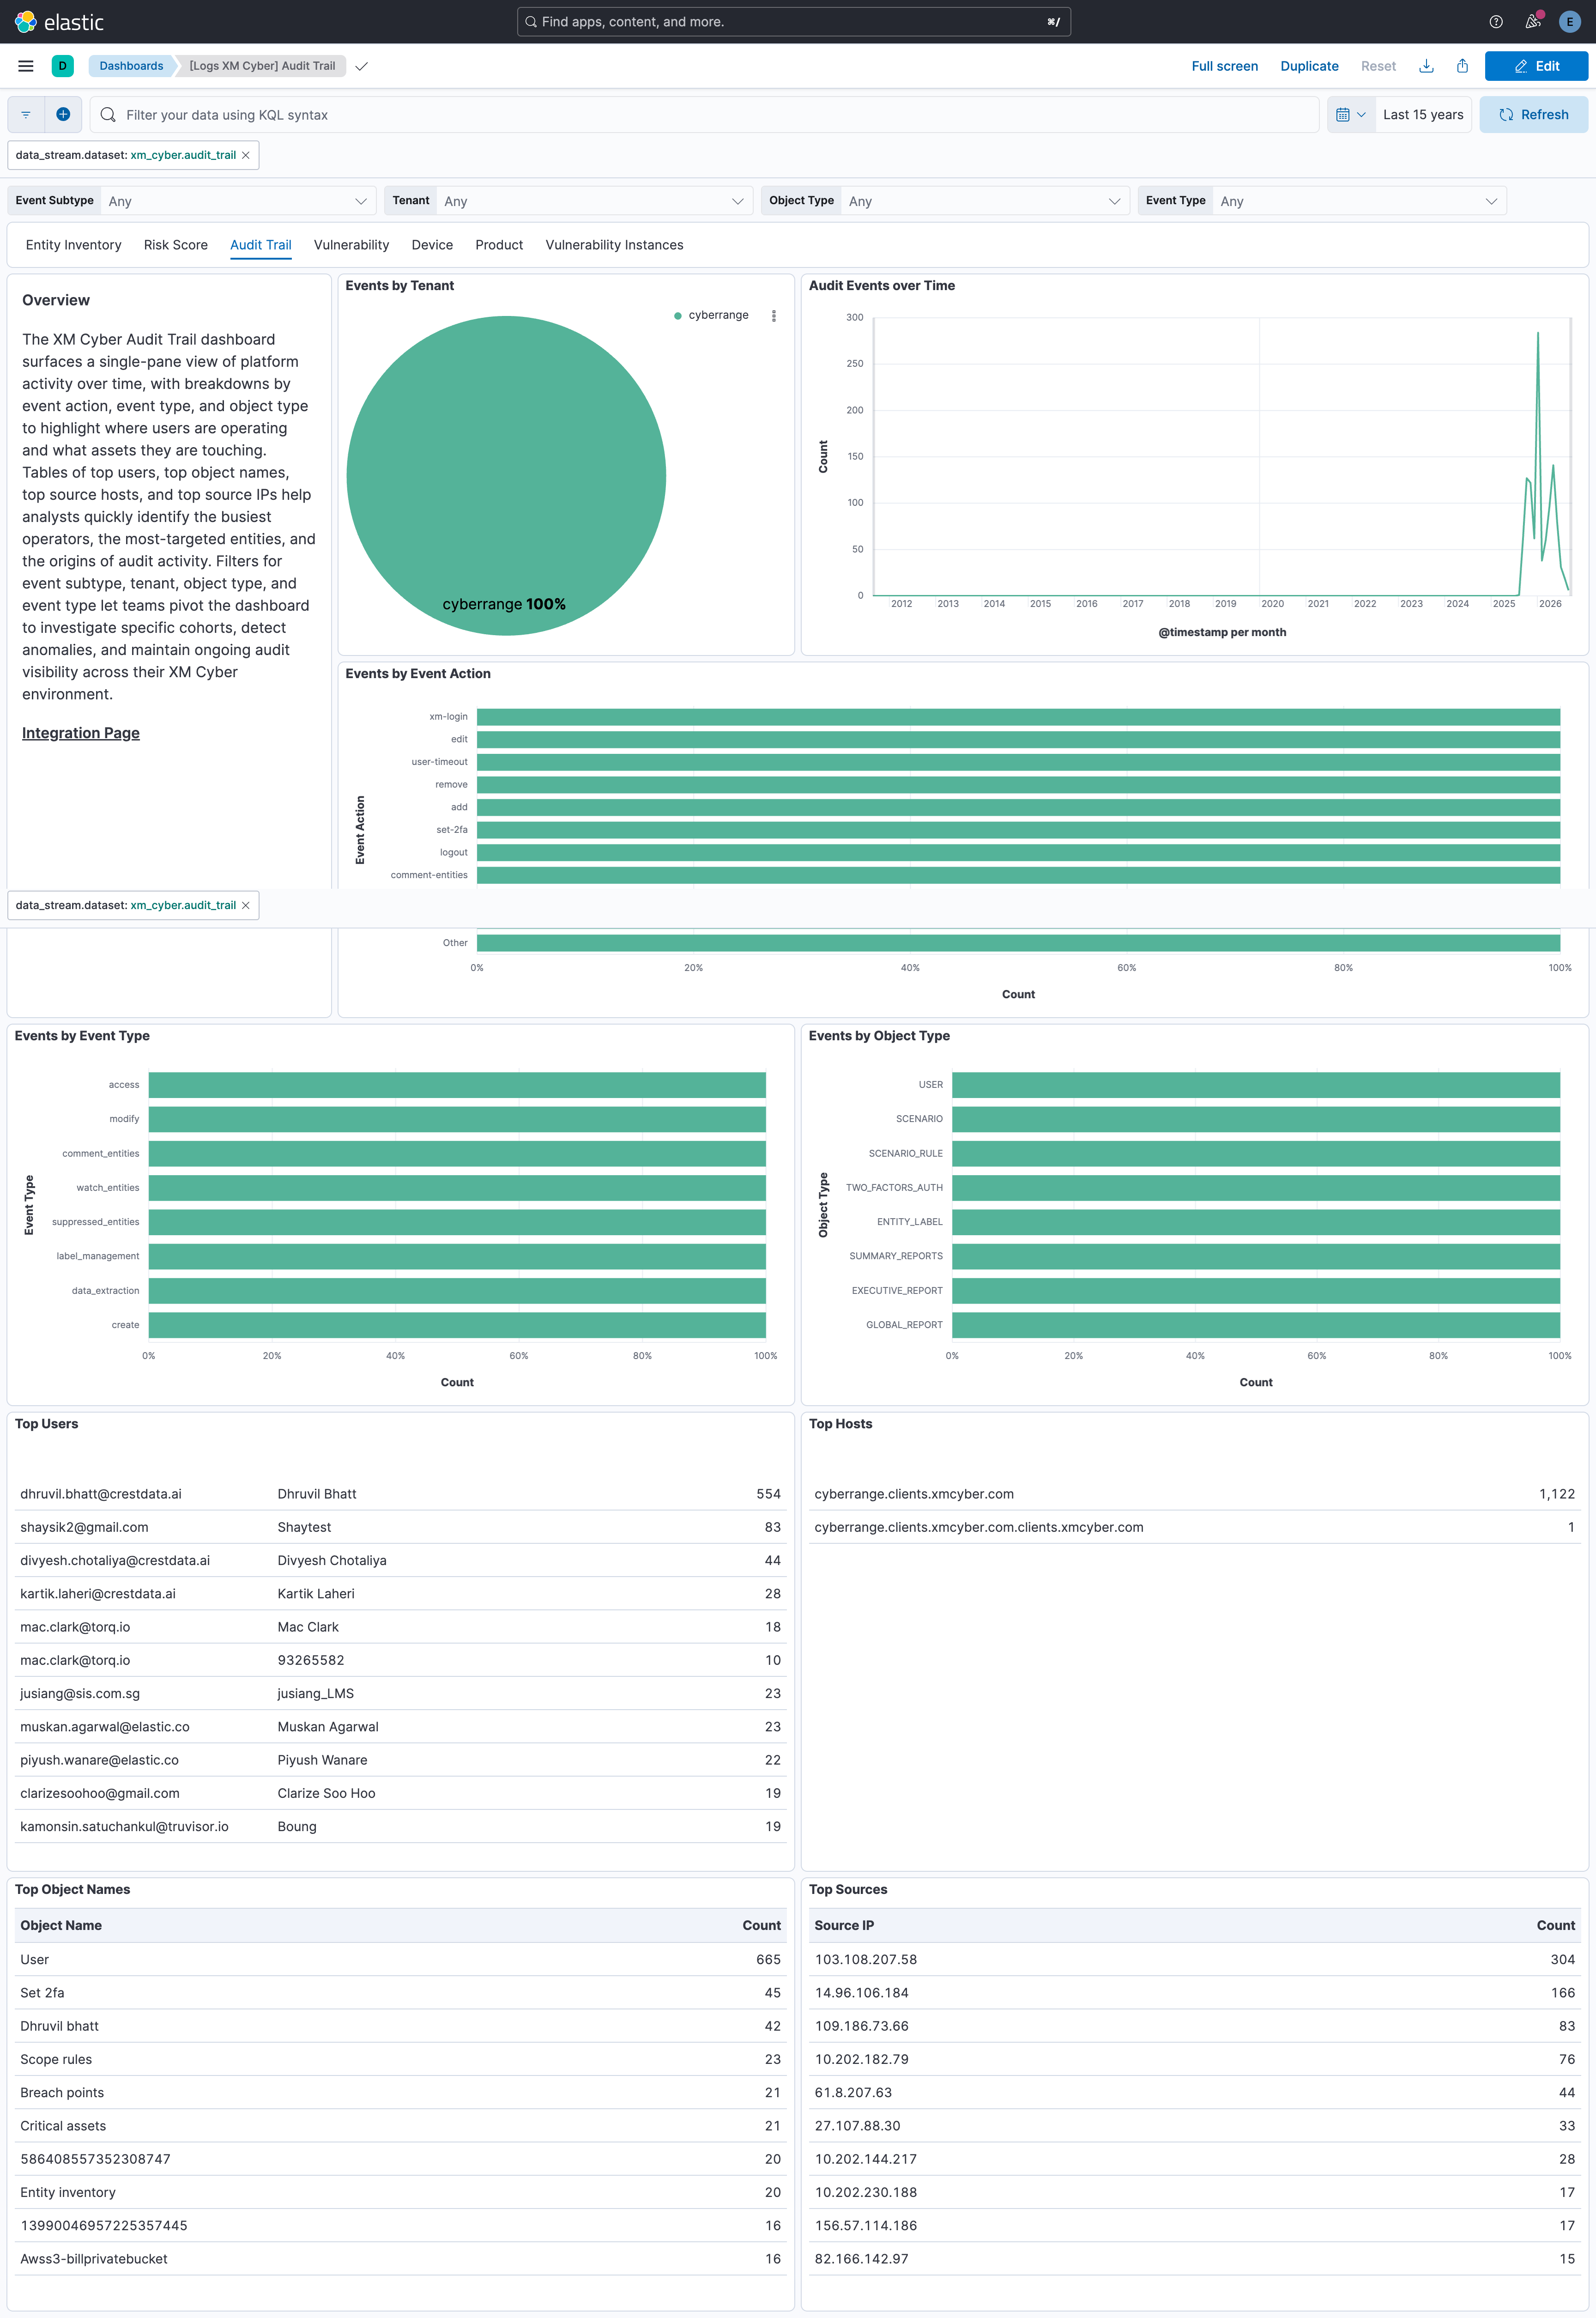
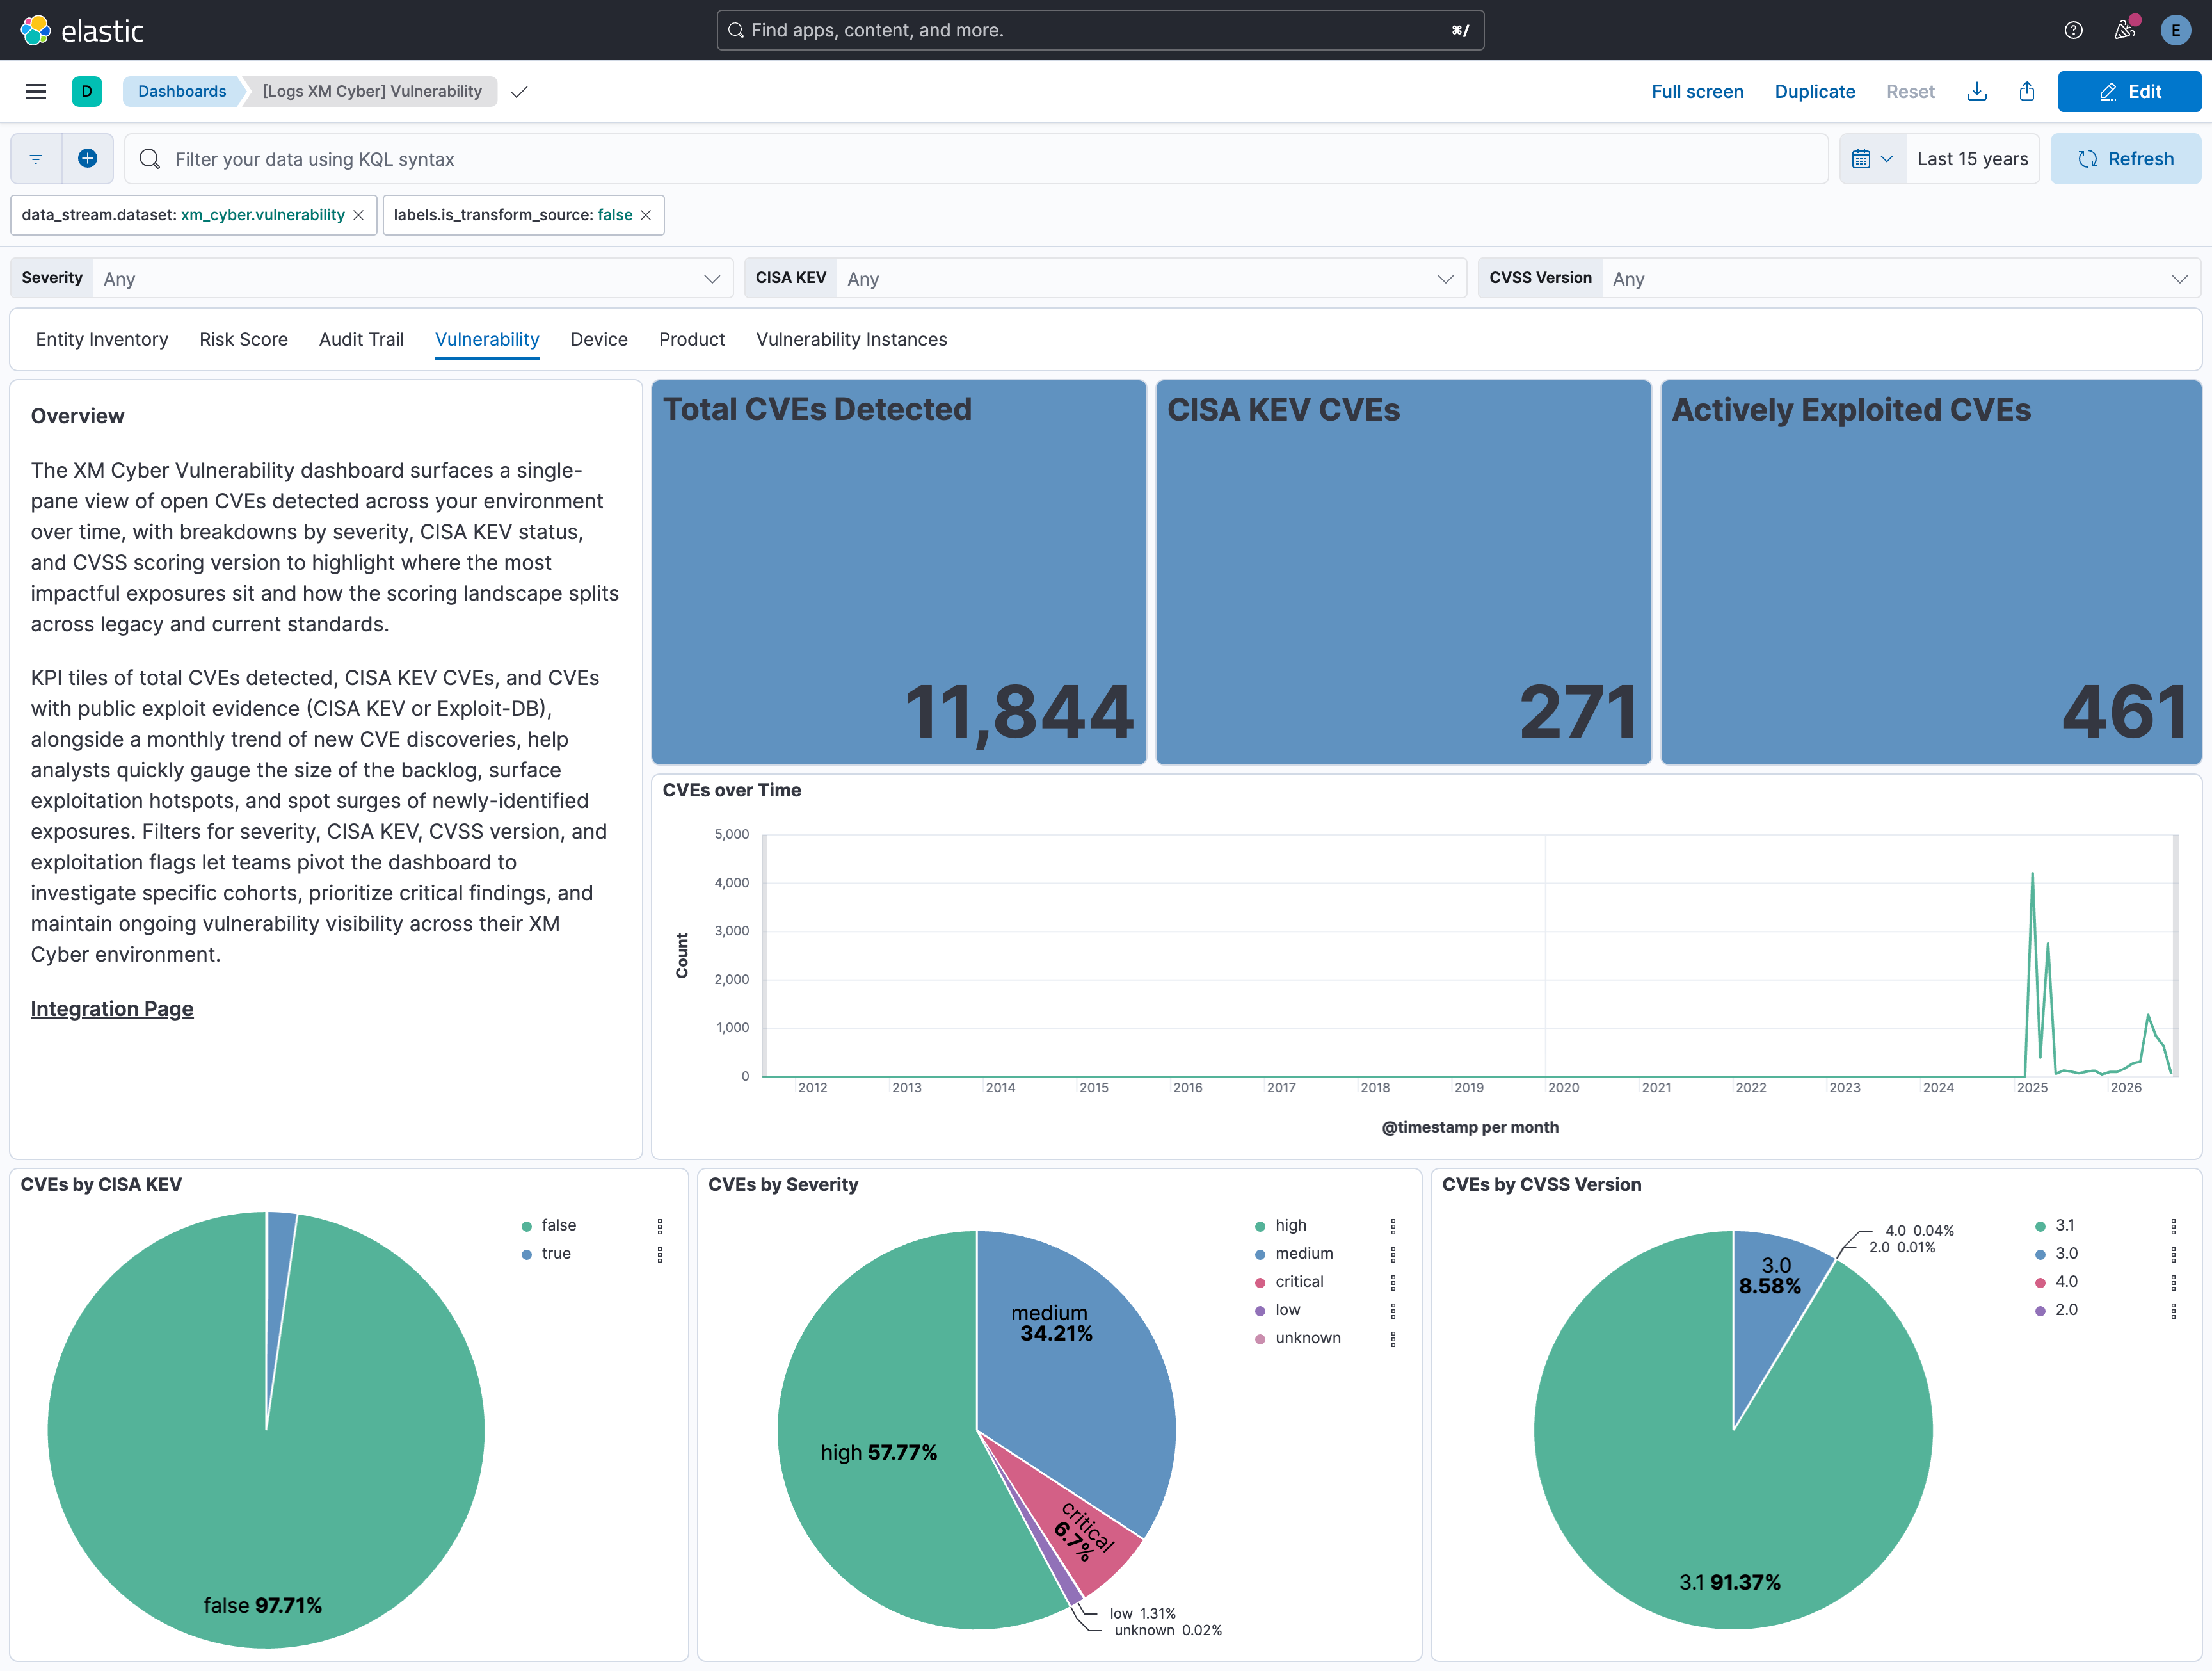
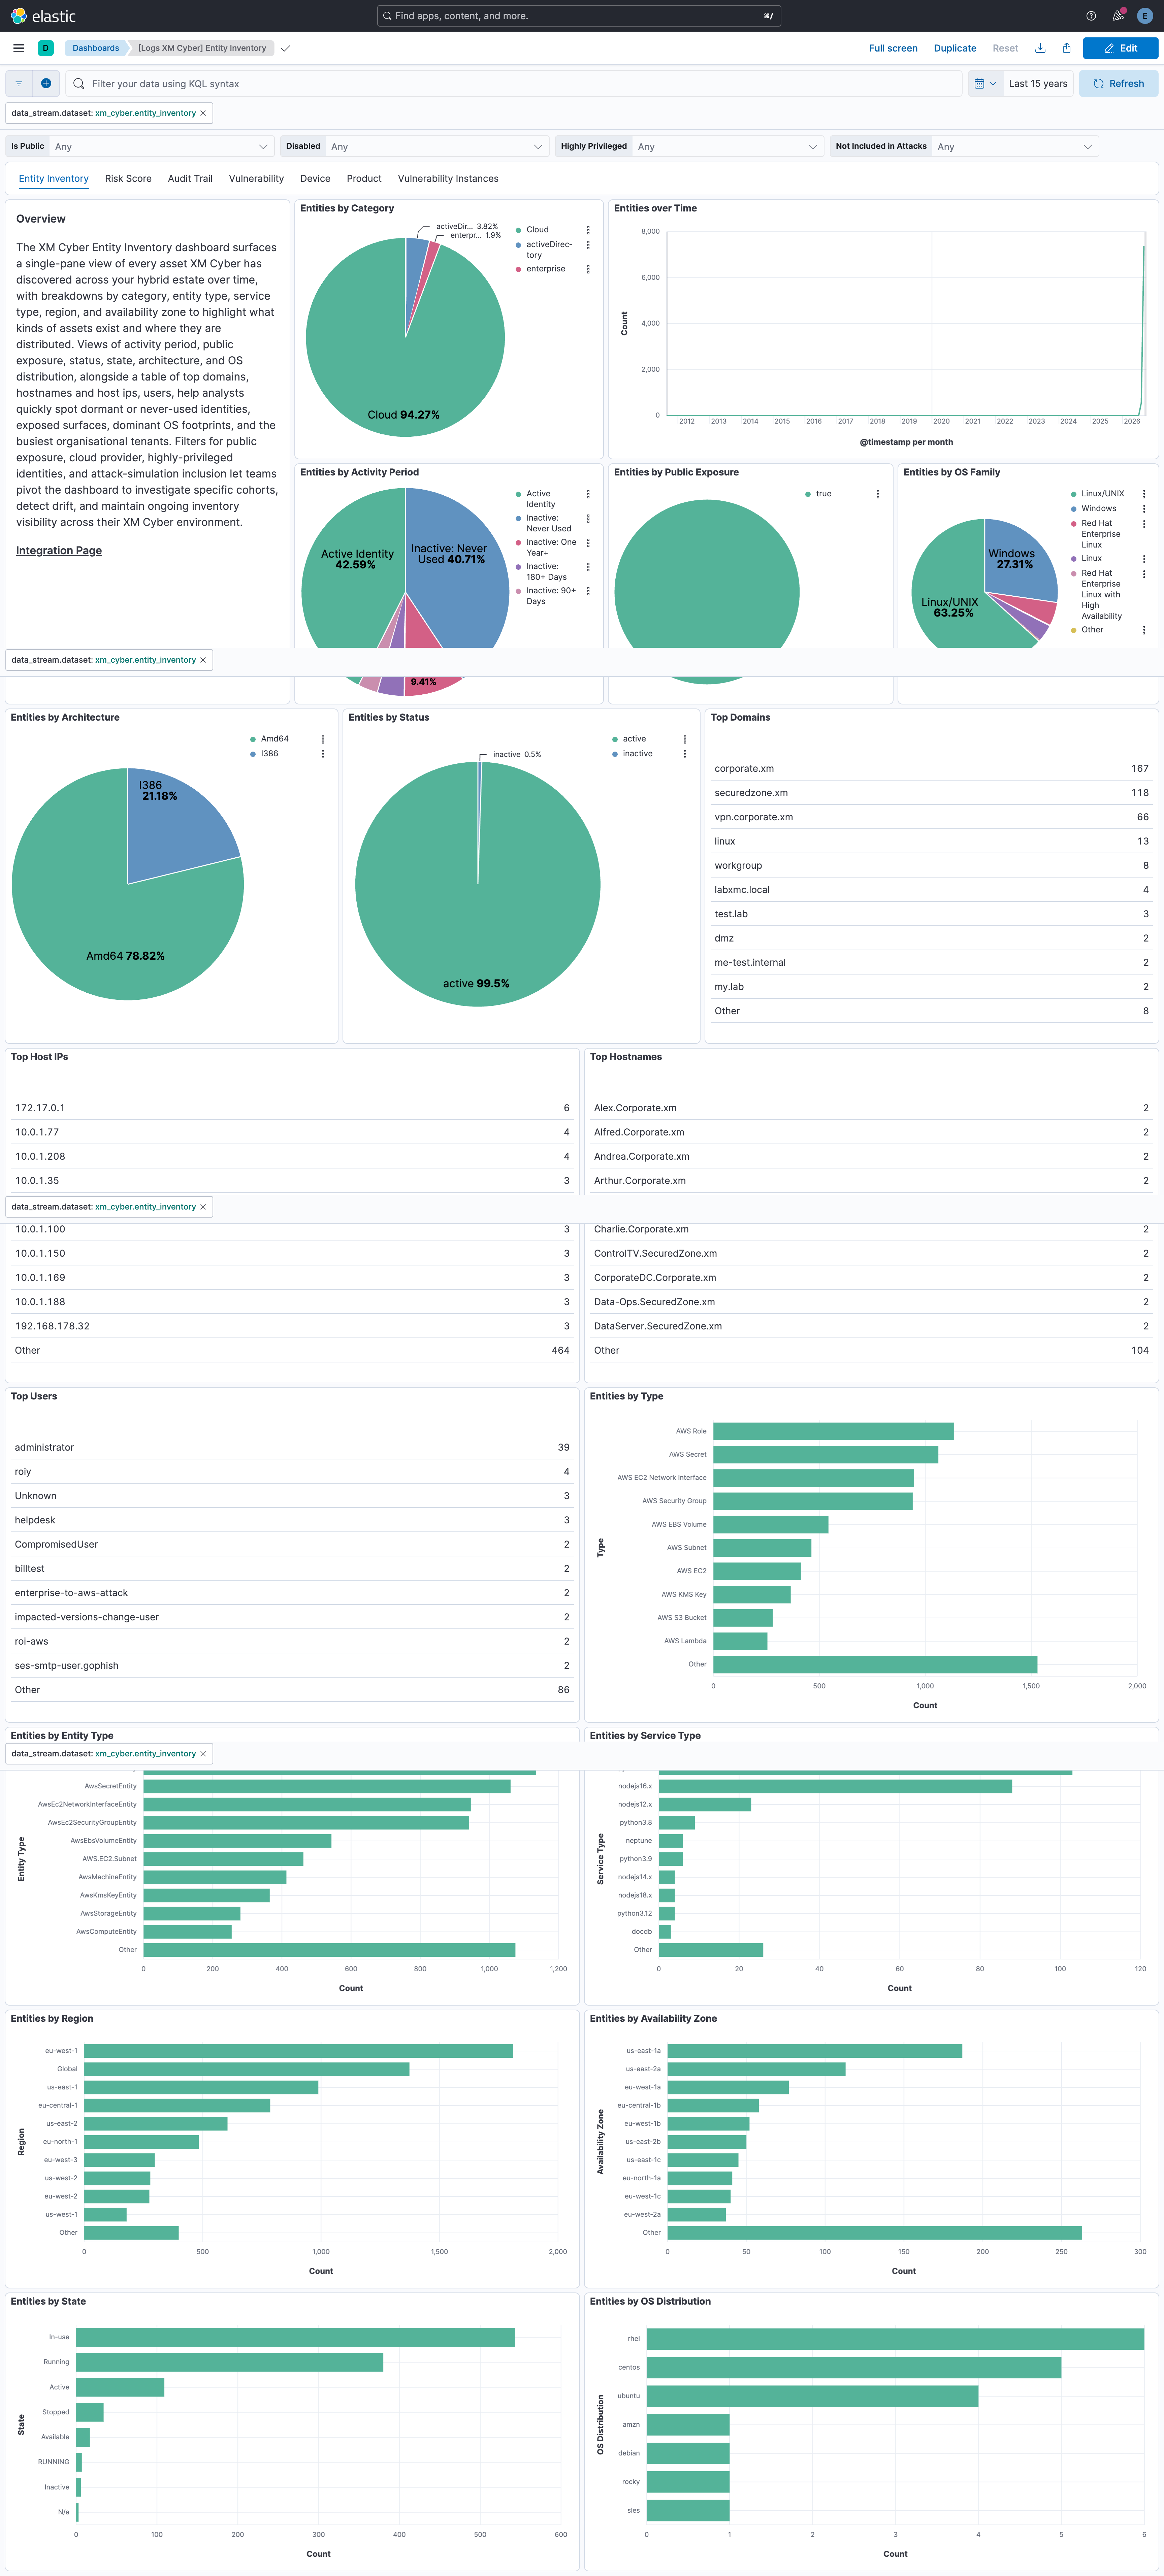
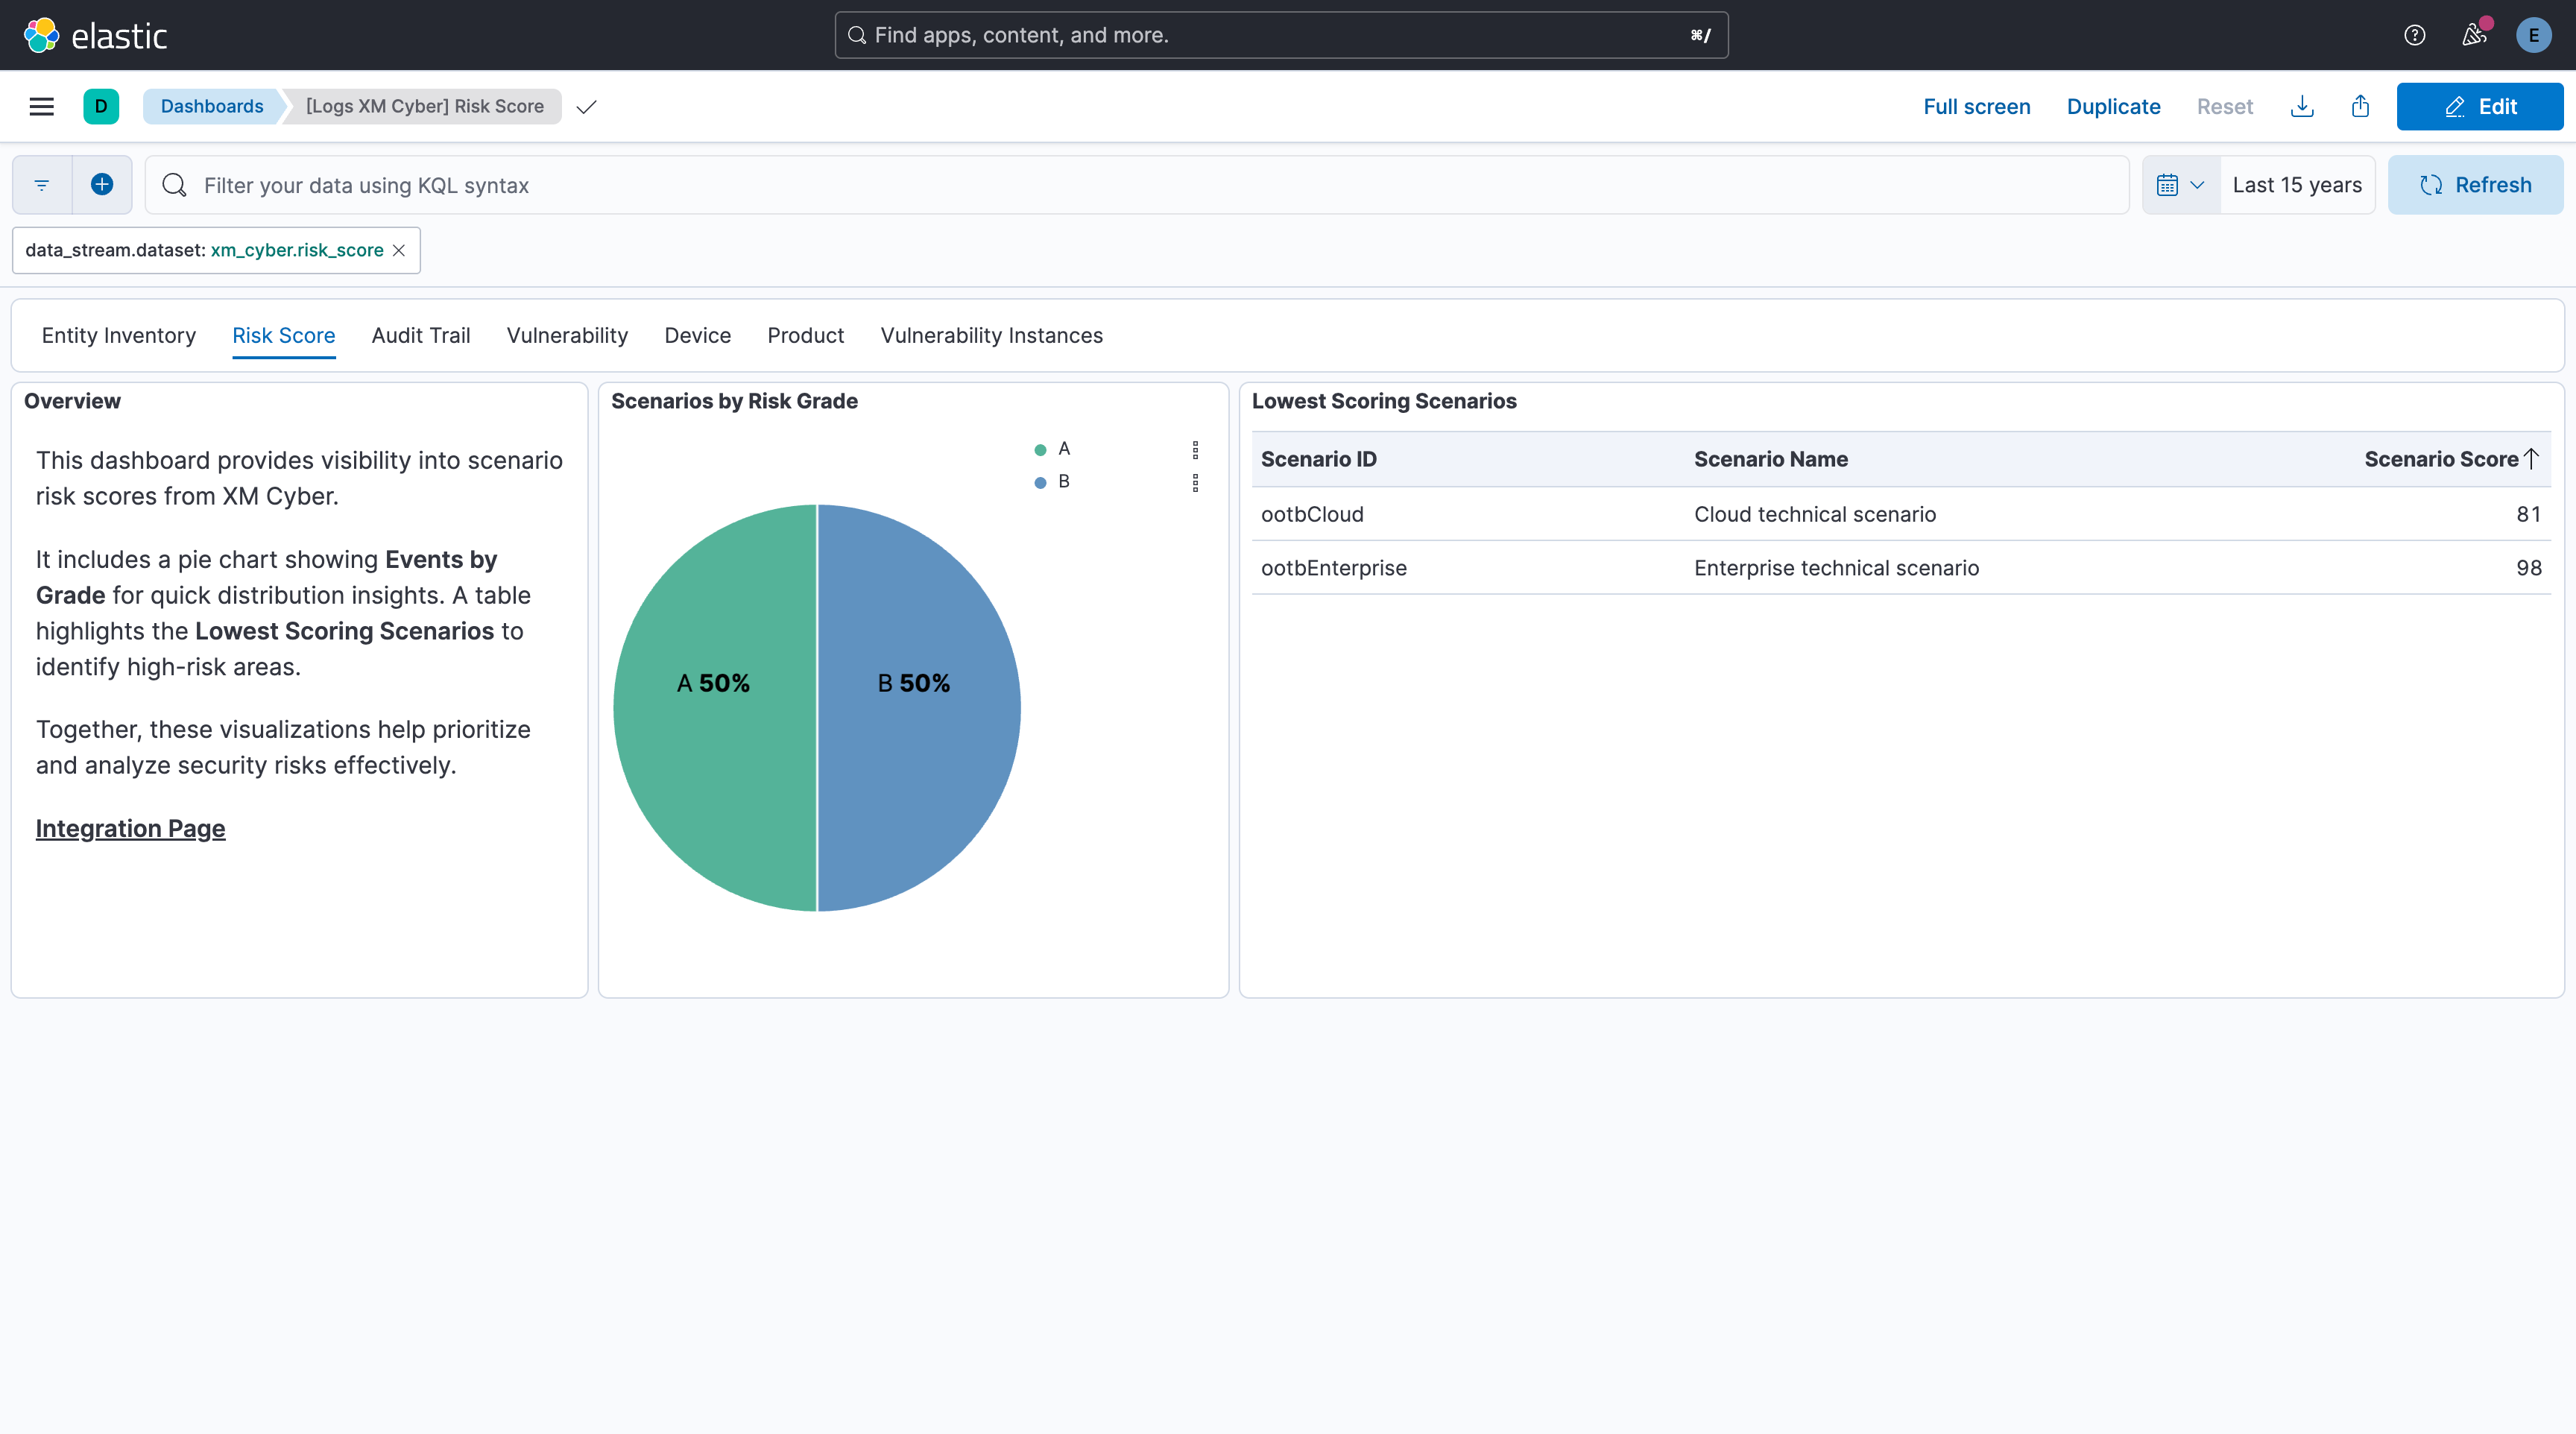
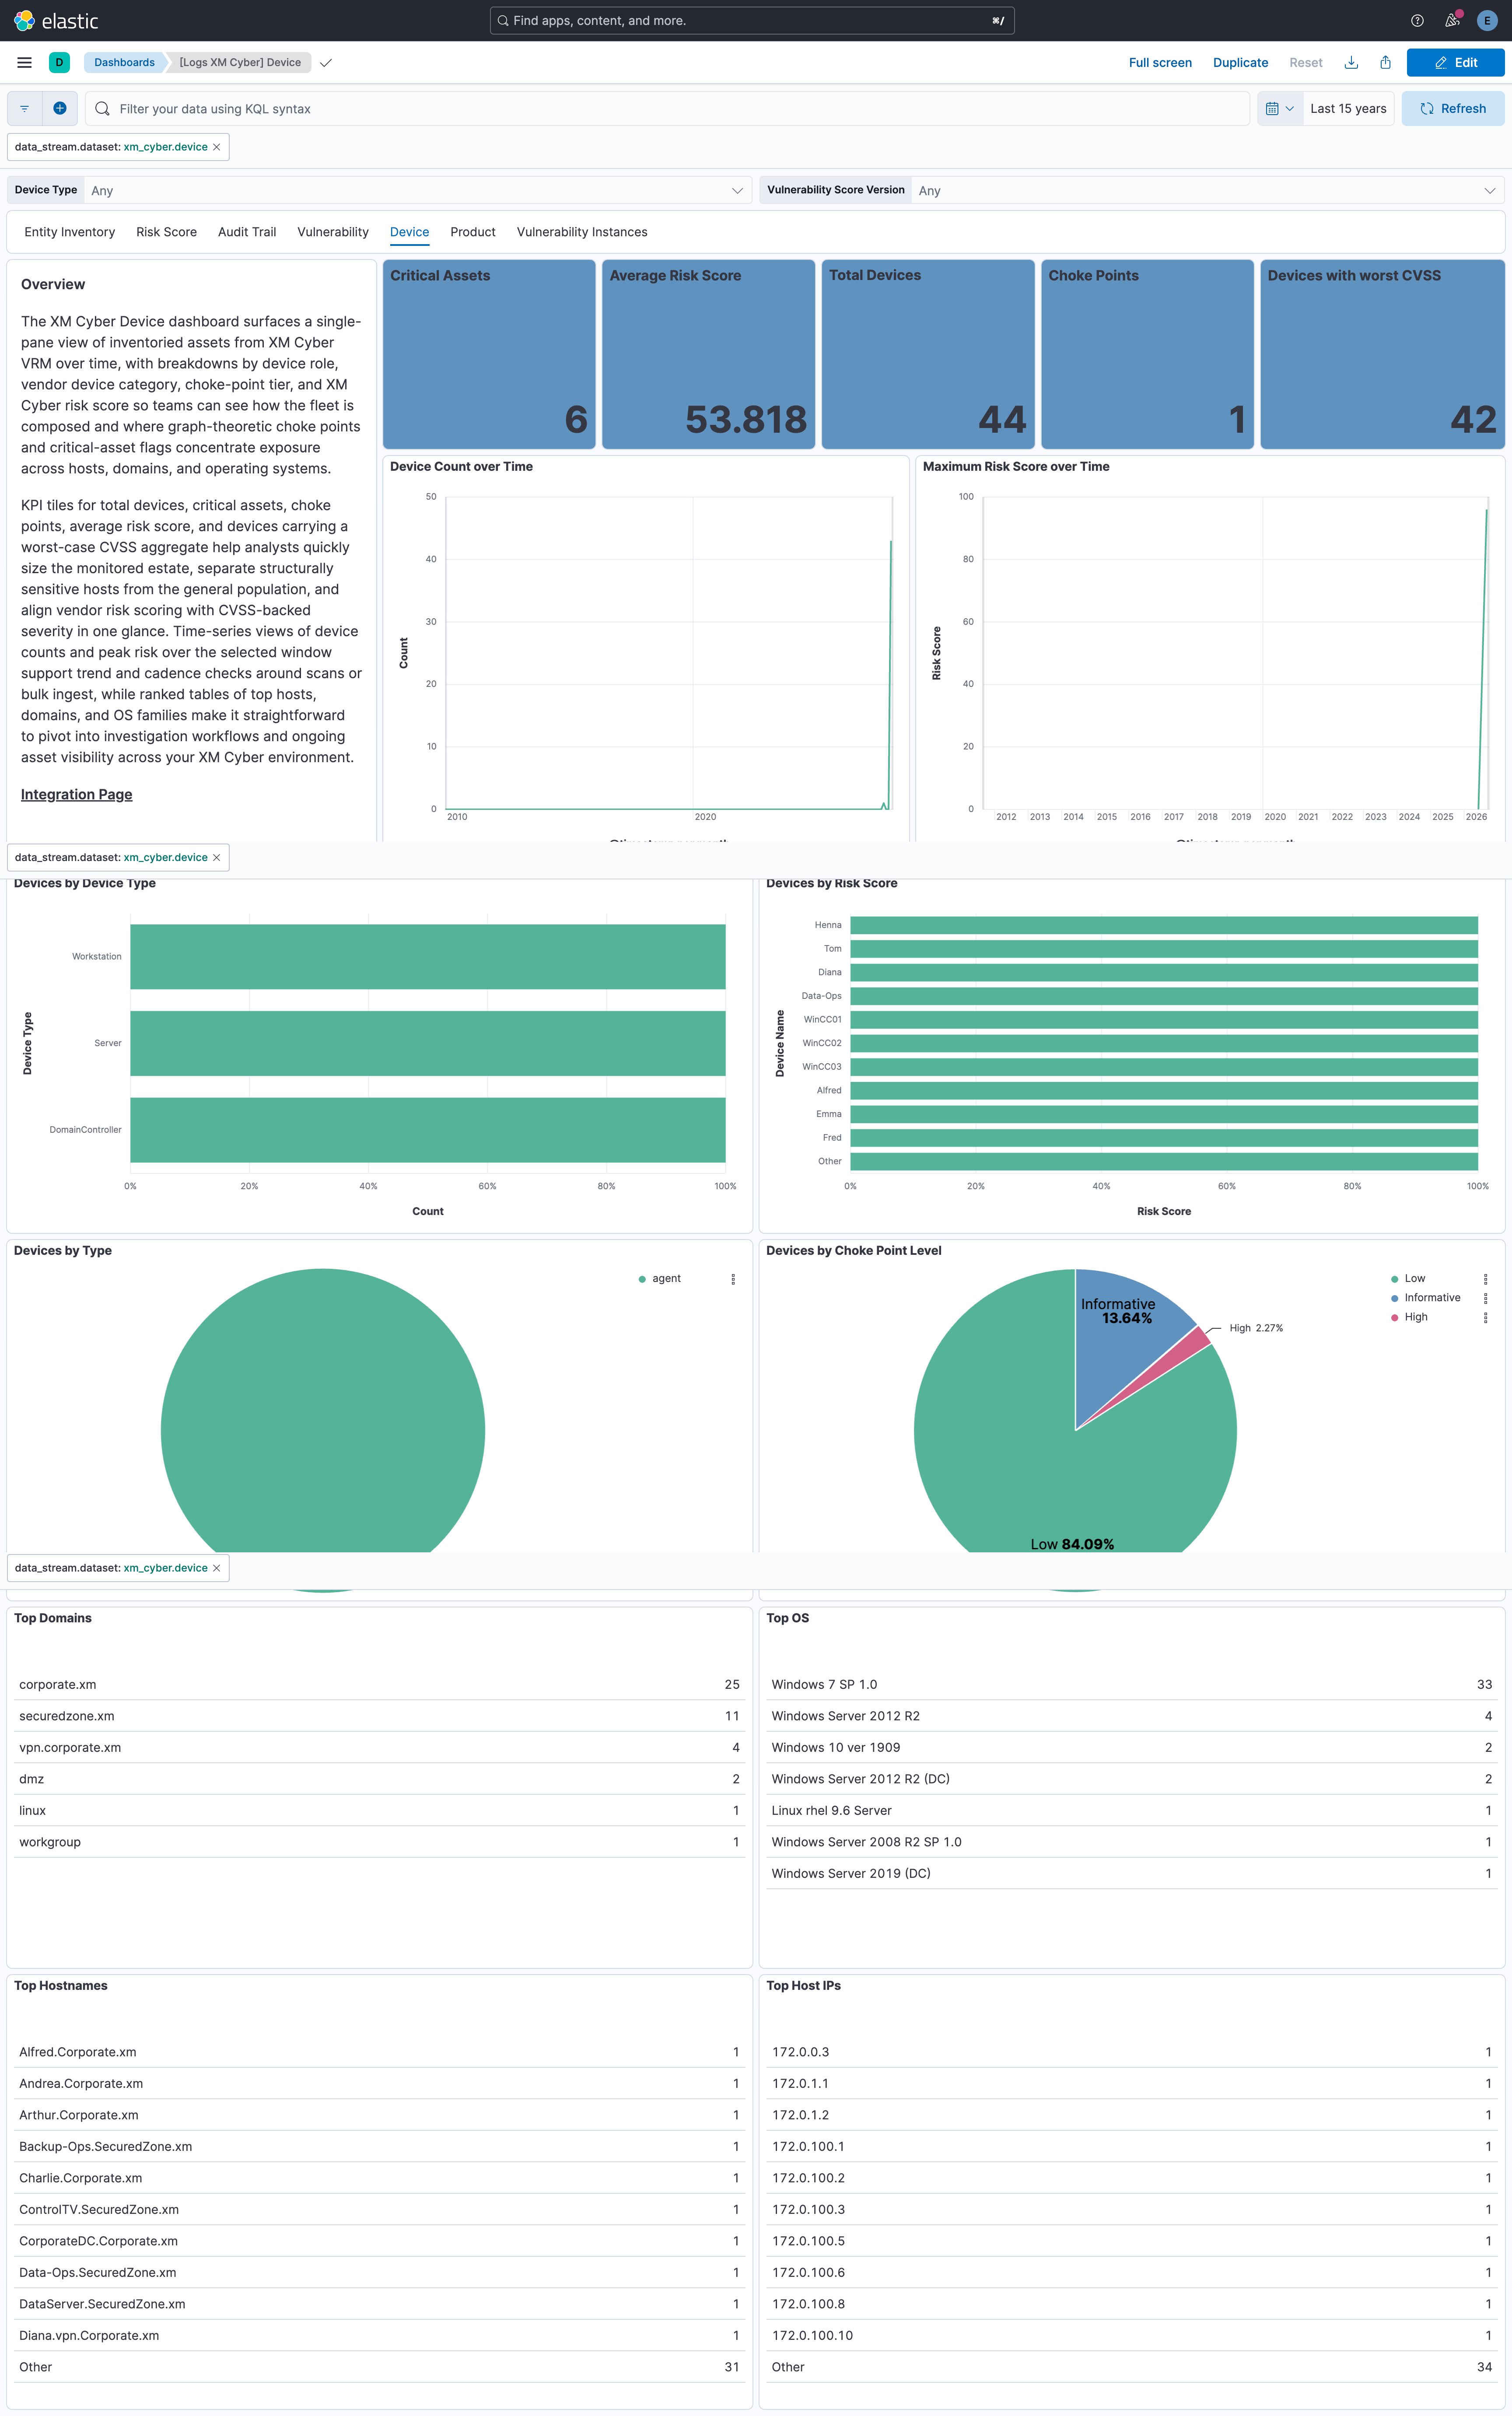
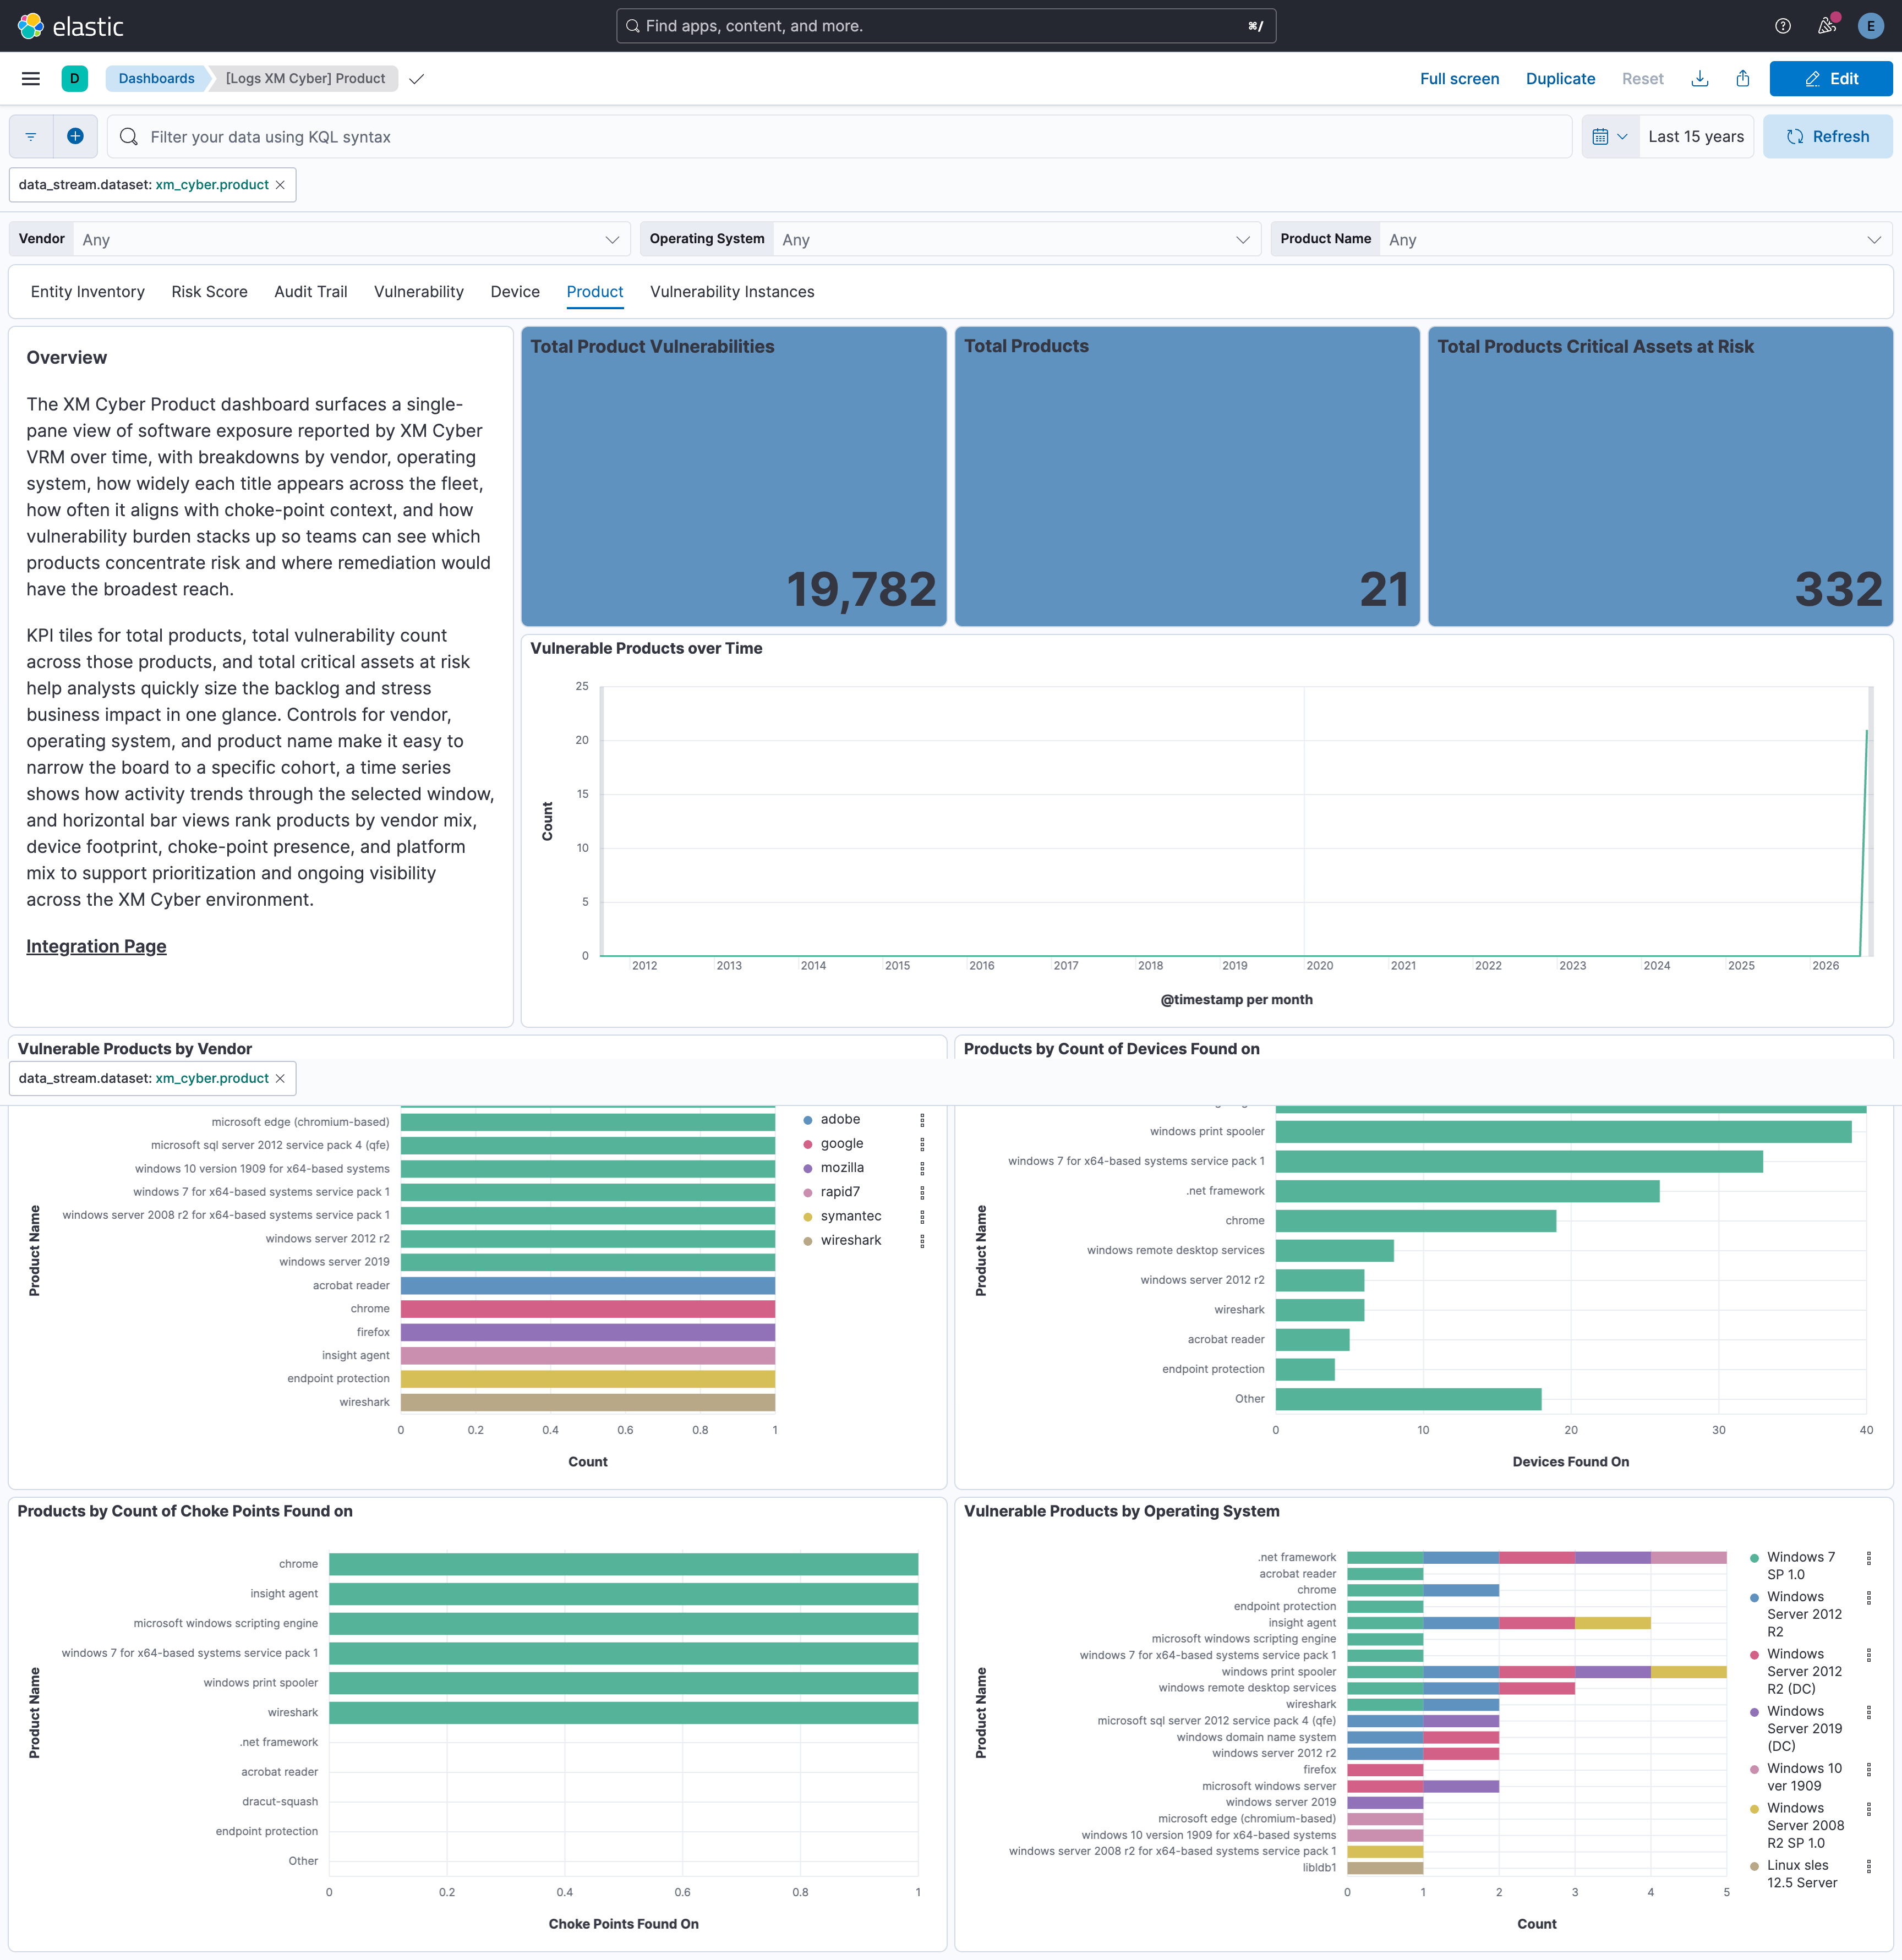
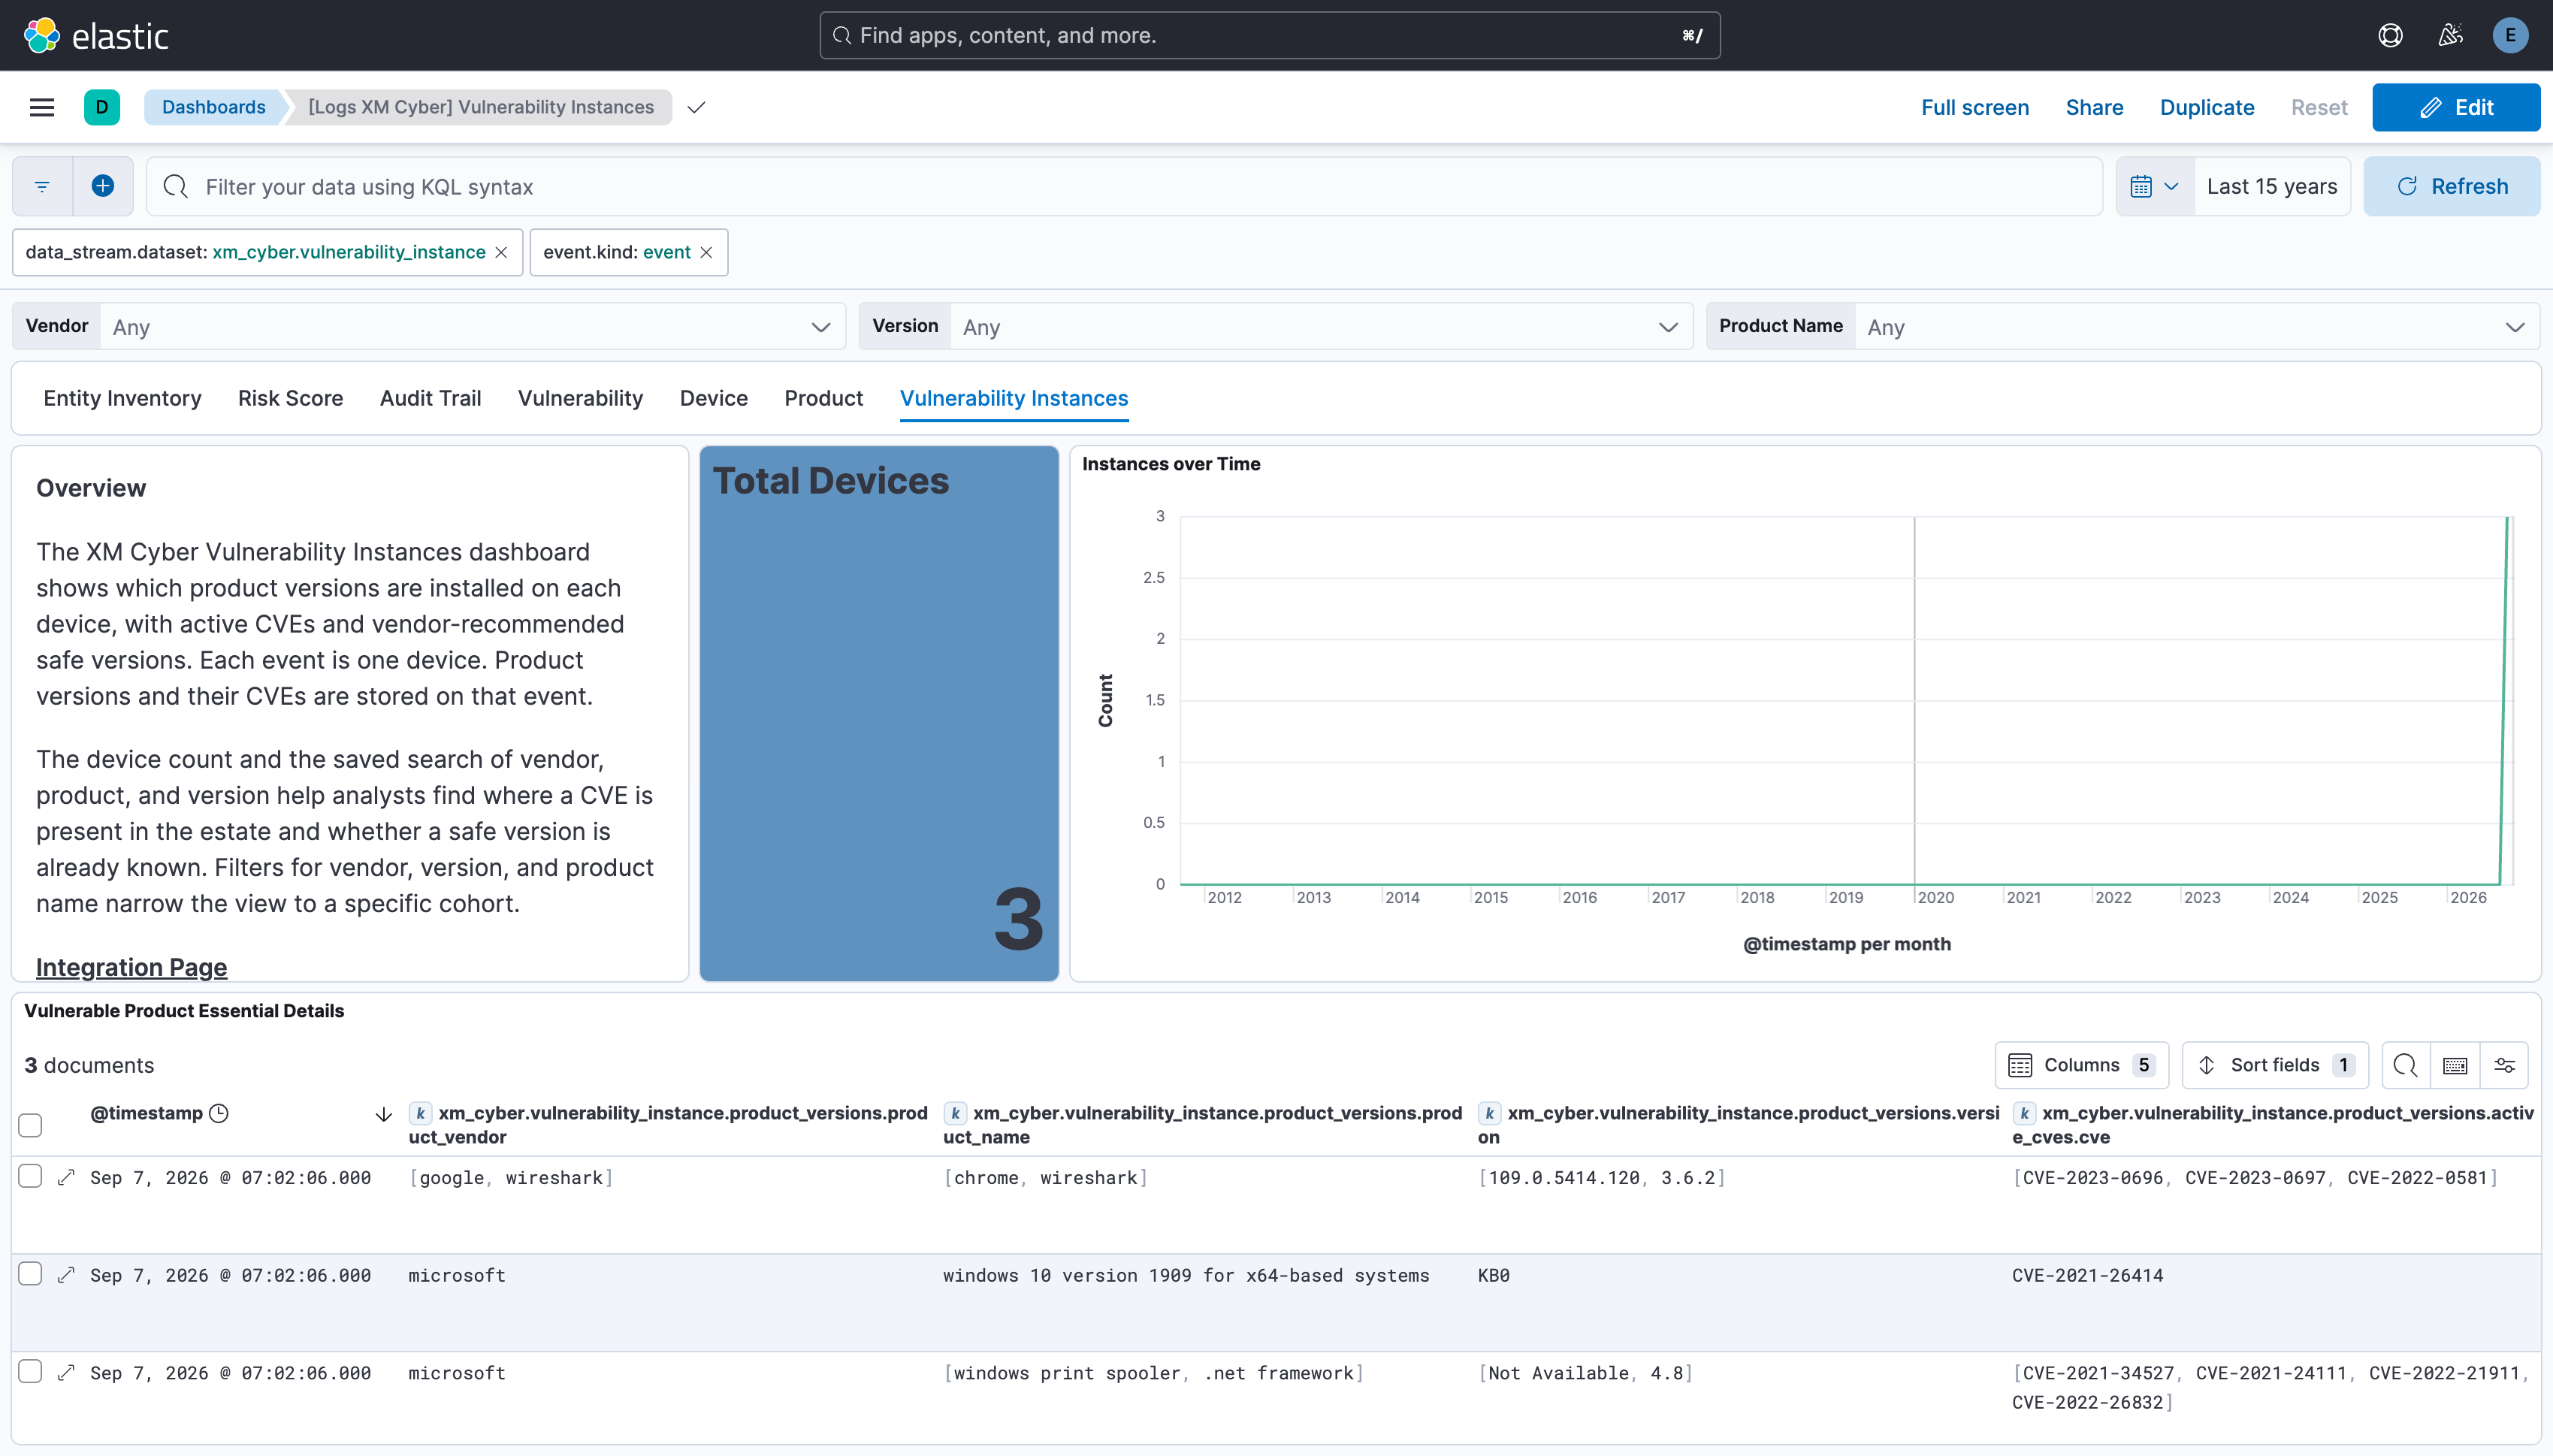
Changelog
| Version | Details | Minimum Kibana version |
|---|---|---|
| 0.5.0 | Enhancement (View pull request) Migrate the vulnerability, device and product data streams to the XM Cyber vrmReport API and add the vulnerability_instance data stream and dashboard.Breaking change (View pull request) Remove xm_cyber.device.is_choke_point, xm_cyber.device.apps.*, xm_cyber.vulnerability.status, xm_cyber.vulnerability.exploit_kit_exist, xm_cyber.vulnerability.is_exploited_in_the_wild and xm_cyber.vulnerability.technique_id, and rename xm_cyber.product.product_operating_systems to xm_cyber.product.product_operating_system, as these are no longer returned by the vrmReport API. |
9.1.0 8.18.0 |
| 0.4.0 | Enhancement (View pull request) Add tags to ingest pipeline processors and add preserve_original_event to pipeline-level on_failure handlers. |
9.1.0 8.18.0 |
| 0.3.0 | Bug fix (View pull request) Fix incorrect values in dashboard panels when API errors occur. Enhancement (View pull request) Remove the unused [Logs XM Cyber] Scenario Details saved search. |
9.1.0 8.18.0 |
| 0.2.0 | Enhancement (View pull request) Add X-XMCYBER-CONNECTOR-NAME-VERSION client identification header to all API requests. |
9.1.0 8.18.0 |
| 0.1.2 | Enhancement (View pull request) Set agentless deployment mode release field to ga. |
9.1.0 8.18.0 |
| 0.1.1 | Enhancement (View pull request) Improve documentation examples. |
9.1.0 8.18.0 |
| 0.1.0 | Enhancement (View pull request) Initial release of XM Cyber integration. Enhancement (View pull request) Sync all data streams together. Enhancement (View pull request) Add support for product data stream. Enhancement (View pull request) Add support for device data stream. Enhancement (View pull request) Add support for risk score data stream. Enhancement (View pull request) Add support for entity inventory data stream. Enhancement (View pull request) Add support for audit trail data stream. Enhancement (View pull request) Add support for vulnerability data stream. |
9.1.0 8.18.0 |