Anduril Lattice Integration for Elastic
| Version | 0.2.0
|
| Subscription level What's this? |
Basic |
| Developed by What's this? |
Elastic |
| Ingestion method(s) | API |
| Minimum Kibana version(s) | 9.2.0 |
To use pre-release integrations, go to the Integrations page in Kibana, scroll down, and toggle on the Display beta integrations option.
The Anduril Lattice integration for Elastic collects entity lifecycle events from the Anduril Lattice command and control (C2) platform. Lattice fuses data from heterogeneous sensor networks — radar, ADS-B, AIS, RF/EW, optical, and Anduril hardware — into a Common Operational Picture (COP). Every tracked or managed item is an Entity: aircraft, surface vessels, ground vehicles, UAS, fixed sensors, geospatial zones, and signals of interest.
This integration collects all entity lifecycle events (created, updated, deleted, preexisting snapshot) and ships them to Elasticsearch for real-time situational awareness, threat monitoring, and asset tracking.
Compatible with the Anduril Lattice REST API v1 (/api/v1/entities/events). Tested against Anduril Lattice SDK v4.0.0.
The integration polls the Lattice long-poll API endpoint (POST /api/v1/entities/events) using a session-token cursor. Each poll returns a batch of entity lifecycle events. The session token is persisted between polls so the integration resumes from where it left off.
On the first poll (empty session token) the Lattice server delivers a snapshot of all currently live entities as EVENT_TYPE_PREEXISTING events, then transitions to streaming ongoing changes. Subsequent polls receive EVENT_TYPE_CREATED, EVENT_TYPE_UPDATE, and EVENT_TYPE_DELETED events as the operational picture evolves.
Two authentication modes are supported:
- Static bearer token — supply a single token; rotation is manual.
- OAuth2 client credentials — supply a client ID and secret; the integration fetches and refreshes access tokens automatically (30-minute lifetime).
For Anduril sandbox/developer environments, an additional sandbox authorization token is required.
The Anduril Lattice integration collects entity lifecycle events from the Lattice long-poll API.
- Real-time situational awareness — track friendly, hostile, and neutral entities across air, surface, land, and sub-surface domains.
- Asset health monitoring — monitor connection status and battery/power state for Anduril hardware assets (towers, sensors).
- Track analysis — correlate track quality, sensor hit count, and kinematic data (position, velocity, heading) for sensor-detected contacts.
- Threat detection — alert on
DISPOSITION_HOSTILEorDISPOSITION_SUSPICIOUSentity classifications. - Geospatial analysis — visualize entity positions on Kibana Maps using the
anduril_lattice.entity.location.geogeo_point field.
- Anduril Lattice environment — a production environment, or a sandbox via the Anduril developer program.
- Credentials — either a static bearer token, or an OAuth2 client ID and client secret generated from the Lattice admin console.
- Network connectivity — the Elastic Agent host must be able to reach the Lattice API over HTTPS (port 443).
Elastic Agent must be installed. For more details, check the Elastic Agent installation instructions. You can install only one Elastic Agent per host.
Elastic Agent polls the Lattice long-poll API and ships events to Elastic, where they are processed by the integration's ingest pipeline.
- Log in to the Lattice admin console for your environment.
- Navigate to Integrations and create a new integration to generate OAuth2 credentials (
client_idandclient_secret), or obtain a static bearer token from your Lattice administrator. - Note your Lattice API base URL (for example,
https://lattice.yourdomain.com). - For sandbox environments, also obtain the
Anduril-Sandbox-Authorizationtoken from the Lattice sandbox documentation. - Ensure the Elastic Agent host has HTTPS/443 access to the Lattice server.
- Anduril Lattice developer portal
- Long-poll entity events API reference
- Getting started / authentication
- Lattice sandbox environments
- In Kibana, navigate to Fleet → Integrations and search for Anduril Lattice.
- Click Add Anduril Lattice and configure the integration:
- Lattice API URL — the base URL of your Lattice environment (for example,
https://lattice.example.com). - Authentication — provide either a static Bearer Token, or an OAuth2 Client ID and Client Secret for automatic token management.
- Sandbox Token — leave empty for production; provide the sandbox token for developer environments.
- Interval — how often to poll for new events (default:
5s).
- Lattice API URL — the base URL of your Lattice environment (for example,
- Save and deploy the policy to the Elastic Agent.
After deploying the integration, verify data is flowing:
- Open Kibana → Discover.
- Select the
logs-anduril_lattice.entity-*index pattern. - Check that events appear with
event.dataset: anduril_lattice.entity. - Confirm entity fields such as
anduril_lattice.entity.entity_id,anduril_lattice.entity.ontology.template, andanduril_lattice.entity.mil_view.dispositionare populated. - Open Kibana Maps and add a layer using the
anduril_lattice.entity.location.geofield to visualize entity positions.
- No data collected: Verify the Lattice API URL is reachable from the Elastic Agent host and that the bearer token or OAuth2 credentials are valid.
- Authentication failures: For OAuth2, ensure the token URL follows the pattern
{base_url}/api/v1/oauth/tokenand that the client credentials have the correct permissions in the Lattice admin console. - Self-signed certificates: If the Lattice environment uses a private CA, configure the
SSL Configurationfield with the customcertificate_authoritiespath. - Sandbox environments: Ensure the
Sandbox Authorization Tokenfield is populated; theAnduril-Sandbox-Authorizationheader is required for developer sandboxes. - Session token loss on restart: The CEL input persists the session token in agent state. On cold restart the integration re-delivers a full entity snapshot as
EVENT_TYPE_PREEXISTINGevents.
The Lattice long-poll API returns all entities in the environment with no server-side filtering. In large environments with many active entities, the initial snapshot might produce thousands of events across multiple polling cycles. Tune Batch Size (default 100, max 2000) and Interval (default 5s) for your environment's entity density.
For more information on architectures that can be used for scaling this integration, check the Ingest Architectures documentation.
These inputs can be used with this integration:
cel
For more details about the CEL input settings, check the Filebeat documentation.
Before configuring the CEL input, make sure you have:
- Network connectivity to the target API endpoint
- Valid authentication credentials (API keys, tokens, or certificates as required)
- Appropriate permissions to read from the target data source
To configure the CEL input, you must specify the request.url value pointing to the API endpoint. The interval parameter controls how frequently requests are made and is the primary way to balance data freshness with API rate limits and costs. Authentication is often configured through the request.headers section using the appropriate method for the service.
To access the API service, make sure you have the necessary API credentials and that the Filebeat instance can reach the endpoint URL. Some services may require IP whitelisting or VPN access.
To collect logs via API endpoint, configure the following parameters:
- API Endpoint URL
- API credentials (tokens, keys, or username/password)
- Request interval (how often to fetch data)
These APIs are used with this integration:
POST /api/v1/entities/events— Long-poll entity events: returns batches of entity lifecycle events with a session-token cursor for incremental collection.POST /api/v1/oauth/token— OAuth2 token endpoint: used to obtain and refresh bearer tokens when OAuth2 client credentials are configured.
The entity data stream collects entity lifecycle events from the Anduril Lattice long-poll API. Each event represents a state change for a tracked entity in the Lattice Common Operational Picture — creation, update, deletion, or preexisting snapshot on session start.
Entity sub-types (distinguished by anduril_lattice.entity.ontology.template):
TEMPLATE_TRACK— sensor-tracked transient contacts (aircraft, vessels, UAVs)TEMPLATE_ASSET— persistent managed assets (sensors, towers, Anduril hardware)TEMPLATE_GEO— geospatial zones (keep-in, keep-out, engagement zones)TEMPLATE_SENSOR_POINT_OF_INTEREST— sensor-detected points of interestTEMPLATE_SIGNAL_OF_INTEREST— RF/EW signal entities
Exported fields
| Field | Description | Type |
|---|---|---|
| @timestamp | Date/time when the event originated. This is the date/time extracted from the event, typically representing when the event was generated by the source. If the event source has no original timestamp, this value is typically populated by the first time the event was received by the pipeline. Required field for all events. | date |
| anduril_lattice.entity.aliases.alternate_id_types | Alternate identifier type labels extracted from alternateIds array. | keyword |
| anduril_lattice.entity.aliases.alternate_ids | Alternate identifier values extracted from alternateIds array. | keyword |
| anduril_lattice.entity.aliases.name | Human-readable alias name for the entity. | keyword |
| anduril_lattice.entity.correlation.membership_set_id | Correlation set identifier for group membership. | keyword |
| anduril_lattice.entity.correlation.primary_secondary_entity_ids | Secondary entity IDs associated with this primary entity. | keyword |
| anduril_lattice.entity.correlation.secondary_primary_entity_id | Primary entity ID that this secondary entity is correlated to. | keyword |
| anduril_lattice.entity.data_classification.caveats | Classification caveats or handling instructions. | keyword |
| anduril_lattice.entity.data_classification.level | Classification level (for example, UNCLASSIFIED, SECRET). | keyword |
| anduril_lattice.entity.dimensions.length_m | Length of the entity in meters. | float |
| anduril_lattice.entity.entity_id | Unique identifier for the entity. | keyword |
| anduril_lattice.entity.event_type | Type of entity lifecycle event. One of: EVENT_TYPE_CREATED, EVENT_TYPE_UPDATE, EVENT_TYPE_PREEXISTING, EVENT_TYPE_DELETED, EVENT_TYPE_POST_EXPIRY_OVERRIDE. | keyword |
| anduril_lattice.entity.geo_details.acm.description | ACM description. | keyword |
| anduril_lattice.entity.geo_details.acm.type | ACM type. | keyword |
| anduril_lattice.entity.geo_details.control_area_type | Control area type for the geo entity. | keyword |
| anduril_lattice.entity.geo_details.type | Geo entity type. | keyword |
| anduril_lattice.entity.geo_shape | Entity declared geometry as a GeoJSON shape derived from geoShape (point, line, or polygon). | geo_shape |
| anduril_lattice.entity.geo_shape.coordinates | Coordinates of the geo_shape geometry. | object |
| anduril_lattice.entity.geo_shape.type | GeoJSON geometry type (for example, "Polygon," "MultiPolygon.") | keyword |
| anduril_lattice.entity.geo_shape_ellipse.height_m | Height of the ellipse in meters. | float |
| anduril_lattice.entity.geo_shape_ellipse.orientation_d | Orientation of the ellipse semi-major axis in degrees from North. | float |
| anduril_lattice.entity.geo_shape_ellipse.semi_major_axis_m | Semi-major axis of the ellipse in meters. | float |
| anduril_lattice.entity.geo_shape_ellipse.semi_minor_axis_m | Semi-minor axis of the ellipse in meters. | float |
| anduril_lattice.entity.geo_shape_ellipsoid.forward_axis_m | Forward (x) semi-axis of the ellipsoid in meters. | float |
| anduril_lattice.entity.geo_shape_ellipsoid.side_axis_m | Side (y) semi-axis of the ellipsoid in meters. | float |
| anduril_lattice.entity.geo_shape_ellipsoid.up_axis_m | Up (z) semi-axis of the ellipsoid in meters. | float |
| anduril_lattice.entity.group_details.army_echelon | Army echelon designation (for example, ARMY_ECHELON_PLATOON). | keyword |
| anduril_lattice.entity.health.active_alerts.activated_time | ISO8601 timestamps when each alert was activated (stored as keyword). | keyword |
| anduril_lattice.entity.health.active_alerts.alert_code | Alert code identifiers. | keyword |
| anduril_lattice.entity.health.active_alerts.description | Alert descriptions. | keyword |
| anduril_lattice.entity.health.active_alerts.level | Alert severity levels. | keyword |
| anduril_lattice.entity.health.connection_status | Asset connection status. Examples: CONNECTION_STATUS_ONLINE, CONNECTION_STATUS_OFFLINE, CONNECTION_STATUS_DEGRADED. | keyword |
| anduril_lattice.entity.health.health_status | Overall health status. Examples: HEALTH_STATUS_HEALTHY, HEALTH_STATUS_DEGRADED, HEALTH_STATUS_CRITICAL. | keyword |
| anduril_lattice.entity.health.update_time | Time of the last health status update. | date |
| anduril_lattice.entity.indicators.c2 | Whether this entity is a command and control node. | boolean |
| anduril_lattice.entity.indicators.egressable | Whether this entity can be egressed to external systems. | boolean |
| anduril_lattice.entity.indicators.emergency | Whether this entity is in an emergency state. | boolean |
| anduril_lattice.entity.indicators.exercise | Whether this entity is part of a live exercise. | boolean |
| anduril_lattice.entity.indicators.simulated | Whether this entity is part of a simulation or exercise. | boolean |
| anduril_lattice.entity.indicators.starred | Whether this entity has been starred/bookmarked by an operator. | boolean |
| anduril_lattice.entity.is_live | Whether the entity is currently live and active. | boolean |
| anduril_lattice.entity.location.acceleration_enu.e | East component of acceleration in m/s². | float |
| anduril_lattice.entity.location.acceleration_enu.n | North component of acceleration in m/s². | float |
| anduril_lattice.entity.location.acceleration_enu.u | Up component of acceleration in m/s². | float |
| anduril_lattice.entity.location.altitude_agl_meters | Altitude above ground level in meters. | double |
| anduril_lattice.entity.location.altitude_asf_meters | Altitude above sea floor in meters. | double |
| anduril_lattice.entity.location.altitude_hae_meters | Altitude above WGS-84 ellipsoid in meters. | double |
| anduril_lattice.entity.location.attitude_enu.w | W (scalar) component of attitude quaternion. | float |
| anduril_lattice.entity.location.attitude_enu.x | X component of attitude quaternion. | float |
| anduril_lattice.entity.location.attitude_enu.y | Y component of attitude quaternion. | float |
| anduril_lattice.entity.location.attitude_enu.z | Z component of attitude quaternion. | float |
| anduril_lattice.entity.location.geo | Geographic position of the entity as a geo_point derived from latitudeDegrees and longitudeDegrees. | geo_point |
| anduril_lattice.entity.location.geo.coordinates | Coordinates of the geo_point as [lon, lat]. | object |
| anduril_lattice.entity.location.geo.type | GeoJSON type of the geo_point (always "Point"). | keyword |
| anduril_lattice.entity.location.pressure_depth_meters | Depth derived from pressure in meters. | double |
| anduril_lattice.entity.location.speed_mps | Speed over ground in meters per second. | double |
| anduril_lattice.entity.location.velocity_enu.e | East component of velocity in m/s. | double |
| anduril_lattice.entity.location.velocity_enu.n | North component of velocity in m/s. | double |
| anduril_lattice.entity.location.velocity_enu.u | Up component of velocity in m/s. | double |
| anduril_lattice.entity.location_uncertainty.position_enu_cov.mxx | Position covariance mxx. | float |
| anduril_lattice.entity.location_uncertainty.position_enu_cov.mxy | Position covariance mxy. | float |
| anduril_lattice.entity.location_uncertainty.position_enu_cov.mxz | Position covariance mxz. | float |
| anduril_lattice.entity.location_uncertainty.position_enu_cov.myy | Position covariance myy. | float |
| anduril_lattice.entity.location_uncertainty.position_enu_cov.myz | Position covariance myz. | float |
| anduril_lattice.entity.location_uncertainty.position_enu_cov.mzz | Position covariance mzz. | float |
| anduril_lattice.entity.location_uncertainty.position_error_ellipse.orientation_d | Orientation of the error ellipse semi-major axis in degrees from North. | float |
| anduril_lattice.entity.location_uncertainty.position_error_ellipse.probability | Probability level of the error ellipse (0–1). | float |
| anduril_lattice.entity.location_uncertainty.position_error_ellipse.semi_major_axis_m | Semi-major axis of the position error ellipse in meters. | float |
| anduril_lattice.entity.location_uncertainty.position_error_ellipse.semi_minor_axis_m | Semi-minor axis of the position error ellipse in meters. | float |
| anduril_lattice.entity.location_uncertainty.velocity_enu_cov.mxx | Velocity covariance mxx. | float |
| anduril_lattice.entity.location_uncertainty.velocity_enu_cov.mxy | Velocity covariance mxy. | float |
| anduril_lattice.entity.location_uncertainty.velocity_enu_cov.mxz | Velocity covariance mxz. | float |
| anduril_lattice.entity.location_uncertainty.velocity_enu_cov.myy | Velocity covariance myy. | float |
| anduril_lattice.entity.location_uncertainty.velocity_enu_cov.myz | Velocity covariance myz. | float |
| anduril_lattice.entity.location_uncertainty.velocity_enu_cov.mzz | Velocity covariance mzz. | float |
| anduril_lattice.entity.media.item_identifier | Media item identifiers. | keyword |
| anduril_lattice.entity.media.relative_path | Relative paths to media items. | keyword |
| anduril_lattice.entity.media.type | Media types (for example, IMAGE, VIDEO). | keyword |
| anduril_lattice.entity.mil_view.disposition | Military disposition of the entity. Examples: DISPOSITION_FRIENDLY, DISPOSITION_ASSUMED_FRIENDLY, DISPOSITION_HOSTILE, DISPOSITION_NEUTRAL, DISPOSITION_SUSPECT, DISPOSITION_UNKNOWN. | keyword |
| anduril_lattice.entity.mil_view.environment | Operational environment. Examples: ENVIRONMENT_SURFACE, ENVIRONMENT_LAND, ENVIRONMENT_AIR, ENVIRONMENT_SUBSURFACE, ENVIRONMENT_SPACE. | keyword |
| anduril_lattice.entity.mil_view.nationality | Nationality code of the entity. | keyword |
| anduril_lattice.entity.no_expiry | Whether the entity has no expiry time (persistent asset). | boolean |
| anduril_lattice.entity.ontology.platform_type | Platform type of the entity. Examples: SURFACE_VESSEL, FIXED_SENSOR, GROUND_VEHICLE, AIRCRAFT, SUBMARINE. | keyword |
| anduril_lattice.entity.ontology.specific_type | More granular platform type classification. | keyword |
| anduril_lattice.entity.ontology.template | Entity template type determining which fields are populated. Examples: TEMPLATE_TRACK, TEMPLATE_ASSET, TEMPLATE_SIGNAL, TEMPLATE_ALERT, TEMPLATE_GEO_ENTITY, TEMPLATE_EM_ENTITY. | keyword |
| anduril_lattice.entity.orbit.bstar | BSTAR drag term from TLE. | float |
| anduril_lattice.entity.orbit.eccentricity | Orbital eccentricity (dimensionless). | float |
| anduril_lattice.entity.orbit.epoch | Epoch time of the mean orbital elements. | date |
| anduril_lattice.entity.orbit.inclination_deg | Orbital inclination in degrees. | float |
| anduril_lattice.entity.orbit.norad_cat_id | NORAD catalog number. | long |
| anduril_lattice.entity.orbit.semi_major_axis_km | Semi-major axis in kilometers. | float |
| anduril_lattice.entity.overrides.field_paths | Field paths targeted by overrides. | keyword |
| anduril_lattice.entity.overrides.request_ids | Override request identifiers. | keyword |
| anduril_lattice.entity.overrides.request_timestamps | ISO8601 timestamps when override requests were submitted (stored as keyword). | keyword |
| anduril_lattice.entity.overrides.statuses | Override request statuses. | keyword |
| anduril_lattice.entity.overrides.types | Override types. | keyword |
| anduril_lattice.entity.payloads.capability_id | Payload capability identifiers. | keyword |
| anduril_lattice.entity.payloads.description | Payload descriptions. | keyword |
| anduril_lattice.entity.payloads.operational_state | Payload operational state values. | keyword |
| anduril_lattice.entity.payloads.quantity | Payload quantities. | integer |
| anduril_lattice.entity.power_state | Power state information keyed by power source ID. The map structure uses arbitrary string keys and is stored as a flattened object. | flattened |
| anduril_lattice.entity.provenance.data_type | Data type or sensor type of the entity source. | keyword |
| anduril_lattice.entity.provenance.source_description | Human-readable description of the source. | keyword |
| anduril_lattice.entity.provenance.source_id | Source system identifier. | keyword |
| anduril_lattice.entity.provenance.source_update_time | Time when the source system last updated the entity. | date |
| anduril_lattice.entity.relationships | Entity relationship data stored as a flattened object. | flattened |
| anduril_lattice.entity.route_details.destination_name | Name of the destination waypoint or location. | keyword |
| anduril_lattice.entity.route_details.estimated_arrival_time | Estimated time of arrival at the destination. | date |
| anduril_lattice.entity.sensors.fields_of_view.geo | Sensor field-of-view footprint polygons derived from projectedFrustum corners. Stored as an array of GeoJSON Polygon objects. | geo_shape |
| anduril_lattice.entity.sensors.fields_of_view.geo.coordinates | Coordinates of the geo_shape geometry. | object |
| anduril_lattice.entity.sensors.fields_of_view.geo.type | GeoJSON geometry type (for example, "Polygon," "MultiPolygon.") | keyword |
| anduril_lattice.entity.sensors.last_detection_timestamp | ISO8601 timestamps of the last detection per sensor (stored as keyword). | keyword |
| anduril_lattice.entity.sensors.operational_state | Sensor operational states. | keyword |
| anduril_lattice.entity.sensors.sensor_description | Sensor descriptions. | keyword |
| anduril_lattice.entity.sensors.sensor_id | Sensor identifiers. | keyword |
| anduril_lattice.entity.sensors.sensor_type | Sensor types. | keyword |
| anduril_lattice.entity.signal.bandwidth_hz | Signal bandwidth in Hz. | double |
| anduril_lattice.entity.signal.emitter_notations | Emitter notation identifiers associated with this signal. | keyword |
| anduril_lattice.entity.signal.frequency_center_hz | Center frequency of the detected signal in Hz. | double |
| anduril_lattice.entity.signal.frequency_max_hz | Maximum frequency of the signal range in Hz. | double |
| anduril_lattice.entity.signal.frequency_min_hz | Minimum frequency of the signal range in Hz. | double |
| anduril_lattice.entity.signal.pulse_width_s | Pulse width in seconds. | float |
| anduril_lattice.entity.signal.scan_period_s | Scan period in seconds. | float |
| anduril_lattice.entity.signal.scan_type | Radar/signal scan type. | keyword |
| anduril_lattice.entity.signal.signal_to_noise_ratio | Signal-to-noise ratio in dB. | float |
| anduril_lattice.entity.status.platform_activity | Platform activity state of the entity. | keyword |
| anduril_lattice.entity.status.role | Operational role of the entity. | keyword |
| anduril_lattice.entity.supplies.fuel_amount_gallons | Current fuel amounts in gallons. | float |
| anduril_lattice.entity.supplies.fuel_id | Fuel type identifiers. | keyword |
| anduril_lattice.entity.supplies.fuel_max_authorized_capacity_gallons | Maximum authorized fuel capacity in gallons. | float |
| anduril_lattice.entity.supplies.fuel_name | Fuel type names. | keyword |
| anduril_lattice.entity.supplies.munition_id | Munition identifiers. | keyword |
| anduril_lattice.entity.supplies.munition_name | Munition names. | keyword |
| anduril_lattice.entity.supplies.munition_quantity_units | Munition quantity units (e.g. ROUNDS, MISSILES). | keyword |
| anduril_lattice.entity.symbology.mil_std_2525c_sidc | MIL-STD-2525C Symbol Identification Code. | keyword |
| anduril_lattice.entity.target_priority.is_high_payoff_target | Whether this entity is designated as a high-payoff target. | boolean |
| anduril_lattice.entity.target_priority.is_high_value_target | Whether this entity is designated as a high-value target. | boolean |
| anduril_lattice.entity.target_priority.is_threat | Whether this entity is assessed as a threat. | boolean |
| anduril_lattice.entity.target_priority.priority | Numeric target priority rank. | integer |
| anduril_lattice.entity.task_catalog.task_specification_urls | Task specification URLs from the task catalog. | keyword |
| anduril_lattice.entity.tracked.last_measurement_time | Time of the last sensor measurement contributing to this track. | date |
| anduril_lattice.entity.tracked.line_of_bearing.max_range_m | Maximum range along line of bearing in meters. | float |
| anduril_lattice.entity.tracked.line_of_bearing.range_estimate_m | Range estimate along line of bearing in meters. | float |
| anduril_lattice.entity.tracked.number_of_objects.lower_bound | Lower bound of the object count estimate. | integer |
| anduril_lattice.entity.tracked.number_of_objects.upper_bound | Upper bound of the object count estimate. | integer |
| anduril_lattice.entity.tracked.radar_cross_section | Radar cross section estimate in square meters. | float |
| anduril_lattice.entity.tracked.sensor_hits | Number of sensors contributing to this track. | long |
| anduril_lattice.entity.tracked.track_quality | Track quality score (0-9 scale). | long |
| anduril_lattice.entity.transponder_codes.mode1 | Mode 1 IFF code. | integer |
| anduril_lattice.entity.transponder_codes.mode2 | Mode 2 IFF code. | integer |
| anduril_lattice.entity.transponder_codes.mode3 | Mode 3/A IFF code. | integer |
| anduril_lattice.entity.transponder_codes.mode5 | Mode 5 IFF code. | long |
| anduril_lattice.entity.transponder_codes.mode5_platform_id | Mode 5 platform identifier. | long |
| anduril_lattice.entity.transponder_codes.mode_c_altitude_ft | Mode C altitude in feet. | integer |
| anduril_lattice.entity.transponder_codes.mode_s_address | Mode S ICAO 24-bit address. | long |
| anduril_lattice.entity.transponder_codes.mode_s_id | Mode S ICAO aircraft identifier string. | keyword |
| anduril_lattice.entity.visual_details.range_rings.max_distance_m | Maximum range ring distance in meters. | float |
| anduril_lattice.entity.visual_details.range_rings.min_distance_m | Minimum range ring distance in meters. | float |
| anduril_lattice.entity.visual_details.range_rings.ring_count | Number of range rings to display. | integer |
| data_stream.dataset | The field can contain anything that makes sense to signify the source of the data. Examples include nginx.access, prometheus, endpoint etc. For data streams that otherwise fit, but that do not have dataset set we use the value "generic" for the dataset value. event.dataset should have the same value as data_stream.dataset. Beyond the Elasticsearch data stream naming criteria noted above, the dataset value has additional restrictions: * Must not contain - * No longer than 100 characters |
constant_keyword |
| data_stream.namespace | A user defined namespace. Namespaces are useful to allow grouping of data. Many users already organize their indices this way, and the data stream naming scheme now provides this best practice as a default. Many users will populate this field with default. If no value is used, it falls back to default. Beyond the Elasticsearch index naming criteria noted above, namespace value has the additional restrictions: * Must not contain - * No longer than 100 characters |
constant_keyword |
| data_stream.type | An overarching type for the data stream. Currently allowed values are "logs" and "metrics". We expect to also add "traces" and "synthetics" in the near future. | constant_keyword |
| ecs.version | ECS version this event conforms to. ecs.version is a required field and must exist in all events. When querying across multiple indices -- which may conform to slightly different ECS versions -- this field lets integrations adjust to the schema version of the events. |
keyword |
| error.message | Error message. | match_only_text |
| event.category | This is one of four ECS Categorization Fields, and indicates the second level in the ECS category hierarchy. event.category represents the "big buckets" of ECS categories. For example, filtering on event.category:process yields all events relating to process activity. This field is closely related to event.type, which is used as a subcategory. This field is an array. This will allow proper categorization of some events that fall in multiple categories. |
keyword |
| event.dataset | Name of the dataset. If an event source publishes more than one type of log or events (e.g. access log, error log), the dataset is used to specify which one the event comes from. It's recommended but not required to start the dataset name with the module name, followed by a dot, then the dataset name. | constant_keyword |
| event.end | event.end contains the date when the event ended or when the activity was last observed. |
date |
| event.kind | This is one of four ECS Categorization Fields, and indicates the highest level in the ECS category hierarchy. event.kind gives high-level information about what type of information the event contains, without being specific to the contents of the event. For example, values of this field distinguish alert events from metric events. The value of this field can be used to inform how these kinds of events should be handled. They may warrant different retention, different access control, it may also help understand whether the data is coming in at a regular interval or not. |
keyword |
| event.module | Name of the module this data is coming from. If your monitoring agent supports the concept of modules or plugins to process events of a given source (e.g. Apache logs), event.module should contain the name of this module. |
constant_keyword |
| event.original | Raw text message of entire event. Used to demonstrate log integrity or where the full log message (before splitting it up in multiple parts) may be required, e.g. for reindex. This field is not indexed and doc_values are disabled. It cannot be searched, but it can be retrieved from _source. If users wish to override this and index this field, please see Field data types in the Elasticsearch Reference. |
keyword |
| event.start | event.start contains the date when the event started or when the activity was first observed. |
date |
| event.type | This is one of four ECS Categorization Fields, and indicates the third level in the ECS category hierarchy. event.type represents a categorization "sub-bucket" that, when used along with the event.category field values, enables filtering events down to a level appropriate for single visualization. This field is an array. This will allow proper categorization of some events that fall in multiple event types. |
keyword |
| input.type | Type of filebeat input. | keyword |
| message | For log events the message field contains the log message, optimized for viewing in a log viewer. For structured logs without an original message field, other fields can be concatenated to form a human-readable summary of the event. If multiple messages exist, they can be combined into one message. | match_only_text |
| observer.name | Custom name of the observer. This is a name that can be given to an observer. This can be helpful for example if multiple firewalls of the same model are used in an organization. If no custom name is needed, the field can be left empty. | keyword |
| tags | List of keywords used to tag each event. | keyword |
Example
{
    "@timestamp": "2025-12-17T15:30:00.000Z",
    "agent": {
        "ephemeral_id": "e698466a-622e-48e2-95f4-7c84fac6c203",
        "id": "2a550b02-8932-4c1b-b033-6317986fbc02",
        "name": "elastic-agent-26964",
        "type": "filebeat",
        "version": "9.4.1"
    },
    "anduril_lattice": {
        "entity": {
            "aliases": {
                "name": "Tower 45d9bf21"
            },
            "entity_id": "tower-45d9bf21-0001-0001-0001-000000000001",
            "event_type": "EVENT_TYPE_UPDATE",
            "geo_shape": {
                "coordinates": [
                    [
                        [
                            -118.245,
                            34.053
                        ],
                        [
                            -118.242,
                            34.053
                        ],
                        [
                            -118.242,
                            34.051
                        ],
                        [
                            -118.245,
                            34.051
                        ],
                        [
                            -118.245,
                            34.053
                        ]
                    ]
                ],
                "type": "Polygon"
            },
            "health": {
                "active_alerts": {
                    "activated_time": "2025-12-17T15:00:00Z",
                    "alert_code": "ALERT_LOW_STORAGE",
                    "description": "Storage capacity below 15 percent",
                    "level": "ALERT_LEVEL_WARNING"
                },
                "connection_status": "CONNECTION_STATUS_ONLINE",
                "health_status": "HEALTH_STATUS_HEALTHY",
                "update_time": "2025-12-17T15:30:00.000Z"
            },
            "indicators": {
                "simulated": true
            },
            "is_live": true,
            "location": {
                "altitude_hae_meters": 85,
                "geo": {
                    "coordinates": [
                        -118.24368003755808,
                        34.05222997069359
                    ],
                    "type": "Point"
                }
            },
            "mil_view": {
                "disposition": "DISPOSITION_FRIENDLY",
                "environment": "ENVIRONMENT_LAND"
            },
            "ontology": {
                "platform_type": "FIXED_SENSOR",
                "template": "TEMPLATE_ASSET"
            },
            "power_state": {
                "sourceIdToState": {
                    "Battery": {
                        "powerLevel": {
                            "percentRemaining": "87.5",
                            "voltage": "31.84"
                        },
                        "powerStatus": "POWER_STATUS_DISCHARGING",
                        "powerType": "POWER_TYPE_BATTERY"
                    }
                }
            },
            "provenance": {
                "data_type": "anduril"
            },
            "sensors": {
                "fields_of_view": {
                    "geo": {
                        "coordinates": [
                            [
                                [
                                    -118.252,
                                    34.06
                                ],
                                [
                                    -118.237,
                                    34.06
                                ],
                                [
                                    -118.237,
                                    34.05
                                ],
                                [
                                    -118.252,
                                    34.05
                                ],
                                [
                                    -118.252,
                                    34.06
                                ]
                            ]
                        ],
                        "type": "Polygon"
                    }
                },
                "last_detection_timestamp": "2025-12-17T15:29:55Z",
                "operational_state": "OPERATIONAL_STATE_OPERATIONAL",
                "sensor_description": "Electro-optical camera",
                "sensor_id": "sensor-001",
                "sensor_type": "SENSOR_TYPE_EO"
            }
        }
    },
    "data_stream": {
        "dataset": "anduril_lattice.entity",
        "namespace": "15326",
        "type": "logs"
    },
    "ecs": {
        "version": "9.4.0"
    },
    "elastic_agent": {
        "id": "2a550b02-8932-4c1b-b033-6317986fbc02",
        "snapshot": false,
        "version": "9.4.1"
    },
    "event": {
        "agent_id_status": "verified",
        "created": "2025-12-17T15:30:00.000Z",
        "dataset": "anduril_lattice.entity",
        "ingested": "2026-08-07T20:35:18Z",
        "kind": "event",
        "module": "anduril_lattice",
        "original": "{\"entity\":{\"aliases\":{\"name\":\"Tower 45d9bf21\"},\"createdTime\":\"2025-12-17T10:00:00Z\",\"entityId\":\"tower-45d9bf21-0001-0001-0001-000000000001\",\"geoShape\":{\"polygon\":{\"rings\":[{\"positions\":[{\"heightM\":0,\"position\":{\"latitudeDegrees\":34.053,\"longitudeDegrees\":-118.245}},{\"heightM\":0,\"position\":{\"latitudeDegrees\":34.053,\"longitudeDegrees\":-118.242}},{\"heightM\":0,\"position\":{\"latitudeDegrees\":34.051,\"longitudeDegrees\":-118.242}},{\"heightM\":0,\"position\":{\"latitudeDegrees\":34.051,\"longitudeDegrees\":-118.245}}]}]}},\"health\":{\"activeAlerts\":[{\"activatedTime\":\"2025-12-17T15:00:00Z\",\"alertCode\":\"ALERT_LOW_STORAGE\",\"description\":\"Storage capacity below 15 percent\",\"level\":\"ALERT_LEVEL_WARNING\"}],\"connectionStatus\":\"CONNECTION_STATUS_ONLINE\",\"healthStatus\":\"HEALTH_STATUS_HEALTHY\",\"updateTime\":\"2025-12-17T15:30:00Z\"},\"indicators\":{\"simulated\":true},\"isLive\":true,\"location\":{\"position\":{\"altitudeHaeMeters\":85,\"latitudeDegrees\":34.05223,\"longitudeDegrees\":-118.24368}},\"milView\":{\"disposition\":\"DISPOSITION_FRIENDLY\",\"environment\":\"ENVIRONMENT_LAND\"},\"ontology\":{\"platformType\":\"FIXED_SENSOR\",\"template\":\"TEMPLATE_ASSET\"},\"powerState\":{\"sourceIdToState\":{\"Battery\":{\"powerLevel\":{\"percentRemaining\":87.5,\"voltage\":31.84},\"powerStatus\":\"POWER_STATUS_DISCHARGING\",\"powerType\":\"POWER_TYPE_BATTERY\"}}},\"provenance\":{\"dataType\":\"anduril\",\"integrationName\":\"anduril_tower\",\"sourceUpdateTime\":\"2025-12-17T15:30:00Z\"},\"sensors\":{\"sensors\":[{\"fieldsOfView\":[{\"projectedFrustum\":{\"bottomLeft\":{\"latitudeDegrees\":34.05,\"longitudeDegrees\":-118.252},\"bottomRight\":{\"latitudeDegrees\":34.05,\"longitudeDegrees\":-118.237},\"upperLeft\":{\"latitudeDegrees\":34.06,\"longitudeDegrees\":-118.252},\"upperRight\":{\"latitudeDegrees\":34.06,\"longitudeDegrees\":-118.237}}}],\"lastDetectionTimestamp\":\"2025-12-17T15:29:55Z\",\"operationalState\":\"OPERATIONAL_STATE_OPERATIONAL\",\"sensorDescription\":\"Electro-optical camera\",\"sensorId\":\"sensor-001\",\"sensorType\":\"SENSOR_TYPE_EO\"}]}},\"eventType\":\"EVENT_TYPE_UPDATE\",\"time\":\"2025-12-17T15:30:00Z\"}",
        "start": "2025-12-17T10:00:00.000Z",
        "type": [
            "change"
        ]
    },
    "input": {
        "type": "cel"
    },
    "observer": {
        "name": "anduril_tower"
    },
    "tags": [
        "preserve_original_event",
        "forwarded"
    ]
}
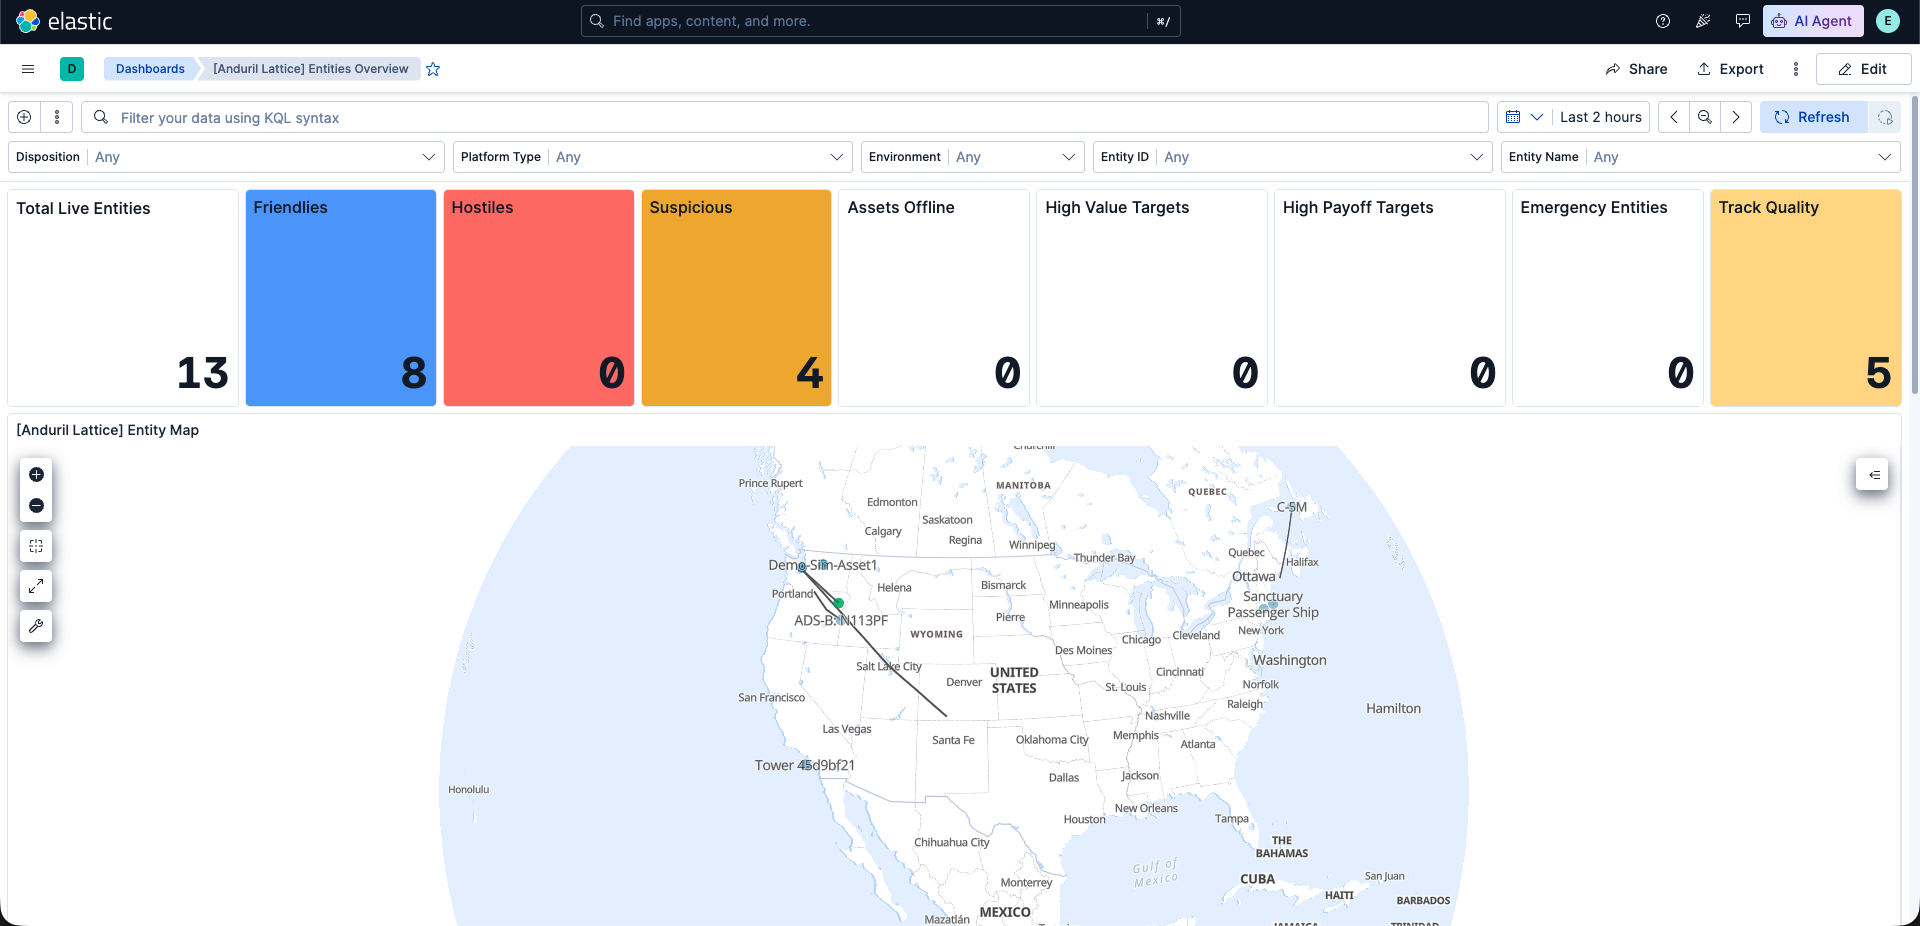
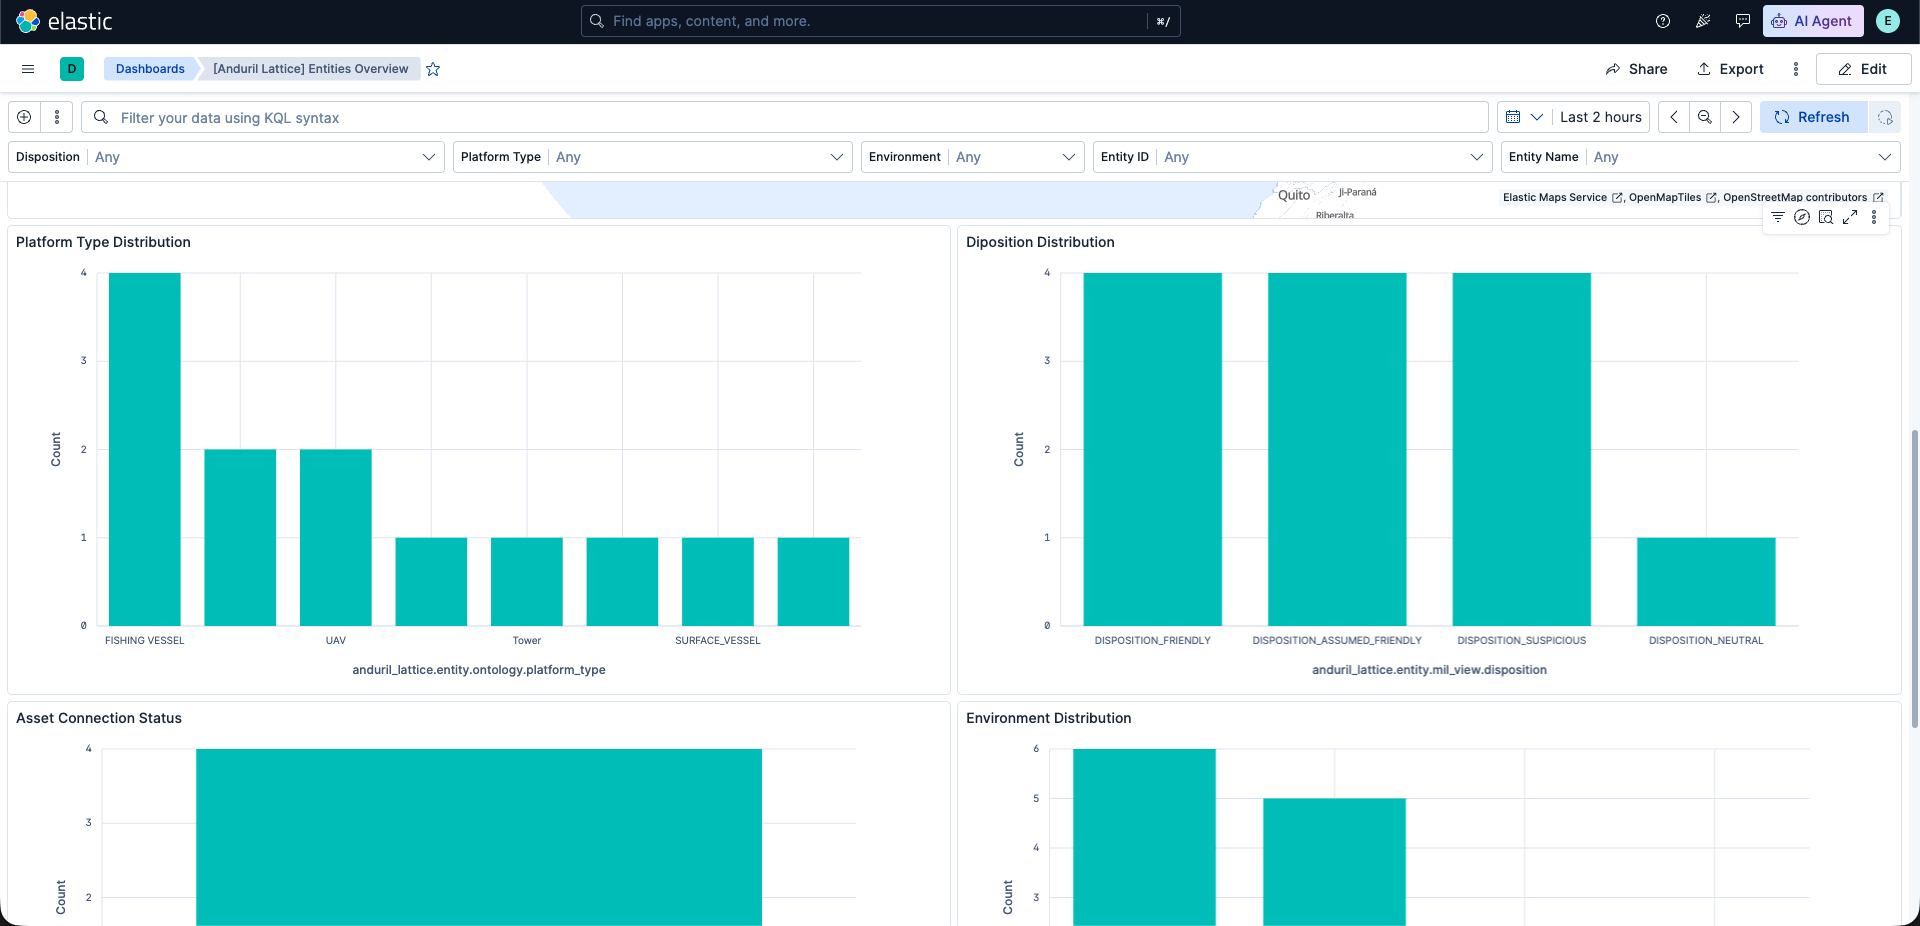
This integration includes one or more Kibana dashboards that visualizes the data collected by the integration. The screenshots below illustrate how the ingested data is displayed.
Changelog
| Version | Details | Minimum Kibana version |
|---|---|---|
| 0.2.0 | Enhancement (View pull request) Update README with latest spec. |
9.2.0 |
| 0.1.0 | Enhancement (View pull request) Initial release of the Anduril Lattice integration. |
9.2.0 |