Cato Networks Integration for Elastic
| Version | 0.1.3
|
| Managed integration release status |
|
| Subscription level What's this? |
Basic |
| Developed by What's this? |
Elastic |
| Ingestion method(s) | API |
| Minimum Kibana version(s) | 9.1.0 8.19.0 |
You can use this integration as an Elastic Managed integration on Elastic Cloud Hosted deployments running this version or later.
To use pre-release integrations, go to the Integrations page in Kibana, scroll down, and toggle on the Display beta integrations option.
Cato Networks is a cloud-native, global SD-WAN provider that delivers a secure, optimized, and agile global network for businesses of all sizes. Cato's cloud-based platform converges multiple network and security functions into a unified solution that includes SD-WAN, network security, cloud security, and secure access service edge (SASE) capabilities.
The Cato Networks integration for Elastic collects Events Feed and Audit Feed from the API and visualizes them in Kibana.
The Cato Networks integration is compatible with graphQL API version v1.
This integration periodically queries the Cato Networks GraphQL API to retrieve logs.
This integration collects log messages of the following type:
Events Feed: Collects Events Feed logs from the Cato Networks API (endpoint:/api/v1/graphql2).Audit Feed: Collects Audit Feed logs from the Cato Networks API (endpoint:/api/v1/graphql2).
Audit data stream: The audit dataset contains administrative and configuration activities from the Cato Management Application (CMA), which manages the broader Cato SASE Cloud Platform.
Integrating Cato Networks with Elastic SIEM provides centralized visibility into both administrative activities and security events through the Audit and Event data streams, enabling efficient monitoring, investigation, and compliance tracking within Kibana dashboards.
The Audit data stream delivers insights into configuration changes, administrative actions, and policy modifications. Dashboards highlight metrics such as Audit by Event Type over Time and Top Admins, helping administrators monitor operational changes, track privileged activity, and support governance requirements.
The Event data stream focuses on security monitoring and threat investigation. Dashboards provide views such as Top Hosts and Events over Time, enabling analysts to detect activity spikes, identify suspicious behavior, and monitor evolving threat patterns across the environment.
Interactive filtering controls allow users to drill down across dimensions such as event type, affected models, geographic location, traffic direction, threat type, and authentication type. This supports streamlined compliance auditing, faster investigations, and a unified operational view across administrative and security data.
To collect data through the Cato Networks API, you need to provide an API Key and Account ID. Authentication is handled using the API Key, which serves as the required credential.
- Log in to the Cato Management Application.
- In the navigation menu, click Resources → Admin API Keys.
- Click New. The Create API Key panel opens.
- Provide a descriptive name for the API key (for example, "Elastic Integration").
- Select the appropriate permissions for the API key.
- Click the button to copy the API Key that is generated by the CMA and save it to a secure location.
- Note your Cato Networks Account ID, which can be found in the Cato Management Application under Administration → Account → General Info.
For more information on generating API keys, refer to the Generating API Keys for the Cato API.
This integration supports both Elastic Agentless-based and Agent-based installations.
Agentless integrations allow you to collect data without having to manage Elastic Agent in your cloud. They make manual agent deployment unnecessary, so you can focus on your data instead of the agent that collects it. For more information, refer to Agentless integrations and the Agentless integrations FAQ.
Agentless deployments are only supported in Elastic Serverless and Elastic Cloud environments. This functionality is in beta and is subject to change. Beta features are not subject to the support SLA of official GA features.
Elastic Agent must be installed. For more details, check the Elastic Agent installation instructions. You can install only one Elastic Agent per host.
In the top search bar in Kibana, search for Integrations.
In the search bar, type Cato Networks.
Select the Cato Networks integration from the search results.
Select Add Cato Networks to add the integration.
Enable and configure only the collection methods which you will use.
To Collect Cato Networks logs via API, you'll need to:
- Configure URL (the base URL of the Cato Networks API, for example,
https://api.catonetworks.com). - Configure Account IDs.
- Configure API Key.
- Adjust the integration configuration parameters if required, including the Interval, Preserve original event etc. to enable data collection.
- Configure URL (the base URL of the Cato Networks API, for example,
Select Save and continue to save the integration.
- In the top search bar in Kibana, search for Dashboards.
- In the search bar, type Cato Networks.
- Select a dashboard for the dataset you are collecting, and verify the dashboard information is populated.
For help with Elastic ingest tools, check Common problems.
The Cato Networks EventsFeed API enforces rate limiting of 100 requests per minute (approximately 1.66 requests per second). For detailed information, refer to the official documentation.
The Cato Networks AuditFeed API enforces rate limiting of 5 requests per minute (approximately 0.083 requests per second). For detailed information, refer to the official documentation.
If you encounter rate limiting errors, consider decreasing the
Resource Rate Limitparameter or increasing theIntervalvalue.
The EventsFeed API operates with a time-based data retrieval mechanism. On the initial API call, no data will be returned as it establishes a baseline marker. Subsequent requests will retrieve events that occurred between the current request and the previous one. Due to this behavior, data ingestion begins only after the first interval has elapsed, so it is expected to have a delay equal to the configured interval before seeing the first events in Elasticsearch.
The Cato Networks EventsFeed API uses a marker-based pagination with a 3-day expiration period. If the Elastic Agent or Elasticsearch instance experiences downtime exceeding 3 days, the marker becomes invalid and any events generated during this outage will be permanently lost and cannot be recovered.
The Cato Networks API rate limit quota is shared across all integration instances that use the same API credentials, which can impact data collection when running multiple instances simultaneously.
The Cato Networks AuditFeed API contains certain fields with inconsistent data types across different events. These type conflicts can cause indexing failures in Elasticsearch, resulting in discrepancies between the document count stored in Elasticsearch and the total number of events returned by the API. Users can observe that not all events from the API response are successfully indexed due to these type mapping conflicts.
For more information on architectures that can be used for scaling this integration, check the Ingest Architectures documentation.
Exported fields
| Field | Description | Type |
|---|---|---|
| @timestamp | Date/time when the event originated. This is the date/time extracted from the event, typically representing when the event was generated by the source. If the event source has no original timestamp, this value is typically populated by the first time the event was received by the pipeline. Required field for all events. | date |
| cato_networks.audit.account_id | Unique identifier of the Cato Networks tenant account in which the audited change occurred. | keyword |
| cato_networks.audit.admin | Display name of the administrator who performed the audited change. | keyword |
| cato_networks.audit.admin_id | Unique identifier of the administrator who performed the audited change. | keyword |
| cato_networks.audit.change.after.action | Action recorded for the entity after the change (for example, allow, block). | keyword |
| cato_networks.audit.change.after.address | Network or physical address of the entity after the change. | keyword |
| cato_networks.audit.change.after.admin_creation_type | Method by which the administrator account was created after the change (for example, manual, SSO-provisioned). | keyword |
| cato_networks.audit.change.after.admin_roles.creation_date_milliseconds | Creation timestamp of the administrator role assignment in epoch milliseconds. | date |
| cato_networks.audit.change.after.admin_roles.id | Unique identifier of the administrator role assignment. | keyword |
| cato_networks.audit.change.after.admin_roles.name | Name of the administrator role assignment. | keyword |
| cato_networks.audit.change.after.admin_roles.new_save_method | Indicates whether the role assignment was persisted using the new save method. | boolean |
| cato_networks.audit.change.after.admin_roles.role.account_type | Type of account scope to which the role applies (for example, reseller, customer). | keyword |
| cato_networks.audit.change.after.admin_roles.role.creation_date_milliseconds | Creation timestamp of the role definition in epoch milliseconds. | date |
| cato_networks.audit.change.after.admin_roles.role.description | Human-readable description of the role. | keyword |
| cato_networks.audit.change.after.admin_roles.role.id | Unique identifier of the role definition. | keyword |
| cato_networks.audit.change.after.admin_roles.role.is_for_token | Indicates whether the role is intended for API token use. | boolean |
| cato_networks.audit.change.after.admin_roles.role.is_predefined | Indicates whether the role is a built-in (predefined) Cato role. | boolean |
| cato_networks.audit.change.after.admin_roles.role.is_used_on_external_access | Indicates whether the role is used for external access scenarios. | boolean |
| cato_networks.audit.change.after.admin_roles.role.name | Name of the role definition. | keyword |
| cato_networks.audit.change.after.admin_roles.role.new_save_method | Indicates whether the role definition was persisted using the new save method. | boolean |
| cato_networks.audit.change.after.admin_roles.role.type | Type classification of the role. | keyword |
| cato_networks.audit.change.after.admin_roles.role.visible | Indicates whether the role is visible in the management console. | boolean |
| cato_networks.audit.change.after.admin_roles.type | Type classification of the administrator role assignment. | keyword |
| cato_networks.audit.change.after.admin_roles_keyword | Flattened keyword representation of the administrator roles for filtering and aggregation. | keyword |
| cato_networks.audit.change.after.allowed_items.creation_date_milliseconds | Creation timestamp of the allowed item in epoch milliseconds. | date |
| cato_networks.audit.change.after.allowed_items.display_name | Display name of the allowed item. | keyword |
| cato_networks.audit.change.after.allowed_items.entity_type | Entity type of the allowed item (for example, site, user, group). | keyword |
| cato_networks.audit.change.after.allowed_items.id | Unique identifier of the allowed item. | keyword |
| cato_networks.audit.change.after.allowed_items.name | Name of the allowed item. | keyword |
| cato_networks.audit.change.after.allowed_items.new_save_method | Indicates whether the allowed item was persisted using the new save method. | boolean |
| cato_networks.audit.change.after.allowed_items.type | Type classification of the allowed item. | keyword |
| cato_networks.audit.change.after.allowed_items_keyword | Flattened keyword representation of the allowed items for filtering and aggregation. | keyword |
| cato_networks.audit.change.after.allowed_updatable_items.creation_date_milliseconds | Creation timestamp of the allowed updatable item in epoch milliseconds. | date |
| cato_networks.audit.change.after.allowed_updatable_items.display_name | Display name of the allowed updatable item. | keyword |
| cato_networks.audit.change.after.allowed_updatable_items.entity_type | Entity type of the allowed updatable item. | keyword |
| cato_networks.audit.change.after.allowed_updatable_items.id | Unique identifier of the allowed updatable item. | keyword |
| cato_networks.audit.change.after.allowed_updatable_items.name | Name of the allowed updatable item. | keyword |
| cato_networks.audit.change.after.allowed_updatable_items.new_save_method | Indicates whether the allowed updatable item was persisted using the new save method. | boolean |
| cato_networks.audit.change.after.allowed_updatable_items.type | Type classification of the allowed updatable item. | keyword |
| cato_networks.audit.change.after.allowed_updatable_items_keyword | Flattened keyword representation of allowed updatable items for filtering and aggregation. | keyword |
| cato_networks.audit.change.after.backhauling_enabled | Indicates whether internet traffic backhauling is enabled for the site after the change. | boolean |
| cato_networks.audit.change.after.bandwidth_usage_type | Bandwidth usage type configured for the site (for example, dedicated, regional, pooled). | keyword |
| cato_networks.audit.change.after.city_raw | Raw city name configured for the site or entity. | keyword |
| cato_networks.audit.change.after.country_raw | Raw country name configured for the site or entity. | keyword |
| cato_networks.audit.change.after.description | Free-form description of the entity after the change. | keyword |
| cato_networks.audit.change.after.dest_type.dest_type | Destination type identifier for the link (for example, internet, IPSec). | keyword |
| cato_networks.audit.change.after.dest_type.name | Display name of the destination type. | keyword |
| cato_networks.audit.change.after.dest_type.value | Underlying value of the destination type enumeration. | keyword |
| cato_networks.audit.change.after.dest_type_keyword | Flattened keyword representation of the destination type for filtering and aggregation. | keyword |
| cato_networks.audit.change.after.disable_acl_for_sip | Indicates whether ACL enforcement is turned off for SIP traffic. | boolean |
| cato_networks.audit.change.after.downstream_bandwidth | Configured downstream bandwidth for the link in Mbps. | double |
| cato_networks.audit.change.after.downstream_bandwidth_mbps_precision | High-precision downstream bandwidth value in Mbps. | double |
| cato_networks.audit.change.after.enabled | Indicates whether the entity is enabled after the change. | keyword |
| cato_networks.audit.change.after.exceeded_thresholds_duration_enabled | Indicates whether duration tracking for exceeded thresholds is enabled. | boolean |
| cato_networks.audit.change.after.expire_in_days_alert | Number of days before expiration at which an alert is generated. | double |
| cato_networks.audit.change.after.force_selected_locations | Indicates whether traffic is forced through the selected PoP locations. | boolean |
| cato_networks.audit.change.after.from.creation_date_milliseconds | Creation timestamp of the source entity in epoch milliseconds. | date |
| cato_networks.audit.change.after.from.display_name | Display name of the source entity. | keyword |
| cato_networks.audit.change.after.from.entity_type | Entity type of the source. | keyword |
| cato_networks.audit.change.after.from.id | Unique identifier of the source entity. | keyword |
| cato_networks.audit.change.after.from.name | Name of the source entity. | keyword |
| cato_networks.audit.change.after.from.new_save_method | Indicates whether the source entity was persisted using the new save method. | boolean |
| cato_networks.audit.change.after.from.type | Type classification of the source entity. | keyword |
| cato_networks.audit.change.after.from_date | Start date of the validity range for the configuration. | date |
| cato_networks.audit.change.after.from_keyword | Flattened keyword representation of the source entity for filtering and aggregation. | keyword |
| cato_networks.audit.change.after.interface_id | Unique identifier of the network interface affected by the change. | keyword |
| cato_networks.audit.change.after.is_mac_auth_override | Indicates whether MAC-based authentication override is configured. | boolean |
| cato_networks.audit.change.after.is_nat_policy_enabled | Indicates whether the NAT policy is enabled for the entity. | boolean |
| cato_networks.audit.change.after.is_primary | Indicates whether this entity is configured as the primary instance. | boolean |
| cato_networks.audit.change.after.keep_alive_enabled | Indicates whether keep-alive is enabled for the connection. | boolean |
| cato_networks.audit.change.after.l7_lan_fw_enforcement | Indicates whether Layer 7 LAN firewall enforcement is enabled. | boolean |
| cato_networks.audit.change.after.lan_firewall_rules_enabled | Indicates whether LAN firewall rules are enabled for the site. | boolean |
| cato_networks.audit.change.after.latitude | Geographic latitude configured for the site. | double |
| cato_networks.audit.change.after.longitude | Geographic longitude configured for the site. | double |
| cato_networks.audit.change.after.max_bandwidth | Maximum bandwidth allowed for the site or link in Mbps. | double |
| cato_networks.audit.change.after.model.automatically_managed | Indicates whether the model configuration is automatically managed by Cato. | boolean |
| cato_networks.audit.change.after.model.links | Link types supported by the device model. | keyword |
| cato_networks.audit.change.after.model.name | Name of the device model. | keyword |
| cato_networks.audit.change.after.model.possible_platform | Hardware platforms compatible with the device model. | keyword |
| cato_networks.audit.change.after.model.value | Underlying value of the device model enumeration. | keyword |
| cato_networks.audit.change.after.multi_tunnel_mode | Multi-tunnel mode configured for the site connection. | keyword |
| cato_networks.audit.change.after.name | Name of the entity after the change. | keyword |
| cato_networks.audit.change.after.natural_order | Numeric ordering value used to sort the entity within its collection. | double |
| cato_networks.audit.change.after.off_cloud_transport_enabled | Indicates whether off-cloud transport is enabled for the link. | boolean |
| cato_networks.audit.change.after.override_primary_settings | Indicates whether the secondary configuration overrides primary socket settings. | boolean |
| cato_networks.audit.change.after.permissions.actions | Allowed actions granted by the permission (for example, read, write). | keyword |
| cato_networks.audit.change.after.permissions.creation_date_milliseconds | Creation timestamp of the permission in epoch milliseconds. | date |
| cato_networks.audit.change.after.permissions.id | Unique identifier of the permission. | keyword |
| cato_networks.audit.change.after.permissions.name | Name of the permission. | keyword |
| cato_networks.audit.change.after.permissions.new_save_method | Indicates whether the permission was persisted using the new save method. | boolean |
| cato_networks.audit.change.after.permissions.resource | Resource to which the permission applies. | keyword |
| cato_networks.audit.change.after.permissions.type | Type classification of the permission. | keyword |
| cato_networks.audit.change.after.permissions_keyword | Flattened keyword representation of permissions for filtering and aggregation. | keyword |
| cato_networks.audit.change.after.physical_port | Physical port number on the Cato Socket associated with the link. | double |
| cato_networks.audit.change.after.prefer_higher_natural_order | Indicates whether links with higher natural order are preferred. | boolean |
| cato_networks.audit.change.after.prefer_primary_wan | Indicates whether the primary WAN link is preferred over the secondary. | boolean |
| cato_networks.audit.change.after.primary_bw_downstream | Downstream bandwidth configured on the primary link in Mbps. | double |
| cato_networks.audit.change.after.primary_bw_downstream_mbps_precision | High-precision downstream bandwidth on the primary link in Mbps. | double |
| cato_networks.audit.change.after.primary_bw_upstream | Upstream bandwidth configured on the primary link in Mbps. | double |
| cato_networks.audit.change.after.primary_bw_upstream_mbps_precision | High-precision upstream bandwidth on the primary link in Mbps. | double |
| cato_networks.audit.change.after.publish | Indicates whether the configuration has been published to production. | boolean |
| cato_networks.audit.change.after.pw | Pre-shared key or password value associated with the configuration (typically masked). | keyword |
| cato_networks.audit.change.after.pwk | Numeric password-key version or rotation counter. | double |
| cato_networks.audit.change.after.region | Cato region in which the site or entity is provisioned. | keyword |
| cato_networks.audit.change.after.regional_bandwidth | Bandwidth allocated for the regional bandwidth pool in Mbps. | double |
| cato_networks.audit.change.after.role.account_type | Type of account scope to which the role applies. | keyword |
| cato_networks.audit.change.after.role.creation_date_milliseconds | Creation timestamp of the role in epoch milliseconds. | date |
| cato_networks.audit.change.after.role.description | Human-readable description of the role. | keyword |
| cato_networks.audit.change.after.role.id | Unique identifier of the role. | keyword |
| cato_networks.audit.change.after.role.is_for_token | Indicates whether the role is intended for API token use. | boolean |
| cato_networks.audit.change.after.role.is_predefined | Indicates whether the role is a built-in (predefined) Cato role. | boolean |
| cato_networks.audit.change.after.role.is_used_on_external_access | Indicates whether the role is used for external access scenarios. | boolean |
| cato_networks.audit.change.after.role.name | Name of the role. | keyword |
| cato_networks.audit.change.after.role.new_save_method | Indicates whether the role was persisted using the new save method. | boolean |
| cato_networks.audit.change.after.role.type | Type classification of the role. | keyword |
| cato_networks.audit.change.after.role.visible | Indicates whether the role is visible in the management console. | boolean |
| cato_networks.audit.change.after.role_keyword | Flattened keyword representation of the role for filtering and aggregation. | keyword |
| cato_networks.audit.change.after.rule_type | Type of policy rule to which the change applies. | keyword |
| cato_networks.audit.change.after.rules_migration_state | Migration state of the policy rule set. | keyword |
| cato_networks.audit.change.after.s2s_enabled | Indicates whether site-to-site connectivity is enabled on the link. | boolean |
| cato_networks.audit.change.after.sec_pwk | Numeric secondary password-key version or rotation counter. | double |
| cato_networks.audit.change.after.secondary_bw_downstream | Downstream bandwidth configured on the secondary link in Mbps. | double |
| cato_networks.audit.change.after.secondary_bw_downstream_mbps_precision | High-precision downstream bandwidth on the secondary link in Mbps. | double |
| cato_networks.audit.change.after.secondary_bw_upstream | Upstream bandwidth configured on the secondary link in Mbps. | double |
| cato_networks.audit.change.after.secondary_bw_upstream_mbps_precision | High-precision upstream bandwidth on the secondary link in Mbps. | double |
| cato_networks.audit.change.after.shipping_status | Shipping status of the Cato Socket associated with the site. | keyword |
| cato_networks.audit.change.after.single_wan_qos_policy | Indicates whether a single WAN QoS policy is applied across links. | boolean |
| cato_networks.audit.change.after.site_bandwidth_type | Bandwidth allocation type configured for the site. | keyword |
| cato_networks.audit.change.after.site_conn_type.connection_type_families | Families of connection types supported by the site connection. | keyword |
| cato_networks.audit.change.after.site_conn_type.name | Name of the site connection type. | keyword |
| cato_networks.audit.change.after.site_conn_type.proto_type | Protocol type used by the site connection. | keyword |
| cato_networks.audit.change.after.site_conn_type.require_password | Indicates whether the site connection requires a password. | boolean |
| cato_networks.audit.change.after.site_conn_type.require_primary_bandwidth | Indicates whether a primary bandwidth value is required. | boolean |
| cato_networks.audit.change.after.site_conn_type.socket_model_type_configuration.automatically_managed | Indicates whether the socket model configuration is automatically managed by Cato. | boolean |
| cato_networks.audit.change.after.site_conn_type.socket_model_type_configuration.links | Link types supported by the socket model. | keyword |
| cato_networks.audit.change.after.site_conn_type.socket_model_type_configuration.name | Name of the socket model. | keyword |
| cato_networks.audit.change.after.site_conn_type.socket_model_type_configuration.possible_platform | Hardware platforms compatible with the socket model. | keyword |
| cato_networks.audit.change.after.site_conn_type.socket_model_type_configuration.value | Underlying value of the socket model enumeration. | keyword |
| cato_networks.audit.change.after.site_conn_type.support_bgp | Indicates whether the connection type supports BGP. | boolean |
| cato_networks.audit.change.after.site_conn_type.support_keep_alive | Indicates whether the connection type supports keep-alive. | boolean |
| cato_networks.audit.change.after.site_conn_type.support_multi_tunnel_mode | Indicates whether the connection type supports multi-tunnel mode. | boolean |
| cato_networks.audit.change.after.site_conn_type.support_site_recovery | Indicates whether the connection type supports site recovery. | boolean |
| cato_networks.audit.change.after.site_conn_type.value | Underlying value of the connection type enumeration. | keyword |
| cato_networks.audit.change.after.site_id | Unique identifier of the site affected by the change. | keyword |
| cato_networks.audit.change.after.site_life_cycle_status | Lifecycle status of the site (for example, active, deleted, pending). | keyword |
| cato_networks.audit.change.after.site_profile.creation_date_milliseconds | Creation timestamp of the site profile in epoch milliseconds. | date |
| cato_networks.audit.change.after.site_profile.name | Name of the site profile. | keyword |
| cato_networks.audit.change.after.site_profile.new_save_method | Indicates whether the site profile was persisted using the new save method. | boolean |
| cato_networks.audit.change.after.site_profile.profile | Profile identifier applied to the site. | keyword |
| cato_networks.audit.change.after.site_profile.type | Type classification of the site profile. | keyword |
| cato_networks.audit.change.after.site_type | Type of site (for example, branch, datacenter, cloud). | keyword |
| cato_networks.audit.change.after.site_usage.bandwidth_usage_type | Bandwidth usage type configured for the site usage record. | keyword |
| cato_networks.audit.change.after.site_usage.creation_date_milliseconds | Creation timestamp of the site usage record in epoch milliseconds. | date |
| cato_networks.audit.change.after.site_usage.id | Unique identifier of the site usage record. | keyword |
| cato_networks.audit.change.after.site_usage.max_bandwidth | Maximum bandwidth allowed by the site usage record in Mbps. | double |
| cato_networks.audit.change.after.site_usage.name | Name of the site usage record. | keyword |
| cato_networks.audit.change.after.site_usage.new_save_method | Indicates whether the site usage record was persisted using the new save method. | boolean |
| cato_networks.audit.change.after.site_usage.region | Region associated with the site usage record. | keyword |
| cato_networks.audit.change.after.site_usage.regional_bandwidth | Regional bandwidth allocation associated with the site usage record in Mbps. | double |
| cato_networks.audit.change.after.site_usage.site_bandwidth_type | Site bandwidth type associated with the usage record. | keyword |
| cato_networks.audit.change.after.site_usage.site_id | Unique identifier of the site associated with the usage record. | keyword |
| cato_networks.audit.change.after.site_usage.site_life_cycle_status | Lifecycle status of the site associated with the usage record. | keyword |
| cato_networks.audit.change.after.site_usage.start_date | Start date from which the site usage record is effective. | date |
| cato_networks.audit.change.after.site_usage.type | Type classification of the site usage record. | keyword |
| cato_networks.audit.change.after.site_usage_keyword | Flattened keyword representation of the site usage record for filtering and aggregation. | keyword |
| cato_networks.audit.change.after.socket_connection_configuration.creation_date | Creation timestamp of the socket connection configuration. | date |
| cato_networks.audit.change.after.socket_connection_configuration.creation_date_milliseconds | Creation timestamp of the socket connection configuration in epoch milliseconds. | date |
| cato_networks.audit.change.after.socket_connection_configuration.id | Unique identifier of the socket connection configuration. | keyword |
| cato_networks.audit.change.after.socket_connection_configuration.is_mac_auth_override | Indicates whether MAC-based authentication override is configured for the socket. | boolean |
| cato_networks.audit.change.after.socket_connection_configuration.last_modified | Last modification timestamp of the socket connection configuration. | date |
| cato_networks.audit.change.after.socket_connection_configuration.mac_address_authentication_enabled_on_account | Indicates whether MAC address authentication is enabled at the account level. | boolean |
| cato_networks.audit.change.after.socket_connection_configuration.name | Name of the socket connection configuration. | keyword |
| cato_networks.audit.change.after.socket_connection_configuration.new_save_method | Indicates whether the socket connection configuration was persisted using the new save method. | boolean |
| cato_networks.audit.change.after.socket_connection_configuration.off_cloud_transport_enabled | Indicates whether off-cloud transport is enabled for the socket. | boolean |
| cato_networks.audit.change.after.socket_connection_configuration.prefer_higher_natural_order | Indicates whether links with higher natural order are preferred for the socket. | boolean |
| cato_networks.audit.change.after.socket_connection_configuration.proto_id | Protocol identifier configured on the socket. | keyword |
| cato_networks.audit.change.after.socket_connection_configuration.rules_migration_state | Migration state of the rule set associated with the socket configuration. | keyword |
| cato_networks.audit.change.after.socket_connection_configuration.socket_interfaces.creation_date | Creation timestamp of the socket interface. | date |
| cato_networks.audit.change.after.socket_connection_configuration.socket_interfaces.creation_date_milliseconds | Creation timestamp of the socket interface in epoch milliseconds. | date |
| cato_networks.audit.change.after.socket_connection_configuration.socket_interfaces.dest_type.dest_type | Destination type identifier for the socket interface. | keyword |
| cato_networks.audit.change.after.socket_connection_configuration.socket_interfaces.dest_type.name | Display name of the destination type. | keyword |
| cato_networks.audit.change.after.socket_connection_configuration.socket_interfaces.dest_type.value | Underlying value of the destination type enumeration. | keyword |
| cato_networks.audit.change.after.socket_connection_configuration.socket_interfaces.downstream_bandwidth | Configured downstream bandwidth on the socket interface in Mbps. | double |
| cato_networks.audit.change.after.socket_connection_configuration.socket_interfaces.downstream_bandwidth_mbps_precision | High-precision downstream bandwidth on the socket interface in Mbps. | double |
| cato_networks.audit.change.after.socket_connection_configuration.socket_interfaces.id | Unique identifier of the socket interface. | keyword |
| cato_networks.audit.change.after.socket_connection_configuration.socket_interfaces.interface_id | Interface identifier on the socket. | keyword |
| cato_networks.audit.change.after.socket_connection_configuration.socket_interfaces.last_modified | Last modification timestamp of the socket interface. | date |
| cato_networks.audit.change.after.socket_connection_configuration.socket_interfaces.metadata.disabled_dest_type | Indicates whether the destination type is turned off for the interface. | boolean |
| cato_networks.audit.change.after.socket_connection_configuration.socket_interfaces.metadata.link_order | Numeric ordering value of the link within its socket. | double |
| cato_networks.audit.change.after.socket_connection_configuration.socket_interfaces.metadata.physical_name.caption | Display caption for the physical port name. | keyword |
| cato_networks.audit.change.after.socket_connection_configuration.socket_interfaces.metadata.physical_name.name | Physical port name on the socket. | keyword |
| cato_networks.audit.change.after.socket_connection_configuration.socket_interfaces.metadata.physical_position | Physical position of the port on the socket chassis. | keyword |
| cato_networks.audit.change.after.socket_connection_configuration.socket_interfaces.metadata.speed | Maximum negotiated speed of the physical port. | keyword |
| cato_networks.audit.change.after.socket_connection_configuration.socket_interfaces.metadata.supported_destinations.dest_type | Supported destination type identifier. | keyword |
| cato_networks.audit.change.after.socket_connection_configuration.socket_interfaces.metadata.supported_destinations.name | Display name of the supported destination type. | keyword |
| cato_networks.audit.change.after.socket_connection_configuration.socket_interfaces.metadata.supported_destinations.value | Underlying value of the supported destination type enumeration. | keyword |
| cato_networks.audit.change.after.socket_connection_configuration.socket_interfaces.metadata.type | Type classification of the interface metadata. | keyword |
| cato_networks.audit.change.after.socket_connection_configuration.socket_interfaces.name | Name of the socket interface. | keyword |
| cato_networks.audit.change.after.socket_connection_configuration.socket_interfaces.natural_order | Numeric ordering value used to sort the socket interface. | double |
| cato_networks.audit.change.after.socket_connection_configuration.socket_interfaces.new_save_method | Indicates whether the socket interface was persisted using the new save method. | boolean |
| cato_networks.audit.change.after.socket_connection_configuration.socket_interfaces.off_cloud_transport_enabled | Indicates whether off-cloud transport is enabled on the socket interface. | boolean |
| cato_networks.audit.change.after.socket_connection_configuration.socket_interfaces.physical_port | Physical port number associated with the socket interface. | double |
| cato_networks.audit.change.after.socket_connection_configuration.socket_interfaces.proto_id | Protocol identifier configured on the socket interface. | keyword |
| cato_networks.audit.change.after.socket_connection_configuration.socket_interfaces.role | Role assigned to the socket interface (for example, primary, secondary, LAN). | keyword |
| cato_networks.audit.change.after.socket_connection_configuration.socket_interfaces.s2s_enabled | Indicates whether site-to-site connectivity is enabled on the socket interface. | boolean |
| cato_networks.audit.change.after.socket_connection_configuration.socket_interfaces.type | Type classification of the socket interface. | keyword |
| cato_networks.audit.change.after.socket_connection_configuration.socket_interfaces.upstream_bandwidth | Configured upstream bandwidth on the socket interface in Mbps. | double |
| cato_networks.audit.change.after.socket_connection_configuration.socket_interfaces.upstream_bandwidth_mbps_precision | High-precision upstream bandwidth on the socket interface in Mbps. | double |
| cato_networks.audit.change.after.socket_connection_configuration.sockets_settings.primary.id | Unique identifier of the primary socket settings entry. | keyword |
| cato_networks.audit.change.after.socket_connection_configuration.sockets_settings.primary.is_primary | Indicates whether this socket is configured as the primary socket. | boolean |
| cato_networks.audit.change.after.socket_connection_configuration.sockets_settings.primary.links.creation_date | Creation timestamp of the primary socket link. | date |
| cato_networks.audit.change.after.socket_connection_configuration.sockets_settings.primary.links.creation_date_milliseconds | Creation timestamp of the primary socket link in epoch milliseconds. | date |
| cato_networks.audit.change.after.socket_connection_configuration.sockets_settings.primary.links.dest_type.dest_type | Destination type identifier for the primary socket link. | keyword |
| cato_networks.audit.change.after.socket_connection_configuration.sockets_settings.primary.links.dest_type.name | Display name of the destination type. | keyword |
| cato_networks.audit.change.after.socket_connection_configuration.sockets_settings.primary.links.dest_type.value | Underlying value of the destination type enumeration. | keyword |
| cato_networks.audit.change.after.socket_connection_configuration.sockets_settings.primary.links.downstream_bandwidth | Downstream bandwidth on the primary socket link in Mbps. | double |
| cato_networks.audit.change.after.socket_connection_configuration.sockets_settings.primary.links.downstream_bandwidth_mbps_precision | High-precision downstream bandwidth on the primary socket link in Mbps. | double |
| cato_networks.audit.change.after.socket_connection_configuration.sockets_settings.primary.links.id | Unique identifier of the primary socket link. | keyword |
| cato_networks.audit.change.after.socket_connection_configuration.sockets_settings.primary.links.interface_id | Interface identifier on the primary socket. | keyword |
| cato_networks.audit.change.after.socket_connection_configuration.sockets_settings.primary.links.last_modified | Last modification timestamp of the primary socket link. | date |
| cato_networks.audit.change.after.socket_connection_configuration.sockets_settings.primary.links.metadata.disabled_dest_type | Indicates whether the destination type is turned off on the primary socket link. | boolean |
| cato_networks.audit.change.after.socket_connection_configuration.sockets_settings.primary.links.metadata.link_order | Numeric ordering value of the primary socket link. | double |
| cato_networks.audit.change.after.socket_connection_configuration.sockets_settings.primary.links.metadata.physical_name.caption | Display caption for the physical port name. | keyword |
| cato_networks.audit.change.after.socket_connection_configuration.sockets_settings.primary.links.metadata.physical_name.name | Physical port name on the primary socket. | keyword |
| cato_networks.audit.change.after.socket_connection_configuration.sockets_settings.primary.links.metadata.physical_position | Physical position of the port on the primary socket chassis. | keyword |
| cato_networks.audit.change.after.socket_connection_configuration.sockets_settings.primary.links.metadata.speed | Maximum negotiated speed of the physical port. | keyword |
| cato_networks.audit.change.after.socket_connection_configuration.sockets_settings.primary.links.metadata.supported_destinations.dest_type | Supported destination type identifier. | keyword |
| cato_networks.audit.change.after.socket_connection_configuration.sockets_settings.primary.links.metadata.supported_destinations.name | Display name of the supported destination type. | keyword |
| cato_networks.audit.change.after.socket_connection_configuration.sockets_settings.primary.links.metadata.supported_destinations.value | Underlying value of the supported destination type enumeration. | keyword |
| cato_networks.audit.change.after.socket_connection_configuration.sockets_settings.primary.links.metadata.type | Type classification of the primary socket link metadata. | keyword |
| cato_networks.audit.change.after.socket_connection_configuration.sockets_settings.primary.links.name | Name of the primary socket link. | keyword |
| cato_networks.audit.change.after.socket_connection_configuration.sockets_settings.primary.links.natural_order | Numeric ordering value used to sort the primary socket link. | double |
| cato_networks.audit.change.after.socket_connection_configuration.sockets_settings.primary.links.new_save_method | Indicates whether the primary socket link was persisted using the new save method. | boolean |
| cato_networks.audit.change.after.socket_connection_configuration.sockets_settings.primary.links.off_cloud_transport_enabled | Indicates whether off-cloud transport is enabled on the primary socket link. | boolean |
| cato_networks.audit.change.after.socket_connection_configuration.sockets_settings.primary.links.physical_port | Physical port number on the primary socket link. | double |
| cato_networks.audit.change.after.socket_connection_configuration.sockets_settings.primary.links.proto_id | Protocol identifier configured on the primary socket link. | keyword |
| cato_networks.audit.change.after.socket_connection_configuration.sockets_settings.primary.links.role | Role assigned to the primary socket link. | keyword |
| cato_networks.audit.change.after.socket_connection_configuration.sockets_settings.primary.links.s2s_enabled | Indicates whether site-to-site connectivity is enabled on the primary socket link. | boolean |
| cato_networks.audit.change.after.socket_connection_configuration.sockets_settings.primary.links.type | Type classification of the primary socket link. | keyword |
| cato_networks.audit.change.after.socket_connection_configuration.sockets_settings.primary.links.upstream_bandwidth | Upstream bandwidth on the primary socket link in Mbps. | double |
| cato_networks.audit.change.after.socket_connection_configuration.sockets_settings.primary.links.upstream_bandwidth_mbps_precision | High-precision upstream bandwidth on the primary socket link in Mbps. | double |
| cato_networks.audit.change.after.socket_connection_configuration.sockets_settings.primary.override_primary_settings | Indicates whether the primary socket settings are overridden. | boolean |
| cato_networks.audit.change.after.socket_connection_configuration.sockets_settings.primary.sockets_settings | Serialized representation of the sockets settings. | keyword |
| cato_networks.audit.change.after.socket_connection_configuration.sockets_settings.primary.supported_add_ons.id | Unique identifier of the supported add-on. | keyword |
| cato_networks.audit.change.after.socket_connection_configuration.sockets_settings.primary.supported_add_ons.name | Name of the supported add-on. | keyword |
| cato_networks.audit.change.after.socket_connection_configuration.sockets_settings.primary.supported_add_ons.number_of_ports | Number of ports provided by the add-on. | double |
| cato_networks.audit.change.after.socket_connection_configuration.sockets_settings.primary.supported_add_ons.proto_type | Protocol type supported by the add-on. | keyword |
| cato_networks.audit.change.after.socket_connection_configuration.sockets_settings.primary.supported_add_ons.value | Underlying value of the add-on enumeration. | keyword |
| cato_networks.audit.change.after.socket_connection_configuration.sockets_settings.primary.supported_migrations.automatically_managed | Indicates whether the supported migration is automatically managed by Cato. | boolean |
| cato_networks.audit.change.after.socket_connection_configuration.sockets_settings.primary.supported_migrations.links | Link types supported by the migration. | keyword |
| cato_networks.audit.change.after.socket_connection_configuration.sockets_settings.primary.supported_migrations.name | Name of the supported migration target. | keyword |
| cato_networks.audit.change.after.socket_connection_configuration.sockets_settings.primary.supported_migrations.possible_add_ons.id | Unique identifier of the possible add-on for the migration. | keyword |
| cato_networks.audit.change.after.socket_connection_configuration.sockets_settings.primary.supported_migrations.possible_add_ons.name | Name of the possible add-on. | keyword |
| cato_networks.audit.change.after.socket_connection_configuration.sockets_settings.primary.supported_migrations.possible_add_ons.number_of_ports | Number of ports provided by the possible add-on. | double |
| cato_networks.audit.change.after.socket_connection_configuration.sockets_settings.primary.supported_migrations.possible_add_ons.proto_type | Protocol type supported by the possible add-on. | keyword |
| cato_networks.audit.change.after.socket_connection_configuration.sockets_settings.primary.supported_migrations.possible_add_ons.value | Underlying value of the possible add-on enumeration. | keyword |
| cato_networks.audit.change.after.socket_connection_configuration.sockets_settings.primary.supported_migrations.possible_platform | Hardware platforms compatible with the migration. | keyword |
| cato_networks.audit.change.after.socket_connection_configuration.sockets_settings.primary.supported_migrations.value | Underlying value of the migration enumeration. | keyword |
| cato_networks.audit.change.after.socket_connection_configuration.sockets_settings.primary.type.automatically_managed | Indicates whether the socket type is automatically managed by Cato. | boolean |
| cato_networks.audit.change.after.socket_connection_configuration.sockets_settings.primary.type.links | Link types supported by the socket type. | keyword |
| cato_networks.audit.change.after.socket_connection_configuration.sockets_settings.primary.type.name | Name of the socket type. | keyword |
| cato_networks.audit.change.after.socket_connection_configuration.sockets_settings.primary.type.possible_platform | Hardware platforms compatible with the socket type. | keyword |
| cato_networks.audit.change.after.socket_connection_configuration.sockets_settings.primary.type.value | Underlying value of the socket type enumeration. | keyword |
| cato_networks.audit.change.after.socket_connection_configuration.sockets_settings.primary.upgrades_paused | Indicates whether automatic upgrades are paused on the primary socket. | boolean |
| cato_networks.audit.change.after.socket_connection_configuration.type | Type classification of the socket connection configuration. | keyword |
| cato_networks.audit.change.after.socket_connection_configuration_keyword | Flattened keyword representation of the socket connection configuration for filtering and aggregation. | keyword |
| cato_networks.audit.change.after.socket_id | Unique identifier of the Cato Socket associated with the change. | keyword |
| cato_networks.audit.change.after.socket_interface.creation_date | Creation timestamp of the socket interface. | date |
| cato_networks.audit.change.after.socket_interface.creation_date_milliseconds | Creation timestamp of the socket interface in epoch milliseconds. | date |
| cato_networks.audit.change.after.socket_interface.dest_type.dest_type | Destination type identifier for the socket interface. | keyword |
| cato_networks.audit.change.after.socket_interface.dest_type.name | Display name of the destination type. | keyword |
| cato_networks.audit.change.after.socket_interface.dest_type.value | Underlying value of the destination type enumeration. | keyword |
| cato_networks.audit.change.after.socket_interface.downstream_bandwidth | Configured downstream bandwidth on the socket interface in Mbps. | double |
| cato_networks.audit.change.after.socket_interface.downstream_bandwidth_mbps_precision | High-precision downstream bandwidth on the socket interface in Mbps. | double |
| cato_networks.audit.change.after.socket_interface.id | Unique identifier of the socket interface. | keyword |
| cato_networks.audit.change.after.socket_interface.interface_id | Interface identifier on the socket. | keyword |
| cato_networks.audit.change.after.socket_interface.last_modified | Last modification timestamp of the socket interface. | date |
| cato_networks.audit.change.after.socket_interface.metadata.disabled_dest_type | Indicates whether the destination type is turned off for the interface. | boolean |
| cato_networks.audit.change.after.socket_interface.metadata.link_order | Numeric ordering value of the link within its socket. | double |
| cato_networks.audit.change.after.socket_interface.metadata.physical_name.caption | Display caption for the physical port name. | keyword |
| cato_networks.audit.change.after.socket_interface.metadata.physical_name.name | Physical port name on the socket. | keyword |
| cato_networks.audit.change.after.socket_interface.metadata.physical_position | Physical position of the port on the socket chassis. | keyword |
| cato_networks.audit.change.after.socket_interface.metadata.speed | Maximum negotiated speed of the physical port. | keyword |
| cato_networks.audit.change.after.socket_interface.metadata.supported_destinations.dest_type | Supported destination type identifier. | keyword |
| cato_networks.audit.change.after.socket_interface.metadata.supported_destinations.name | Display name of the supported destination type. | keyword |
| cato_networks.audit.change.after.socket_interface.metadata.supported_destinations.value | Underlying value of the supported destination type enumeration. | keyword |
| cato_networks.audit.change.after.socket_interface.metadata.type | Type classification of the interface metadata. | keyword |
| cato_networks.audit.change.after.socket_interface.name | Name of the socket interface. | keyword |
| cato_networks.audit.change.after.socket_interface.natural_order | Numeric ordering value used to sort the socket interface. | double |
| cato_networks.audit.change.after.socket_interface.new_save_method | Indicates whether the socket interface was persisted using the new save method. | boolean |
| cato_networks.audit.change.after.socket_interface.off_cloud_transport_enabled | Indicates whether off-cloud transport is enabled on the socket interface. | boolean |
| cato_networks.audit.change.after.socket_interface.physical_port | Physical port number associated with the socket interface. | double |
| cato_networks.audit.change.after.socket_interface.proto_id | Protocol identifier configured on the socket interface. | keyword |
| cato_networks.audit.change.after.socket_interface.s2s_enabled | Indicates whether site-to-site connectivity is enabled on the socket interface. | boolean |
| cato_networks.audit.change.after.socket_interface.type | Type classification of the socket interface. | keyword |
| cato_networks.audit.change.after.socket_interface.upstream_bandwidth | Configured upstream bandwidth on the socket interface in Mbps. | double |
| cato_networks.audit.change.after.socket_interface.upstream_bandwidth_mbps_precision | High-precision upstream bandwidth on the socket interface in Mbps. | double |
| cato_networks.audit.change.after.socket_interfaces.dest_type | Destination type identifier for the socket interface entry. | keyword |
| cato_networks.audit.change.after.socket_interfaces.name | Display name of the socket interface entry. | keyword |
| cato_networks.audit.change.after.socket_interfaces.value | Underlying value of the socket interface entry enumeration. | keyword |
| cato_networks.audit.change.after.socket_interfaces_double | Numeric representation of socket interface count or capacity. | double |
| cato_networks.audit.change.after.sockets_settings.primary.id | Unique identifier of the primary socket settings entry. | keyword |
| cato_networks.audit.change.after.sockets_settings.primary.is_primary | Indicates whether this socket is configured as the primary socket. | boolean |
| cato_networks.audit.change.after.sockets_settings.primary.links.creation_date | Creation timestamp of the primary socket link. | date |
| cato_networks.audit.change.after.sockets_settings.primary.links.creation_date_milliseconds | Creation timestamp of the primary socket link in epoch milliseconds. | date |
| cato_networks.audit.change.after.sockets_settings.primary.links.dest_type.dest_type | Destination type identifier for the primary socket link. | keyword |
| cato_networks.audit.change.after.sockets_settings.primary.links.dest_type.name | Display name of the destination type. | keyword |
| cato_networks.audit.change.after.sockets_settings.primary.links.dest_type.value | Underlying value of the destination type enumeration. | keyword |
| cato_networks.audit.change.after.sockets_settings.primary.links.downstream_bandwidth | Downstream bandwidth on the primary socket link in Mbps. | double |
| cato_networks.audit.change.after.sockets_settings.primary.links.downstream_bandwidth_mbps_precision | High-precision downstream bandwidth on the primary socket link in Mbps. | double |
| cato_networks.audit.change.after.sockets_settings.primary.links.id | Unique identifier of the primary socket link. | keyword |
| cato_networks.audit.change.after.sockets_settings.primary.links.interface_id | Interface identifier on the primary socket. | keyword |
| cato_networks.audit.change.after.sockets_settings.primary.links.last_modified | Last modification timestamp of the primary socket link. | date |
| cato_networks.audit.change.after.sockets_settings.primary.links.metadata.disabled_dest_type | Indicates whether the destination type is turned off on the primary socket link. | boolean |
| cato_networks.audit.change.after.sockets_settings.primary.links.metadata.link_order | Numeric ordering value of the primary socket link. | double |
| cato_networks.audit.change.after.sockets_settings.primary.links.metadata.physical_name.caption | Display caption for the physical port name. | keyword |
| cato_networks.audit.change.after.sockets_settings.primary.links.metadata.physical_name.name | Physical port name on the primary socket. | keyword |
| cato_networks.audit.change.after.sockets_settings.primary.links.metadata.physical_position | Physical position of the port on the primary socket chassis. | keyword |
| cato_networks.audit.change.after.sockets_settings.primary.links.metadata.speed | Maximum negotiated speed of the physical port. | keyword |
| cato_networks.audit.change.after.sockets_settings.primary.links.metadata.supported_destinations.dest_type | Supported destination type identifier. | keyword |
| cato_networks.audit.change.after.sockets_settings.primary.links.metadata.supported_destinations.name | Display name of the supported destination type. | keyword |
| cato_networks.audit.change.after.sockets_settings.primary.links.metadata.supported_destinations.value | Underlying value of the supported destination type enumeration. | keyword |
| cato_networks.audit.change.after.sockets_settings.primary.links.metadata.type | Type classification of the primary socket link metadata. | keyword |
| cato_networks.audit.change.after.sockets_settings.primary.links.name | Name of the primary socket link. | keyword |
| cato_networks.audit.change.after.sockets_settings.primary.links.natural_order | Numeric ordering value used to sort the primary socket link. | double |
| cato_networks.audit.change.after.sockets_settings.primary.links.new_save_method | Indicates whether the primary socket link was persisted using the new save method. | boolean |
| cato_networks.audit.change.after.sockets_settings.primary.links.off_cloud_transport_enabled | Indicates whether off-cloud transport is enabled on the primary socket link. | boolean |
| cato_networks.audit.change.after.sockets_settings.primary.links.physical_port | Physical port number on the primary socket link. | double |
| cato_networks.audit.change.after.sockets_settings.primary.links.proto_id | Protocol identifier configured on the primary socket link. | keyword |
| cato_networks.audit.change.after.sockets_settings.primary.links.role | Role assigned to the primary socket link. | keyword |
| cato_networks.audit.change.after.sockets_settings.primary.links.s2s_enabled | Indicates whether site-to-site connectivity is enabled on the primary socket link. | boolean |
| cato_networks.audit.change.after.sockets_settings.primary.links.type | Type classification of the primary socket link. | keyword |
| cato_networks.audit.change.after.sockets_settings.primary.links.upstream_bandwidth | Upstream bandwidth on the primary socket link in Mbps. | double |
| cato_networks.audit.change.after.sockets_settings.primary.links.upstream_bandwidth_mbps_precision | High-precision upstream bandwidth on the primary socket link in Mbps. | double |
| cato_networks.audit.change.after.sockets_settings.primary.override_primary_settings | Indicates whether the primary socket settings are overridden. | boolean |
| cato_networks.audit.change.after.sockets_settings.primary.sockets_settings | Serialized representation of the sockets settings. | keyword |
| cato_networks.audit.change.after.sockets_settings.primary.supported_add_ons.id | Unique identifier of the supported add-on. | keyword |
| cato_networks.audit.change.after.sockets_settings.primary.supported_add_ons.name | Name of the supported add-on. | keyword |
| cato_networks.audit.change.after.sockets_settings.primary.supported_add_ons.number_of_ports | Number of ports provided by the add-on. | double |
| cato_networks.audit.change.after.sockets_settings.primary.supported_add_ons.proto_type | Protocol type supported by the add-on. | keyword |
| cato_networks.audit.change.after.sockets_settings.primary.supported_add_ons.value | Underlying value of the add-on enumeration. | keyword |
| cato_networks.audit.change.after.sockets_settings.primary.supported_migrations.automatically_managed | Indicates whether the supported migration is automatically managed by Cato. | boolean |
| cato_networks.audit.change.after.sockets_settings.primary.supported_migrations.links | Link types supported by the migration. | keyword |
| cato_networks.audit.change.after.sockets_settings.primary.supported_migrations.name | Name of the supported migration target. | keyword |
| cato_networks.audit.change.after.sockets_settings.primary.supported_migrations.possible_add_ons.id | Unique identifier of the possible add-on for the migration. | keyword |
| cato_networks.audit.change.after.sockets_settings.primary.supported_migrations.possible_add_ons.name | Name of the possible add-on. | keyword |
| cato_networks.audit.change.after.sockets_settings.primary.supported_migrations.possible_add_ons.number_of_ports | Number of ports provided by the possible add-on. | double |
| cato_networks.audit.change.after.sockets_settings.primary.supported_migrations.possible_add_ons.proto_type | Protocol type supported by the possible add-on. | keyword |
| cato_networks.audit.change.after.sockets_settings.primary.supported_migrations.possible_add_ons.value | Underlying value of the possible add-on enumeration. | keyword |
| cato_networks.audit.change.after.sockets_settings.primary.supported_migrations.possible_platform | Hardware platforms compatible with the migration. | keyword |
| cato_networks.audit.change.after.sockets_settings.primary.supported_migrations.value | Underlying value of the migration enumeration. | keyword |
| cato_networks.audit.change.after.sockets_settings.primary.type.automatically_managed | Indicates whether the socket type is automatically managed by Cato. | boolean |
| cato_networks.audit.change.after.sockets_settings.primary.type.links | Link types supported by the socket type. | keyword |
| cato_networks.audit.change.after.sockets_settings.primary.type.name | Name of the socket type. | keyword |
| cato_networks.audit.change.after.sockets_settings.primary.type.possible_platform | Hardware platforms compatible with the socket type. | keyword |
| cato_networks.audit.change.after.sockets_settings.primary.type.value | Underlying value of the socket type enumeration. | keyword |
| cato_networks.audit.change.after.sockets_settings.primary.upgrades_paused | Indicates whether automatic upgrades are paused on the primary socket. | boolean |
| cato_networks.audit.change.after.start_date | Effective start date of the configuration after the change. | date |
| cato_networks.audit.change.after.state_raw | Raw state value of the entity (for example, region or province) after the change. | keyword |
| cato_networks.audit.change.after.suspicious_action | Suspicious action flagged for the change, if any. | keyword |
| cato_networks.audit.change.after.timezone | Time zone configured for the site or entity. | keyword |
| cato_networks.audit.change.after.trial_bandwidth | Trial bandwidth allocation for the entity in Mbps. | double |
| cato_networks.audit.change.after.upstream_bandwidth | Configured upstream bandwidth for the link in Mbps. | double |
| cato_networks.audit.change.after.upstream_bandwidth_mbps_precision | High-precision upstream bandwidth value in Mbps. | double |
| cato_networks.audit.change.before.pw | Pre-shared key or password value before the change (typically masked). | keyword |
| cato_networks.audit.change_type | Type of audit change recorded (for example, CREATED, MODIFIED, DELETED). | keyword |
| cato_networks.audit.creation_date | Timestamp at which the audit change was made in the Cato system. | date |
| cato_networks.audit.insertion_date | Timestamp at which the audit record was inserted into the audit store. | date |
| cato_networks.audit.model_name | Name of the configuration model affected by the audit change (for example, site, admin, policy). | keyword |
| cato_networks.audit.model_type | Type classification of the configuration model affected by the audit change. | keyword |
| cato_networks.audit.module | Cato management module in which the audit change occurred. | keyword |
| data_stream.dataset | The field can contain anything that makes sense to signify the source of the data. Examples include nginx.access, prometheus, endpoint etc. For data streams that otherwise fit, but that do not have dataset set we use the value "generic" for the dataset value. event.dataset should have the same value as data_stream.dataset. Beyond the Elasticsearch data stream naming criteria noted above, the dataset value has additional restrictions: * Must not contain - * No longer than 100 characters |
constant_keyword |
| data_stream.namespace | A user defined namespace. Namespaces are useful to allow grouping of data. Many users already organize their indices this way, and the data stream naming scheme now provides this best practice as a default. Many users will populate this field with default. If no value is used, it falls back to default. Beyond the Elasticsearch index naming criteria noted above, namespace value has the additional restrictions: * Must not contain - * No longer than 100 characters |
constant_keyword |
| data_stream.type | An overarching type for the data stream. Currently allowed values are "logs" and "metrics". We expect to also add "traces" and "synthetics" in the near future. | constant_keyword |
| event.dataset | Name of the dataset. If an event source publishes more than one type of log or events (e.g. access log, error log), the dataset is used to specify which one the event comes from. It's recommended but not required to start the dataset name with the module name, followed by a dot, then the dataset name. | constant_keyword |
| event.module | Name of the module this data is coming from. If your monitoring agent supports the concept of modules or plugins to process events of a given source (e.g. Apache logs), event.module should contain the name of this module. |
constant_keyword |
| input.type | Type of filebeat input. | keyword |
| log.offset | Log offset. | long |
| observer.product | The product name of the observer. | constant_keyword |
| observer.type | The type of the observer the data is coming from. There is no predefined list of observer types. Some examples are forwarder, firewall, ids, ips, proxy, poller, sensor, APM server. |
constant_keyword |
| observer.vendor | Vendor name of the observer. | constant_keyword |
Exported fields
| Field | Description | Type |
|---|---|---|
| @timestamp | Date/time when the event originated. This is the date/time extracted from the event, typically representing when the event was generated by the source. If the event source has no original timestamp, this value is typically populated by the first time the event was received by the pipeline. Required field for all events. | date |
| cato_networks.event.account_id | Unique identifier for the account. | keyword |
| cato_networks.event.account_name | Name of the account. | keyword |
| cato_networks.event.action | Action taken or performed. | keyword |
| cato_networks.event.ad_name | Active Directory name. | keyword |
| cato_networks.event.api_name | Name of the API. | keyword |
| cato_networks.event.api_type | Type of the API. | keyword |
| cato_networks.event.app_stack | Application stack information. | keyword |
| cato_networks.event.application_id | Unique identifier for the application. | keyword |
| cato_networks.event.application_name | Name of the application. | keyword |
| cato_networks.event.application_risk | Risk level associated with the application. | long |
| cato_networks.event.application_type | Type of the application. | keyword |
| cato_networks.event.authentication_type | Type of authentication used. | keyword |
| cato_networks.event.categories | Categories associated with the event. | keyword |
| cato_networks.event.cato_app | Cato application identifier. | keyword |
| cato_networks.event.client_class | Classification of the client. | keyword |
| cato_networks.event.client_ip | IP address of the client. | ip |
| cato_networks.event.client_version | Version of the client software. | keyword |
| cato_networks.event.configured_host_name | Configured hostname. | keyword |
| cato_networks.event.congestion_algorithm | Congestion control algorithm used. | keyword |
| cato_networks.event.connection_origin | Origin of the connection. | keyword |
| cato_networks.event.custom_category_id | Unique identifier for the custom category. | keyword |
| cato_networks.event.custom_category_name | Name of the custom category. | keyword |
| cato_networks.event.dest_country | Destination country. | keyword |
| cato_networks.event.dest_country_code | Destination country code. | keyword |
| cato_networks.event.dest_ip | Destination IP address. | ip |
| cato_networks.event.dest_port | Destination port number. | long |
| cato_networks.event.device_categories | Categories associated with the device. | keyword |
| cato_networks.event.device_id | Unique identifier for the device. | keyword |
| cato_networks.event.device_name | Name of the device. | keyword |
| cato_networks.event.device_os_type | Operating system type of the device. | keyword |
| cato_networks.event.device_posture_profile | Security posture profile of the device. | keyword |
| cato_networks.event.device_type | Type of the device. | keyword |
| cato_networks.event.dns_protection_category | DNS protection category. | keyword |
| cato_networks.event.dns_query | DNS query string. | keyword |
| cato_networks.event.dns_record_type | Type of DNS record. | keyword |
| cato_networks.event.domain_name | Domain name. | keyword |
| cato_networks.event.egress_pop_name | Name of the egress point of presence. | keyword |
| cato_networks.event.event_count | Count of events. | long |
| cato_networks.event.event_id | Unique identifier for the event. | keyword |
| cato_networks.event.event_message | Event message content. | match_only_text |
| cato_networks.event.event_sub_type | Sub-type of the event. | keyword |
| cato_networks.event.event_type | Type of the event. | keyword |
| cato_networks.event.flow_id | Unique identifier for the network flow. | keyword |
| cato_networks.event.full_path_url | Full path URL. | wildcard |
| cato_networks.event.host_ip | IP address of the host. | ip |
| cato_networks.event.host_mac | MAC address of the host. | keyword |
| cato_networks.event.http_request_method | HTTP request method. | keyword |
| cato_networks.event.http_response_code | HTTP response status code. | long |
| cato_networks.event.internal_id | Internal identifier. | keyword |
| cato_networks.event.internalid | Internal identifier. | keyword |
| cato_networks.event.ip_protocol | IP protocol used. | keyword |
| cato_networks.event.is_sanctioned_app | Indicates whether the application is sanctioned. | boolean |
| cato_networks.event.is_sinkhole | Indicates whether the destination is a sinkhole. | boolean |
| cato_networks.event.isp_name | Name of the Internet Service Provider. | keyword |
| cato_networks.event.key_name | Name of the key. | keyword |
| cato_networks.event.login_type | Type of login. | keyword |
| cato_networks.event.mitre_attack_subtechniques | MITRE ATT&CK sub-techniques. | keyword |
| cato_networks.event.mitre_attack_tactics | MITRE ATT&CK tactics. | keyword |
| cato_networks.event.mitre_attack_techniques | MITRE ATT&CK techniques. | keyword |
| cato_networks.event.network_rule | Network rule applied. | keyword |
| cato_networks.event.os_type | Operating system type. | keyword |
| cato_networks.event.os_version | Operating system version. | keyword |
| cato_networks.event.pop_name | Name of the point of presence. | keyword |
| cato_networks.event.prompt_action | Action prompted to the user. | keyword |
| cato_networks.event.public_ip | Public IP address. | ip |
| cato_networks.event.qos_priority | Quality of Service priority level. | long |
| cato_networks.event.request_size | Size of the request in bytes. | long |
| cato_networks.event.response_size | Size of the response in bytes. | long |
| cato_networks.event.risk_level | Risk level assessment. | keyword |
| cato_networks.event.rule_id | Unique identifier for the rule. | keyword |
| cato_networks.event.rule_name | Name of the rule. | keyword |
| cato_networks.event.server_ip | IP address of the server. | ip |
| cato_networks.event.signature_id | Unique identifier for the signature. | keyword |
| cato_networks.event.socket_version | Version of the socket. | keyword |
| cato_networks.event.src_country | Source country. | keyword |
| cato_networks.event.src_country_code | Source country code. | keyword |
| cato_networks.event.src_ip | Source IP address. | ip |
| cato_networks.event.src_is_site_or_vpn | Indicates whether the source is a site or VPN. | keyword |
| cato_networks.event.src_isp_ip | Source ISP IP address. | ip |
| cato_networks.event.src_port | Source port number. | long |
| cato_networks.event.src_site_id | Unique identifier for the source site. | keyword |
| cato_networks.event.src_site_name | Name of the source site. | keyword |
| cato_networks.event.static_host | Indicates whether the host is static. | boolean |
| cato_networks.event.subnet_name | Name of the subnet. | keyword |
| cato_networks.event.tcp_acceleration | Indicates whether TCP acceleration is enabled. | boolean |
| cato_networks.event.threat_name | Name of the threat. | keyword |
| cato_networks.event.threat_reference | Reference identifier for the threat. | keyword |
| cato_networks.event.threat_type | Type of threat. | keyword |
| cato_networks.event.time | Timestamp of the event. | date |
| cato_networks.event.time_str | Timestamp of the event as a string. | date |
| cato_networks.event.tls_inspection | Indicates whether TLS inspection is enabled. | boolean |
| cato_networks.event.traffic_direction | Direction of the traffic. | keyword |
| cato_networks.event.transaction_size | Size of the transaction in bytes. | long |
| cato_networks.event.url | URL accessed. | wildcard |
| cato_networks.event.user_agent | User agent string. | keyword |
| cato_networks.event.user_id | Unique identifier for the user. | keyword |
| cato_networks.event.user_name | Name of the user. | keyword |
| cato_networks.event.user_reference_id | Reference identifier for the user. | keyword |
| cato_networks.event.visible_device_id | Visible identifier for the device. | keyword |
| cato_networks.event.vpn_user_email | Email address of the VPN user. | keyword |
| data_stream.dataset | The field can contain anything that makes sense to signify the source of the data. Examples include nginx.access, prometheus, endpoint etc. For data streams that otherwise fit, but that do not have dataset set we use the value "generic" for the dataset value. event.dataset should have the same value as data_stream.dataset. Beyond the Elasticsearch data stream naming criteria noted above, the dataset value has additional restrictions: * Must not contain - * No longer than 100 characters |
constant_keyword |
| data_stream.namespace | A user defined namespace. Namespaces are useful to allow grouping of data. Many users already organize their indices this way, and the data stream naming scheme now provides this best practice as a default. Many users will populate this field with default. If no value is used, it falls back to default. Beyond the Elasticsearch index naming criteria noted above, namespace value has the additional restrictions: * Must not contain - * No longer than 100 characters |
constant_keyword |
| data_stream.type | An overarching type for the data stream. Currently allowed values are "logs" and "metrics". We expect to also add "traces" and "synthetics" in the near future. | constant_keyword |
| event.dataset | Name of the dataset. If an event source publishes more than one type of log or events (e.g. access log, error log), the dataset is used to specify which one the event comes from. It's recommended but not required to start the dataset name with the module name, followed by a dot, then the dataset name. | constant_keyword |
| event.module | Name of the module this data is coming from. If your monitoring agent supports the concept of modules or plugins to process events of a given source (e.g. Apache logs), event.module should contain the name of this module. |
constant_keyword |
| input.type | Type of filebeat input. | keyword |
| log.offset | Log offset. | long |
| observer.product | The product name of the observer. | constant_keyword |
| observer.type | The type of the observer the data is coming from. There is no predefined list of observer types. Some examples are forwarder, firewall, ids, ips, proxy, poller, sensor, APM server. |
constant_keyword |
| observer.vendor | Vendor name of the observer. | constant_keyword |
Example
{
    "@timestamp": "2025-11-18T08:47:03.000Z",
    "agent": {
        "ephemeral_id": "99ec3044-a831-42d5-9c9a-c11693f17eba",
        "id": "dc44108a-a4ea-4a4f-a360-c688935ebb4b",
        "name": "elastic-agent-43217",
        "type": "filebeat",
        "version": "8.19.0"
    },
    "cato_networks": {
        "audit": {
            "account_id": "22222",
            "change": {
                "after": {
                    "action": "BLOCK",
                    "enabled": "true",
                    "name": "WAN Traffic",
                    "rule_type": "IPS",
                    "suspicious_action": "MONITOR"
                }
            },
            "model_name": "WAN Traffic",
            "model_type": "Antivirus Rule",
            "module": "Threat Protection Rule"
        }
    },
    "data_stream": {
        "dataset": "cato_networks.audit",
        "namespace": "44561",
        "type": "logs"
    },
    "ecs": {
        "version": "9.3.0"
    },
    "elastic_agent": {
        "id": "dc44108a-a4ea-4a4f-a360-c688935ebb4b",
        "snapshot": false,
        "version": "8.19.0"
    },
    "event": {
        "action": "created",
        "agent_id_status": "verified",
        "category": [
            "configuration"
        ],
        "created": "2025-11-18T08:47:10.734Z",
        "dataset": "cato_networks.audit",
        "ingested": "2026-07-03T11:24:10Z",
        "kind": "event",
        "original": "{\"account_id\":\"22222\",\"admin\":\"System User #40276\",\"admin_id\":\"40276\",\"change.After.action\":\"BLOCK\",\"change.After.enabled\":\"true\",\"change.After.name\":\"WAN Traffic\",\"change.After.ruleType\":\"IPS\",\"change.After.suspiciousAction\":\"MONITOR\",\"change_type\":\"CREATED\",\"creation_date\":\"1763455623000\",\"insertion_date\":\"1763455630734\",\"model_name\":\"WAN Traffic\",\"model_type\":\"Antivirus Rule\",\"module\":\"Threat Protection Rule\"}",
        "type": [
            "info",
            "creation"
        ]
    },
    "input": {
        "type": "cel"
    },
    "related": {
        "user": [
            "40276",
            "System User #40276"
        ]
    },
    "tags": [
        "preserve_original_event",
        "forwarded",
        "cato_networks-audit"
    ],
    "user": {
        "id": "40276",
        "name": "System User #40276"
    }
}
Example
{
    "@timestamp": "2026-03-02T10:43:11.573Z",
    "agent": {
        "ephemeral_id": "35454f56-d452-4d7f-b9f8-5a9e39df533c",
        "id": "e345b805-ff83-41b0-b718-69fff6c02587",
        "name": "elastic-agent-96787",
        "type": "filebeat",
        "version": "8.19.0"
    },
    "cato_networks": {
        "event": {
            "ad_name": "James Smith",
            "app_stack": "TCP, TLS, HTTP(S)",
            "application_id": "http",
            "application_risk": 2,
            "application_type": "System",
            "categories": "Gambling",
            "cato_app": "http",
            "client_class": "unclassified tls",
            "client_version": "5.21.5.8548",
            "congestion_algorithm": "BBR",
            "connection_origin": "Cato Client",
            "device_categories": "PC",
            "device_name": "WORKSTATION-01",
            "device_os_type": "Windows Workstation",
            "device_posture_profile": "Windows managed",
            "device_type": "Workstation",
            "egress_pop_name": "Bucharest",
            "event_count": 1,
            "event_sub_type": "Internet Firewall",
            "event_type": "Security",
            "flow_id": "362862917479975360",
            "internal_id": "250b9bf09f51bff2",
            "internalid": "250b9bf09f51bff2",
            "isp_name": "Cato Networks Inc.",
            "network_rule": "Akira Impossible Travel",
            "os_type": "OS_WINDOWS",
            "public_ip": "81.2.69.144",
            "qos_priority": 10,
            "src_is_site_or_vpn": "SDP User",
            "src_isp_ip": "89.160.20.112",
            "src_site_id": "1000033",
            "src_site_name": "Jane Smith",
            "static_host": false,
            "tcp_acceleration": true,
            "time": "2026-03-02T10:43:11.573Z",
            "tls_inspection": true,
            "traffic_direction": "OUTBOUND",
            "url": "https://shop.example.org/",
            "user_reference_id": "2770852121",
            "visible_device_id": "00-00-5e-00-53-01"
        }
    },
    "client": {
        "ip": "1.128.0.0"
    },
    "data_stream": {
        "dataset": "cato_networks.event",
        "namespace": "86257",
        "type": "logs"
    },
    "destination": {
        "address": "89.160.20.128",
        "geo": {
            "country_iso_code": "US",
            "country_name": "United States"
        },
        "ip": "89.160.20.128",
        "port": 443
    },
    "ecs": {
        "version": "9.3.0"
    },
    "elastic_agent": {
        "id": "e345b805-ff83-41b0-b718-69fff6c02587",
        "snapshot": false,
        "version": "8.19.0"
    },
    "event": {
        "action": "prompt",
        "agent_id_status": "verified",
        "category": [
            "network"
        ],
        "dataset": "cato_networks.event",
        "id": "250b9bf09f51bff2",
        "ingested": "2026-07-03T11:25:32Z",
        "kind": "event",
        "original": "{\"ISP_name\":\"Cato Networks Inc.\",\"account_id\":\"12345\",\"account_name\":\"Demo-Mode\",\"action\":\"Prompt\",\"ad_name\":\"James Smith\",\"app_stack\":\"TCP, TLS, HTTP(S)\",\"application_id\":\"http\",\"application_name\":\"HTTP(S)\",\"application_risk\":\"2\",\"application_type\":\"System\",\"categories\":\"Gambling\",\"cato_app\":\"http\",\"client_class\":\"unclassified tls\",\"client_ip\":\"1.128.0.0\",\"client_version\":\"5.21.5.8548\",\"configured_host_name\":\"WORKSTATION-01\",\"congestion_algorithm\":\"BBR\",\"connection_origin\":\"Cato Client\",\"dest_country\":\"United States\",\"dest_country_code\":\"US\",\"dest_ip\":\"89.160.20.128\",\"dest_port\":\"443\",\"device_categories\":\"PC\",\"device_id\":\"000000000000000000000001\",\"device_name\":\"WORKSTATION-01\",\"device_os_type\":\"Windows Workstation\",\"device_posture_profile\":\"Windows managed\",\"device_type\":\"Workstation\",\"domain_name\":\"shop.example.org\",\"egress_pop_name\":\"Bucharest\",\"event_count\":\"1\",\"event_id\":\"250b9bf09f51bff2\",\"event_sub_type\":\"Internet Firewall\",\"event_type\":\"Security\",\"flow_id\":\"362862917479975360\",\"full_path_url\":\"https://shop.example.org/\",\"host_ip\":\"1.128.0.0\",\"host_mac\":\"00:00:5e:00:53:01\",\"http_request_method\":\"GET\",\"internalId\":\"250b9bf09f51bff2\",\"internal_id\":\"250b9bf09f51bff2\",\"ip_protocol\":\"TCP\",\"network_rule\":\"Akira Impossible Travel\",\"os_type\":\"OS_WINDOWS\",\"os_version\":\"11\",\"pop_name\":\"Miami\",\"prompt_action\":\"\",\"public_ip\":\"81.2.69.144\",\"qos_priority\":\"10\",\"request_size\":\"0\",\"rule_id\":\"8512269566766760473\",\"rule_name\":\"Prompt for Risky Categories\",\"server_ip\":\"89.160.20.128\",\"src_country\":\"United States\",\"src_country_code\":\"US\",\"src_ip\":\"1.128.0.0\",\"src_is_site_or_vpn\":\"SDP User\",\"src_isp_ip\":\"89.160.20.112\",\"src_port\":\"59929\",\"src_site_id\":\"1000033\",\"src_site_name\":\"Jane Smith\",\"static_host\":\"false\",\"tcp_acceleration\":\"true\",\"time\":\"1772448191573\",\"time_str\":\"2026-03-02T10:43:11Z\",\"tls_inspection\":\"true\",\"traffic_direction\":\"OUTBOUND\",\"url\":\"https://shop.example.org/\",\"user_agent\":\"Python-urllib/3.10\",\"user_id\":\"1000033\",\"user_name\":\"Jane Smith\",\"user_reference_id\":\"2770852121\",\"visible_device_id\":\"00-00-5e-00-53-01\",\"vpn_user_email\":\"jane.smith@test.example.com\"}",
        "type": [
            "info"
        ]
    },
    "host": {
        "id": "000000000000000000000001",
        "ip": [
            "1.128.0.0"
        ],
        "mac": [
            "00-00-5E-00-53-01"
        ],
        "name": "workstation-01",
        "os": {
            "type": "windows",
            "version": "11"
        }
    },
    "http": {
        "request": {
            "bytes": 0,
            "method": "GET"
        }
    },
    "input": {
        "type": "cel"
    },
    "network": {
        "direction": "outbound",
        "transport": "tcp"
    },
    "observer": {
        "name": "Miami"
    },
    "organization": {
        "id": "12345",
        "name": "Demo-Mode"
    },
    "related": {
        "hosts": [
            "WORKSTATION-01",
            "workstation-01",
            "shop.example.org"
        ],
        "ip": [
            "1.128.0.0",
            "89.160.20.128",
            "81.2.69.144",
            "89.160.20.112"
        ],
        "user": [
            "James Smith",
            "Jane Smith",
            "1000033",
            "jane.smith@test.example.com"
        ]
    },
    "rule": {
        "id": "8512269566766760473",
        "name": "Prompt for Risky Categories"
    },
    "server": {
        "ip": "89.160.20.128"
    },
    "service": {
        "name": "HTTP(S)"
    },
    "source": {
        "address": "1.128.0.0",
        "geo": {
            "country_iso_code": "US",
            "country_name": "United States"
        },
        "ip": "1.128.0.0",
        "port": 59929
    },
    "tags": [
        "preserve_original_event",
        "forwarded",
        "cato_networks-event"
    ],
    "url": {
        "domain": "shop.example.org",
        "full": "https://shop.example.org/"
    },
    "user": {
        "email": "jane.smith@test.example.com",
        "id": "1000033",
        "name": "Jane Smith"
    },
    "user_agent": {
        "device": {
            "name": "Spider"
        },
        "name": "Python-urllib",
        "original": "Python-urllib/3.10",
        "version": "3.10"
    }
}
This input is used in the integration:
This integration uses the following Cato Networks API:
Events Feed: Cato Networks Events Feed API documentation. Audit Feed: Cato Networks Audit Feed API documentation.
This integration includes one or more Kibana dashboards that visualizes the data collected by the integration. The screenshots below illustrate how the ingested data is displayed.
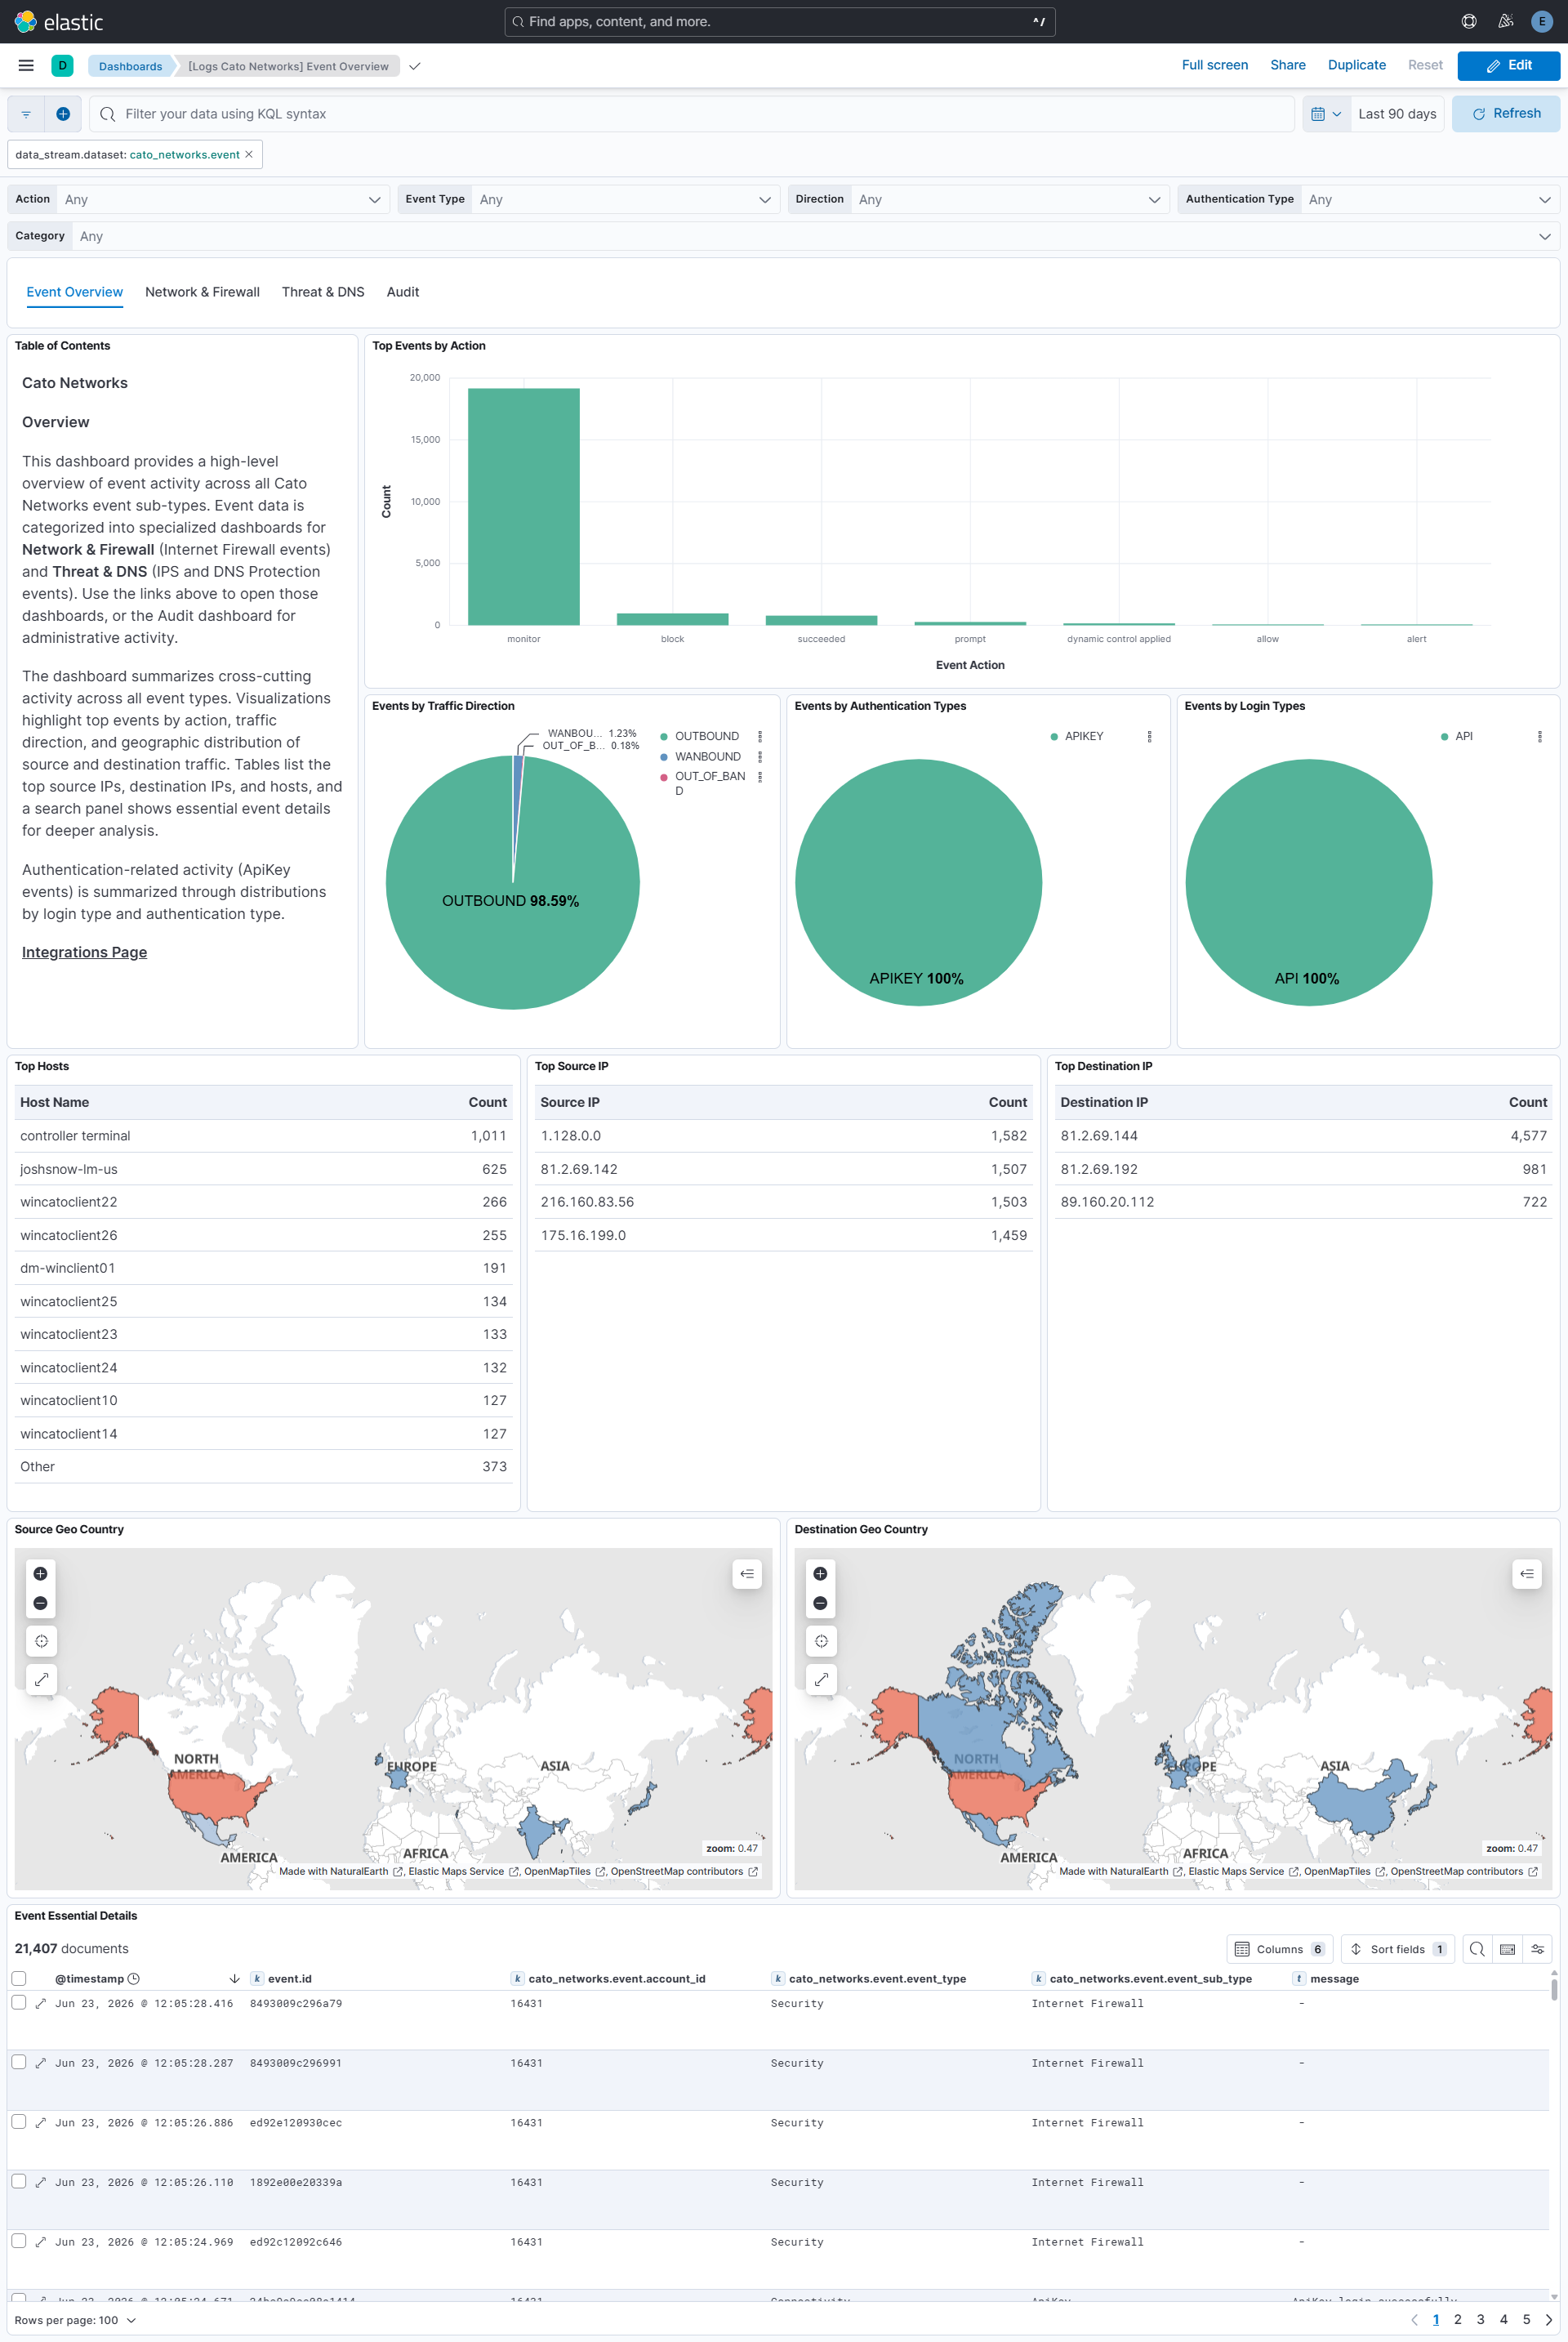
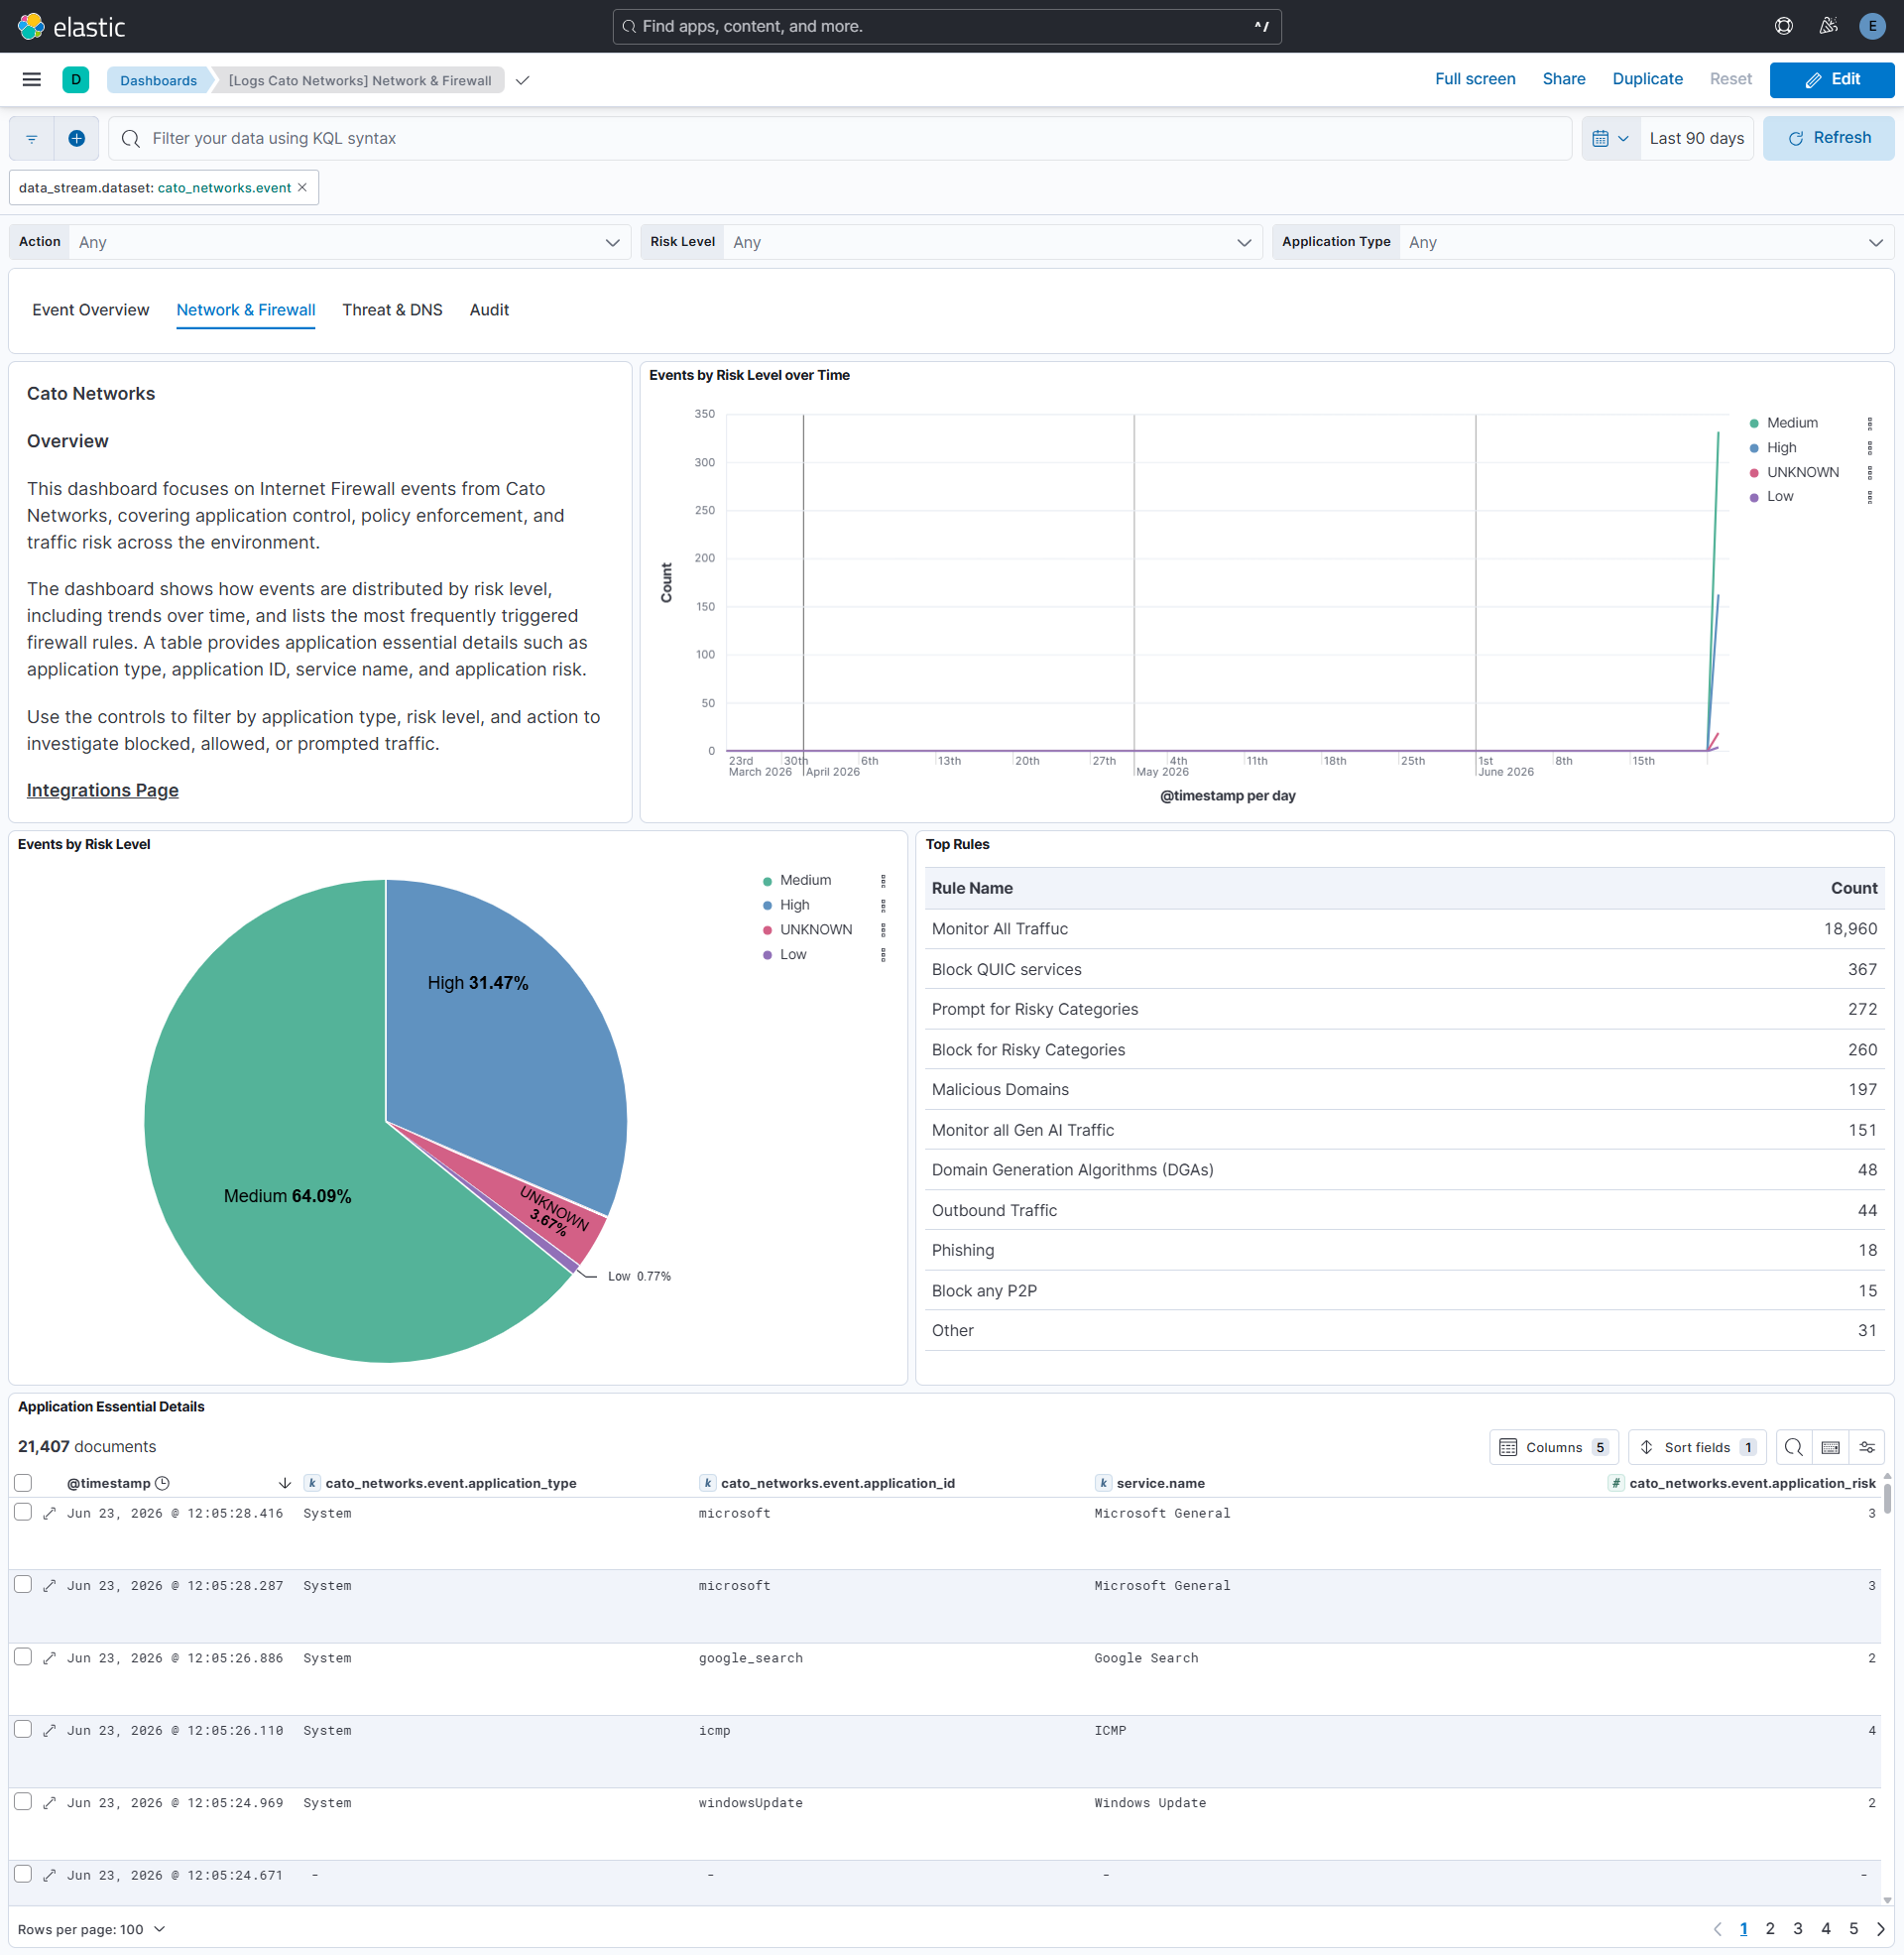
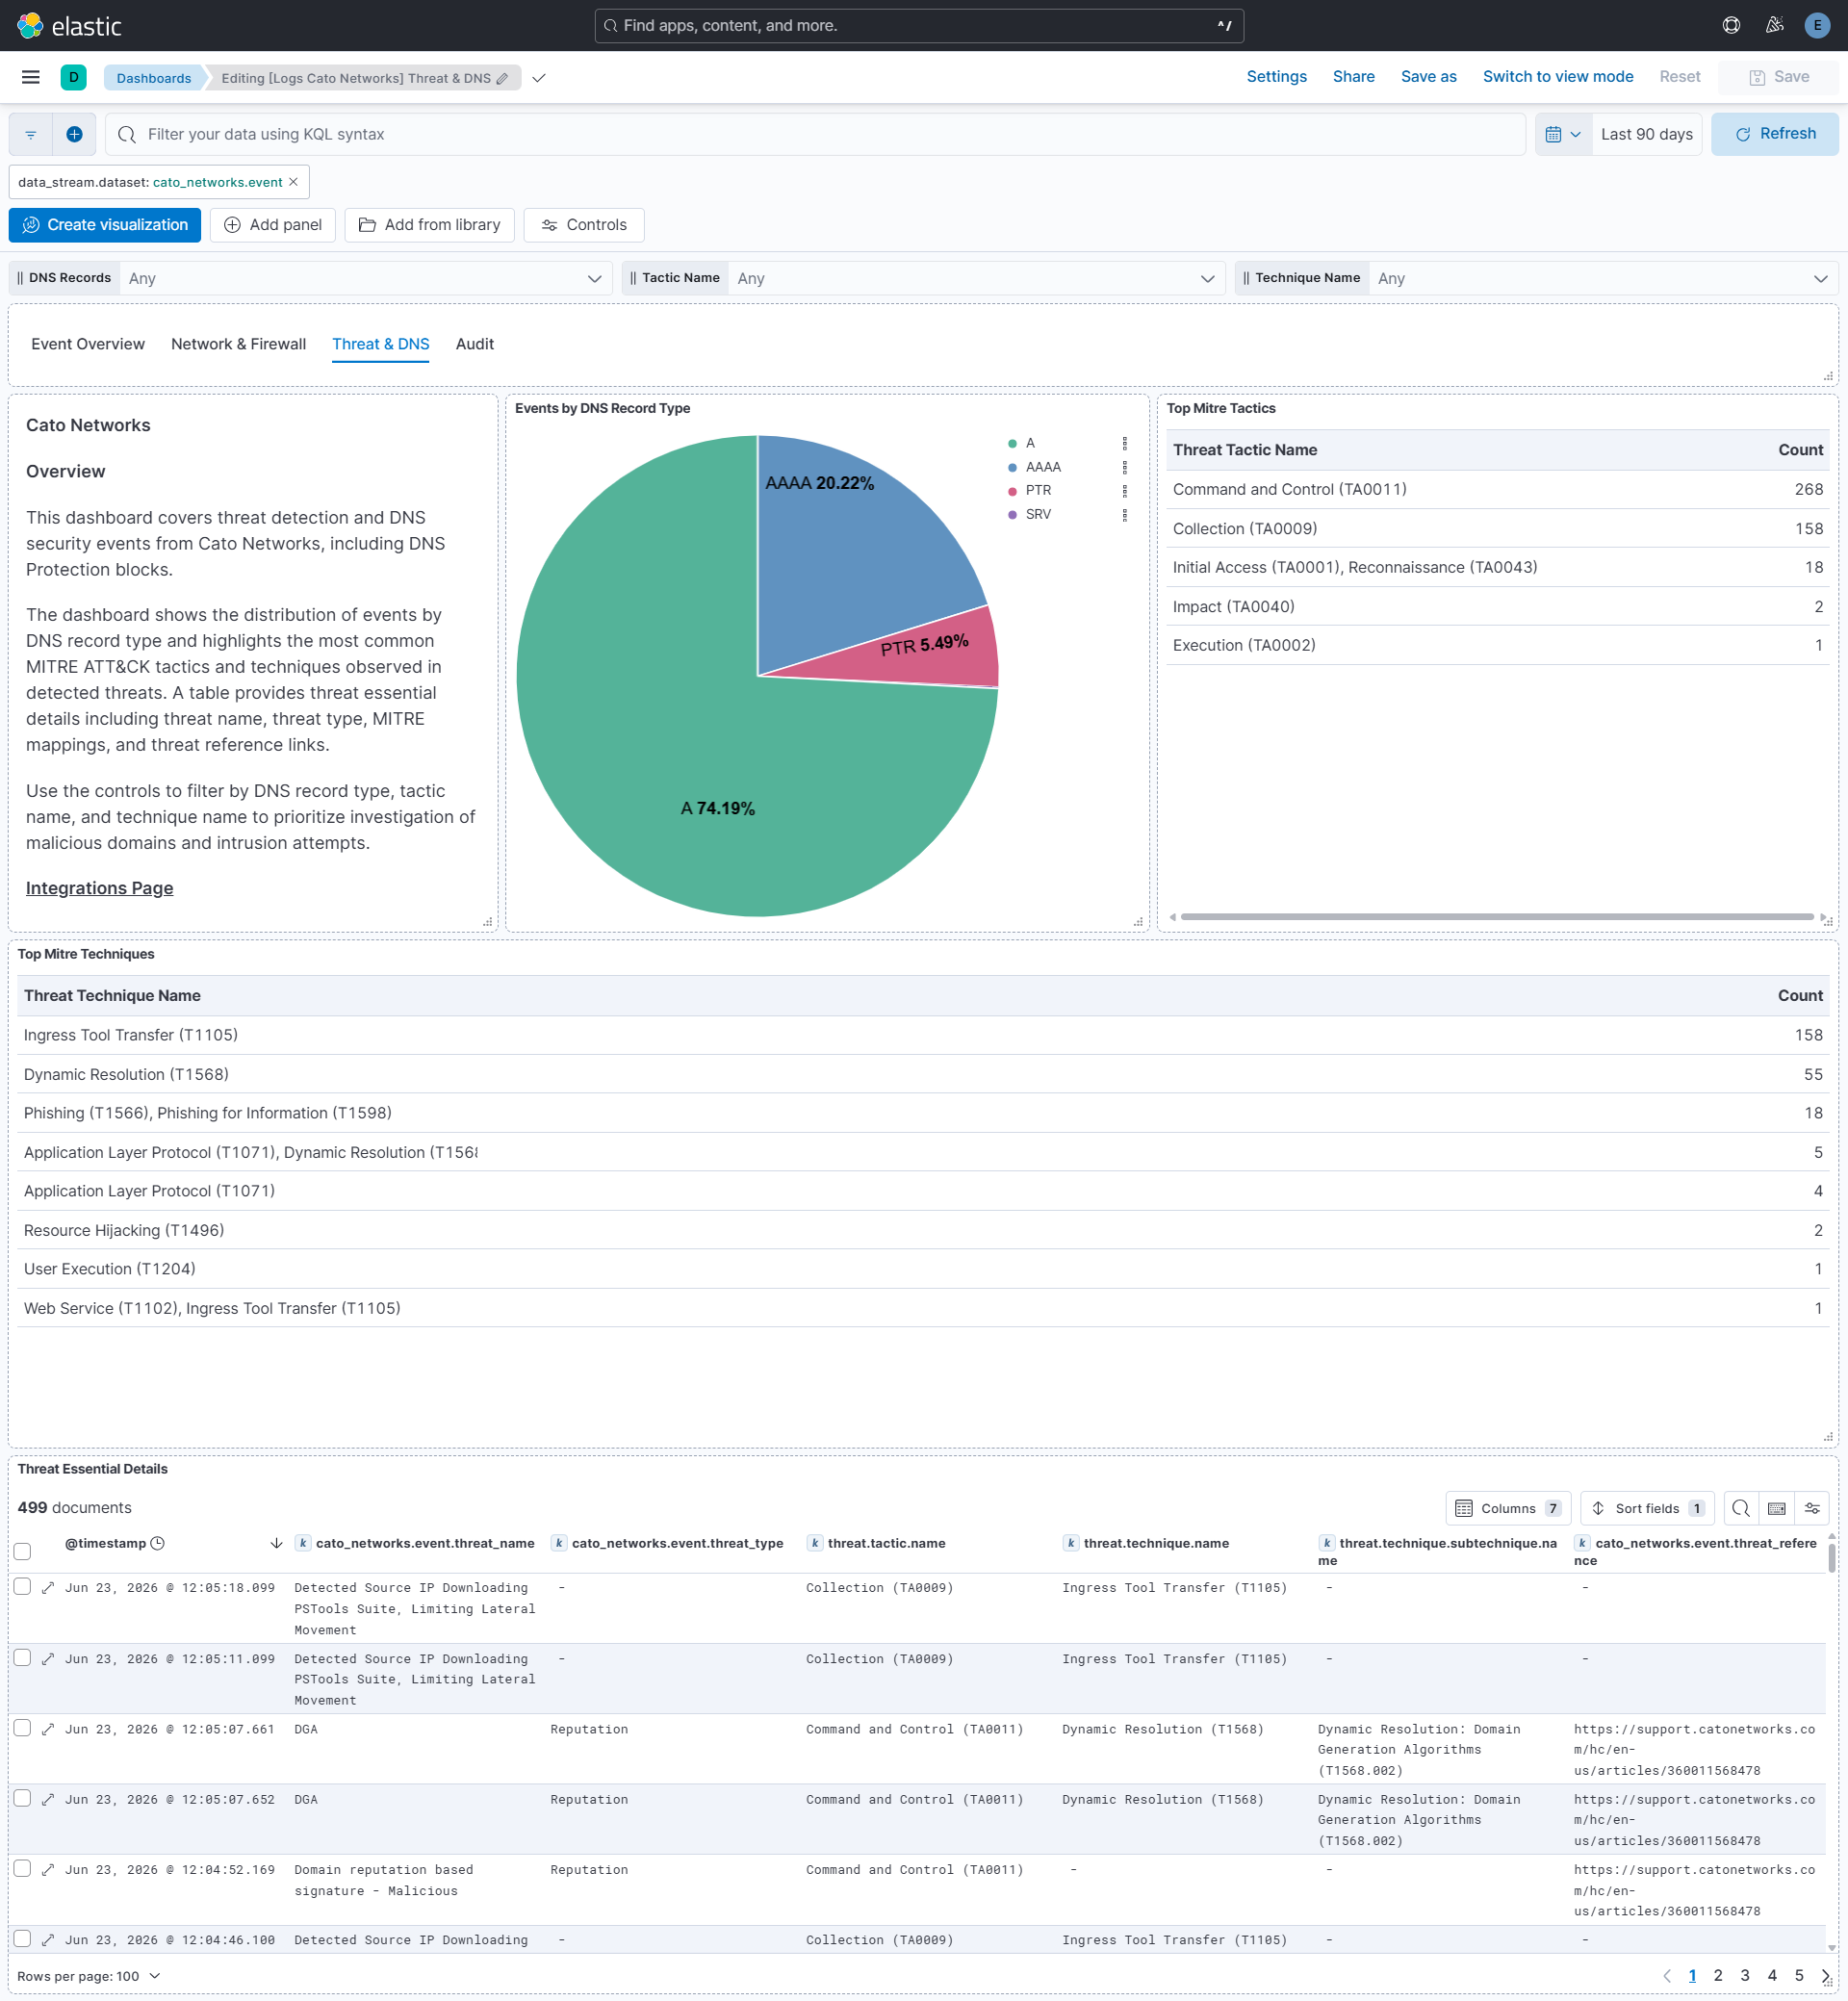
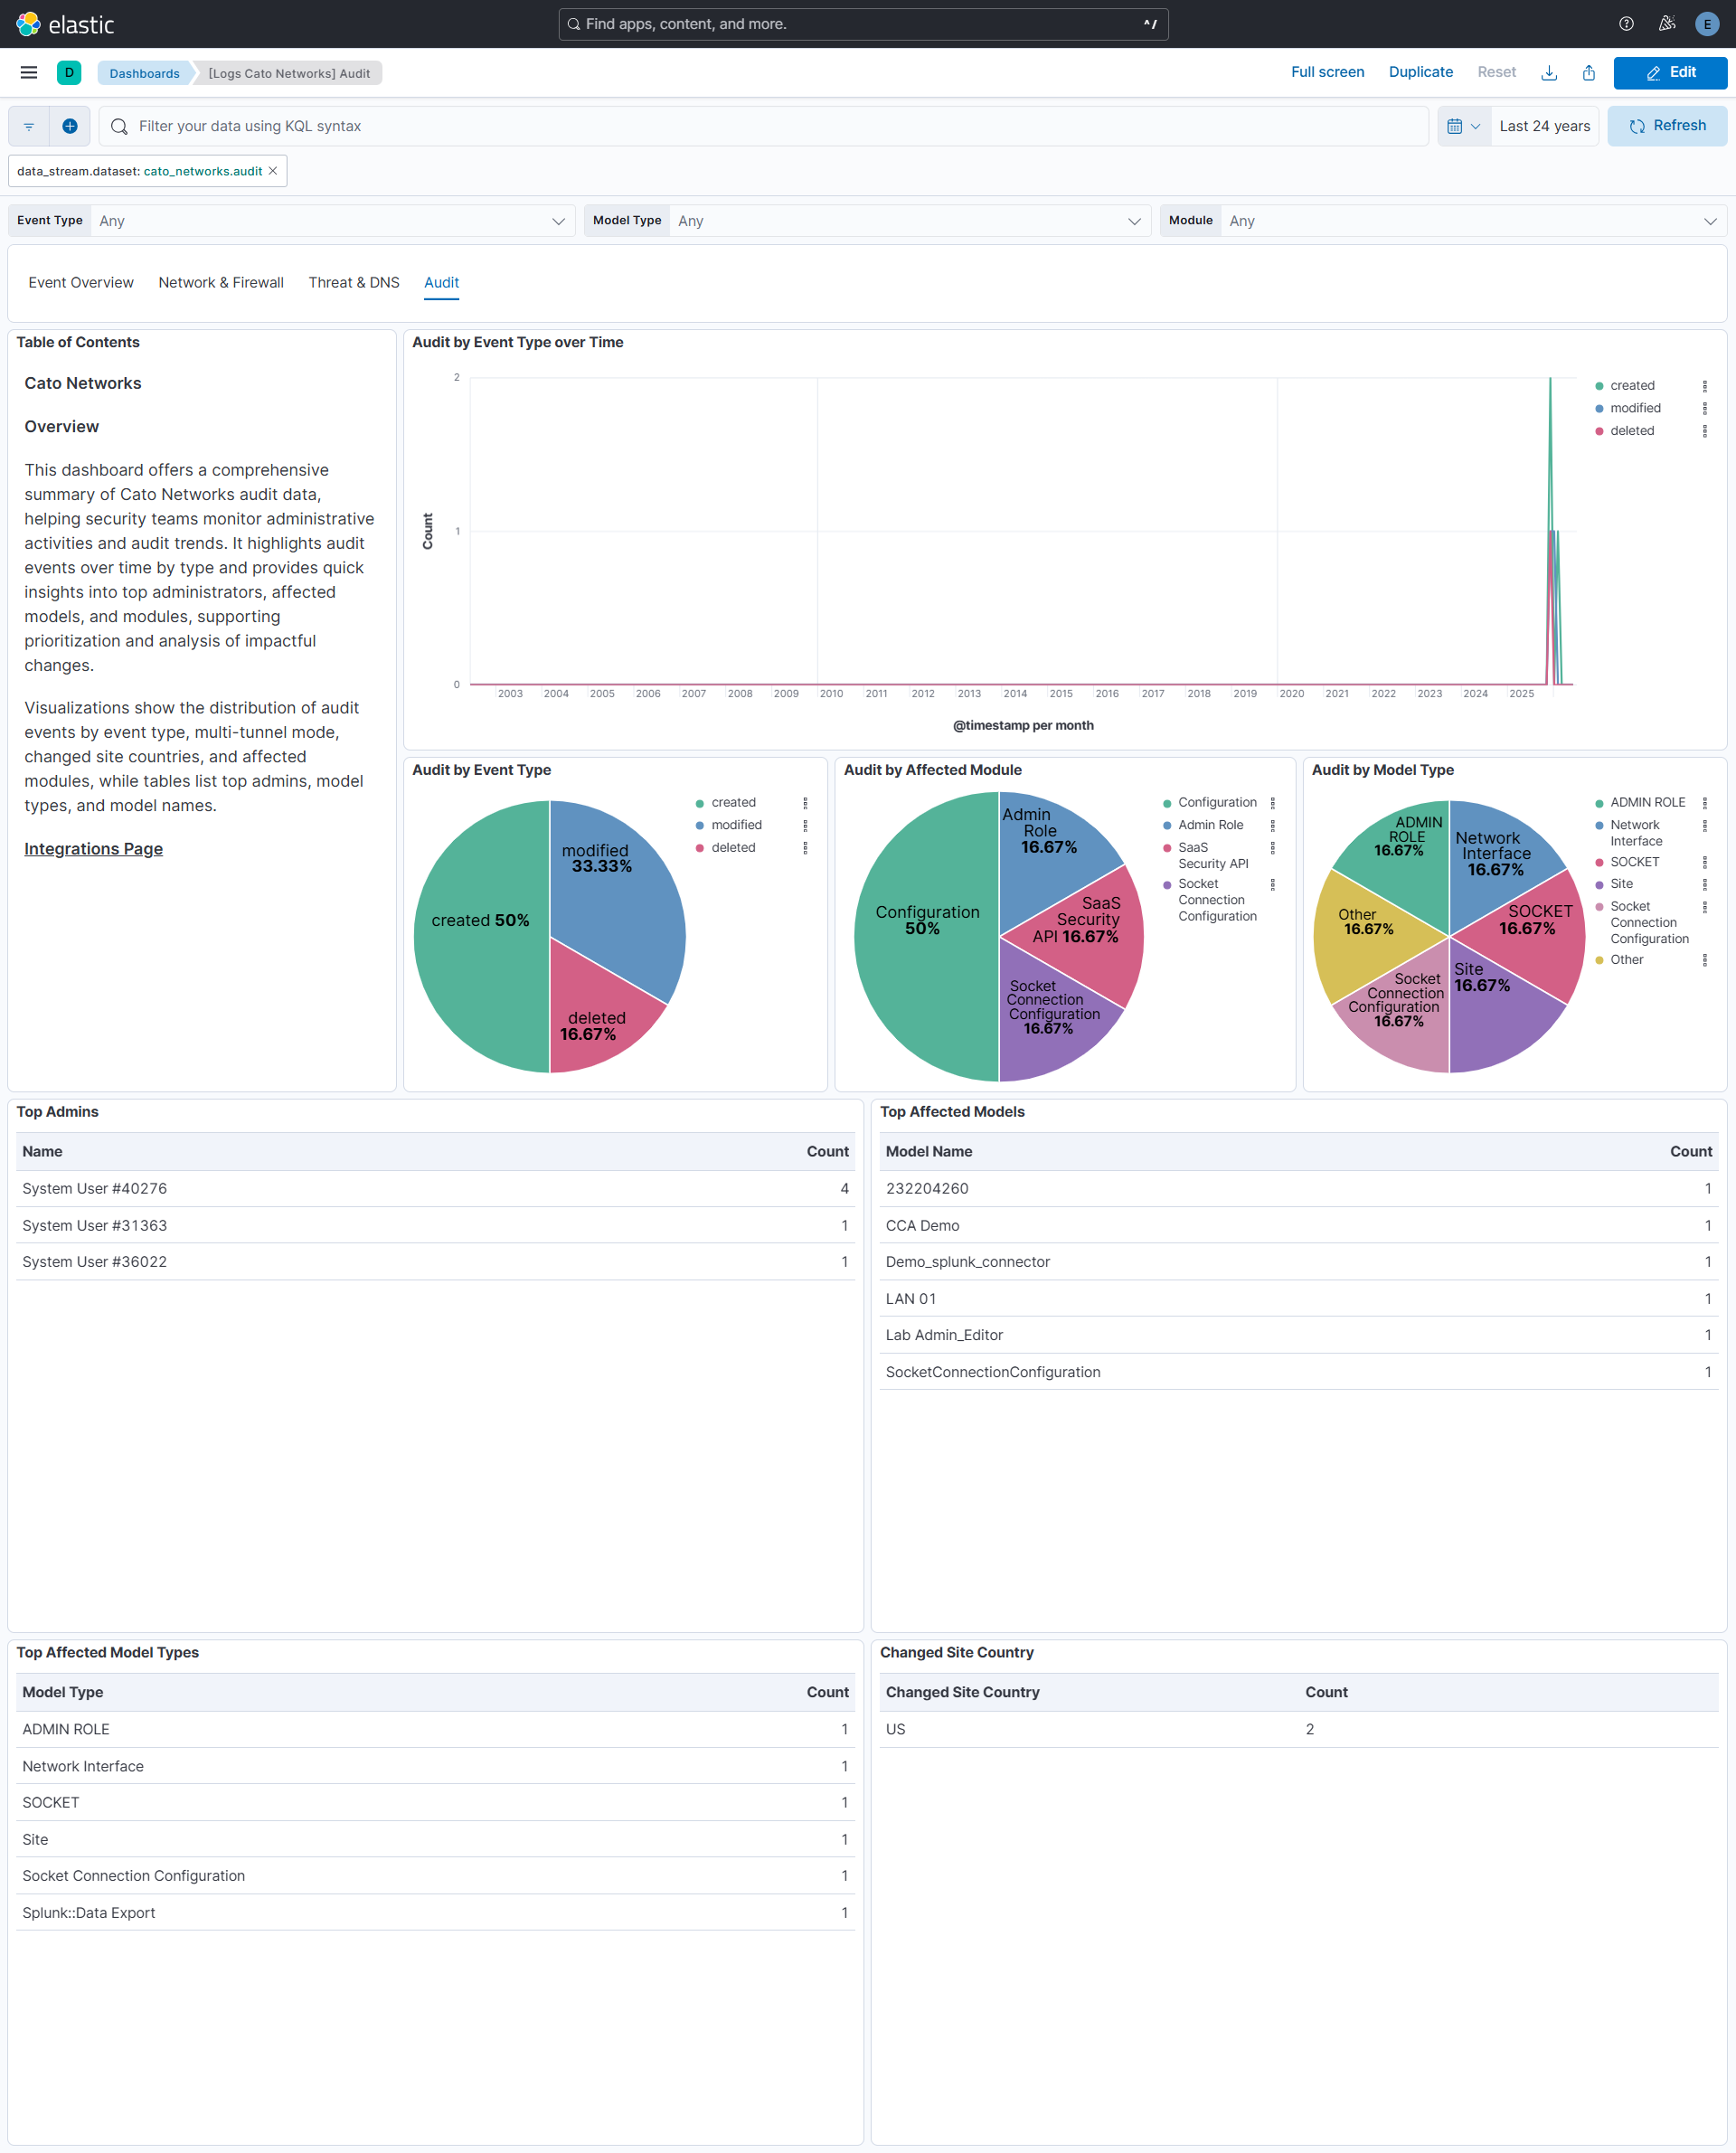
Changelog
| Version | Details | Minimum Kibana version |
|---|---|---|
| 0.1.3 | Bug fix (View pull request) Fix the event input silently succeeding when the Cato Networks API returns a non-null accounts.errorString with HTTP 200. The input now surfaces this as an input error so Fleet reports the stream as unhealthy. |
9.1.0 8.19.0 |
| 0.1.2 | Bug fix (View pull request) Set agentless deployment mode release field to beta. |
9.1.0 8.19.0 |
| 0.1.1 | Enhancement (View pull request) Simplify the audit last_timestamp parse guard to use is_error instead of try/has. |
9.1.0 8.19.0 |
| 0.1.0 | Enhancement (View pull request) Initial release of package. |
9.1.0 8.19.0 |