SOCRadar Integration
| Version | 0.1.0
|
| Subscription level What's this? |
Basic |
| Developed by What's this? |
Elastic |
| Ingestion method(s) | API |
| Minimum Kibana version(s) | 9.0.0 8.18.0 |
To use pre-release integrations, go to the Integrations page in Kibana, scroll down, and toggle on the Display beta integrations option.
The SOCRadar integration collects security alarms from the SOCRadar platform via its REST API and ingests them into Elasticsearch. Each alarm is stored as a log event in the logs-socradar_alert.incidents-* data stream.
Alarms are indexed as ECS event.kind: alert documents that can be explored in Kibana Discover and the included dashboard.
This integration is compatible with SOCRadar API v4.
The integration uses the CEL input to poll the SOCRadar REST API at a configurable interval. On first run, it fetches alarms from a configurable lookback period. On subsequent runs, it fetches only alarms created since the last successful poll. Alarm data is normalized via an ingest pipeline and stored in the incidents data stream.
The SOCRadar integration collects security alarm events from the following endpoint:
GET /api/company/{company_id}/incidents/v4
Each event represents a single SOCRadar alarm and includes details such as risk level, alarm type, status, affected assets, and related entities.
- Centralized alarm visibility — View all SOCRadar alarms in Kibana Discover and the included dashboard.
- Risk-based triage — Alarm risk levels are mapped to ECS
event.severityso alarms can be filtered and prioritized by severity.
- A valid SOCRadar API Key
- Your SOCRadar Company ID
- Elastic Agent installed on a host with network access to
https://platform.socradar.com
Elastic Agent must be installed. For more details, check the Elastic Agent installation instructions. You can install only one Elastic Agent per host.
- In Kibana, go to Fleet → Integrations and search for SOCRadar.
- Click Add SOCRadar.
- Fill in the required fields:
- API Key — Your SOCRadar API key.
- Company ID — Your SOCRadar company ID (e.g.,
330). - API URL — SOCRadar API base URL (default:
https://platform.socradar.com). - Initial Lookback Period — How far back to fetch alarms on first run (e.g.,
72h,720hfor 30 days). - Polling Interval — How often to poll for new alarms (default:
5m).
- Click Save and continue.
After installation, open Kibana → Discover and filter by index logs-socradar_alert.incidents-*. Alarms should appear within one polling interval.
You can also open the SOCRadar dashboard from Kibana → Dashboards to verify data is flowing correctly.
For help with Elastic ingest tools, check Common problems.
- Confirm the Elastic Agent is running and has network access to
https://platform.socradar.com. - Check the agent logs in Fleet → Agents.
- Verify your API Key and Company ID are correct.
The integration polls the SOCRadar alarms endpoint once per Polling Interval (default 5m) and pages through the results using Records per page (default 100) until it reaches the last page.
- The first collection replays the whole Initial Lookback Period (default
72h, configurable up to8760h). A large lookback issues many paged requests in a single cycle, so start with a smaller window if you are close to your SOCRadar API quota. - Each alarm is indexed under a document ID derived from its alarm ID, so an alarm that is re-fetched (for example when a mid-pagination retry replays an earlier page) is rejected as a duplicate rather than indexed twice.
- Lower the polling interval only if your alarm volume justifies it; every collection cycle costs at least one API request.
For more information on architectures that can be used for scaling this integration, check the Ingest Architectures documentation.
The incidents data stream collects alarm events from the SOCRadar API.
Example
{
    "@timestamp": "2024-02-03T08:15:42.000Z",
    "agent": {
        "ephemeral_id": "e417fc2e-6879-442d-8b6a-21c1cd4882a9",
        "id": "205fe089-c340-40d5-904b-59ed521ced73",
        "name": "elastic-agent-75436",
        "type": "filebeat",
        "version": "9.4.4"
    },
    "data_stream": {
        "dataset": "socradar_alert.incidents",
        "namespace": "default",
        "type": "logs"
    },
    "ecs": {
        "version": "9.3.0"
    },
    "elastic_agent": {
        "id": "205fe089-c340-40d5-904b-59ed521ced73",
        "snapshot": false,
        "version": "9.4.4"
    },
    "event": {
        "agent_id_status": "verified",
        "dataset": "socradar_alert.incidents",
        "id": "a1b2c3d4-0000-0000-0000-000000000002",
        "ingested": "2026-08-05T13:34:27Z",
        "kind": "alert",
        "severity": 47
    },
    "host": {
        "architecture": "aarch64",
        "containerized": false,
        "hostname": "elastic-agent-75436",
        "ip": [
            "172.20.0.2",
            "172.19.0.5"
        ],
        "mac": [
            "16-13-EF-BE-B1-4F",
            "FE-97-B3-6B-81-76"
        ],
        "name": "elastic-agent-75436",
        "os": {
            "family": "",
            "kernel": "6.12.54-linuxkit",
            "name": "Wolfi",
            "platform": "wolfi",
            "type": "linux",
            "version": "20230201"
        }
    },
    "input": {
        "type": "cel"
    },
    "message": "Leaked credentials referencing your domain were found on a paste site.",
    "related": {
        "hosts": [
            "corp.example.org"
        ]
    },
    "socradar_alert": {
        "alarm_asset": "corp.example.org",
        "alarm_default_risk_level": "MEDIUM",
        "alarm_generic_title": "Leaked Credentials Detected",
        "alarm_id": "a1b2c3d4-0000-0000-0000-000000000002",
        "alarm_main_type": "Digital Risk Protection",
        "alarm_risk_level": "MEDIUM",
        "alarm_sub_type": "Credential Leak",
        "alarm_text": "Leaked credentials referencing your domain were found on a paste site.",
        "approved_by": "analyst",
        "company_id": 330,
        "date": "2024-02-03 08:15:42",
        "is_approved": true,
        "notification_id": 1002,
        "status": "RESOLVED",
        "tags": [
            "credential-leak"
        ]
    }
}
Exported fields
| Field | Description | Type |
|---|---|---|
| @timestamp | Date/time when the event originated. This is the date/time extracted from the event, typically representing when the event was generated by the source. If the event source has no original timestamp, this value is typically populated by the first time the event was received by the pipeline. Required field for all events. | date |
| data_stream.dataset | The field can contain anything that makes sense to signify the source of the data. Examples include nginx.access, prometheus, endpoint etc. For data streams that otherwise fit, but that do not have dataset set we use the value "generic" for the dataset value. event.dataset should have the same value as data_stream.dataset. Beyond the Elasticsearch data stream naming criteria noted above, the dataset value has additional restrictions: * Must not contain - * No longer than 100 characters |
constant_keyword |
| data_stream.namespace | A user defined namespace. Namespaces are useful to allow grouping of data. Many users already organize their indices this way, and the data stream naming scheme now provides this best practice as a default. Many users will populate this field with default. If no value is used, it falls back to default. Beyond the Elasticsearch index naming criteria noted above, namespace value has the additional restrictions: * Must not contain - * No longer than 100 characters |
constant_keyword |
| data_stream.type | An overarching type for the data stream. Currently allowed values are "logs" and "metrics". We expect to also add "traces" and "synthetics" in the near future. | constant_keyword |
| event.dataset | Name of the dataset. If an event source publishes more than one type of log or events (e.g. access log, error log), the dataset is used to specify which one the event comes from. It's recommended but not required to start the dataset name with the module name, followed by a dot, then the dataset name. | constant_keyword |
| event.id | Unique ID to describe the event. | keyword |
| event.module | Name of the module this data is coming from. If your monitoring agent supports the concept of modules or plugins to process events of a given source (e.g. Apache logs), event.module should contain the name of this module. |
constant_keyword |
| event.severity | The numeric severity of the event according to your event source. What the different severity values mean can be different between sources and use cases. It's up to the implementer to make sure severities are consistent across events from the same source. The Syslog severity belongs in log.syslog.severity.code. event.severity is meant to represent the severity according to the event source (e.g. firewall, IDS). If the event source does not publish its own severity, you may optionally copy the log.syslog.severity.code to event.severity. |
long |
| input.type | Type of filebeat input. | keyword |
| message | For log events the message field contains the log message, optimized for viewing in a log viewer. For structured logs without an original message field, other fields can be concatenated to form a human-readable summary of the event. If multiple messages exist, they can be combined into one message. | match_only_text |
| related.hosts | All hostnames or other host identifiers seen on your event. Example identifiers include FQDNs, domain names, workstation names, or aliases. | keyword |
| socradar_alert.alarm_asset | Asset name | keyword |
| socradar_alert.alarm_assignees | Assigned users | keyword |
| socradar_alert.alarm_default_risk_level | Default risk level (extracted) | keyword |
| socradar_alert.alarm_generic_title | Alarm generic title | keyword |
| socradar_alert.alarm_id | Unique alarm identifier | keyword |
| socradar_alert.alarm_main_type | Alarm main type (extracted) | keyword |
| socradar_alert.alarm_related_assets | Related assets | flattened |
| socradar_alert.alarm_related_entities | Related entities | flattened |
| socradar_alert.alarm_risk_level | Risk level | keyword |
| socradar_alert.alarm_sub_type | Alarm sub type (extracted) | keyword |
| socradar_alert.alarm_text | Alarm description | text |
| socradar_alert.alarm_text.keyword | Multi-field of socradar_alert.alarm_text. |
keyword |
| socradar_alert.alarm_type_id | Alarm type identifier | keyword |
| socradar_alert.approved_by | Approved by | keyword |
| socradar_alert.company_id | ID of the company | long |
| socradar_alert.content | Alarm content details | flattened |
| socradar_alert.date | The date when the alarm was created | date |
| socradar_alert.extra | Extra information | flattened |
| socradar_alert.history | Alarm history | flattened |
| socradar_alert.is_approved | Approval status | boolean |
| socradar_alert.notification_id | Notification ID | long |
| socradar_alert.status | Alarm status | keyword |
| socradar_alert.tags | Alarm tags | keyword |
| socradar_alert.title | Alarm title | keyword |
These inputs can be used with this integration:
cel
For more details about the CEL input settings, check the Filebeat documentation.
Before configuring the CEL input, make sure you have:
- Network connectivity to the target API endpoint
- Valid authentication credentials (API keys, tokens, or certificates as required)
- Appropriate permissions to read from the target data source
To configure the CEL input, you must specify the request.url value pointing to the API endpoint. The interval parameter controls how frequently requests are made and is the primary way to balance data freshness with API rate limits and costs. Authentication is often configured through the request.headers section using the appropriate method for the service.
To access the API service, make sure you have the necessary API credentials and that the Filebeat instance can reach the endpoint URL. Some services may require IP whitelisting or VPN access.
To collect logs via API endpoint, configure the following parameters:
- API Endpoint URL
- API credentials (tokens, keys, or username/password)
- Request interval (how often to fetch data)
These APIs are used with this integration:
GET /api/company/{company_id}/incidents/v4— Fetches paginated alarm events. Supportsstart_date,page,limit, andinclude_alarm_detailsquery parameters.
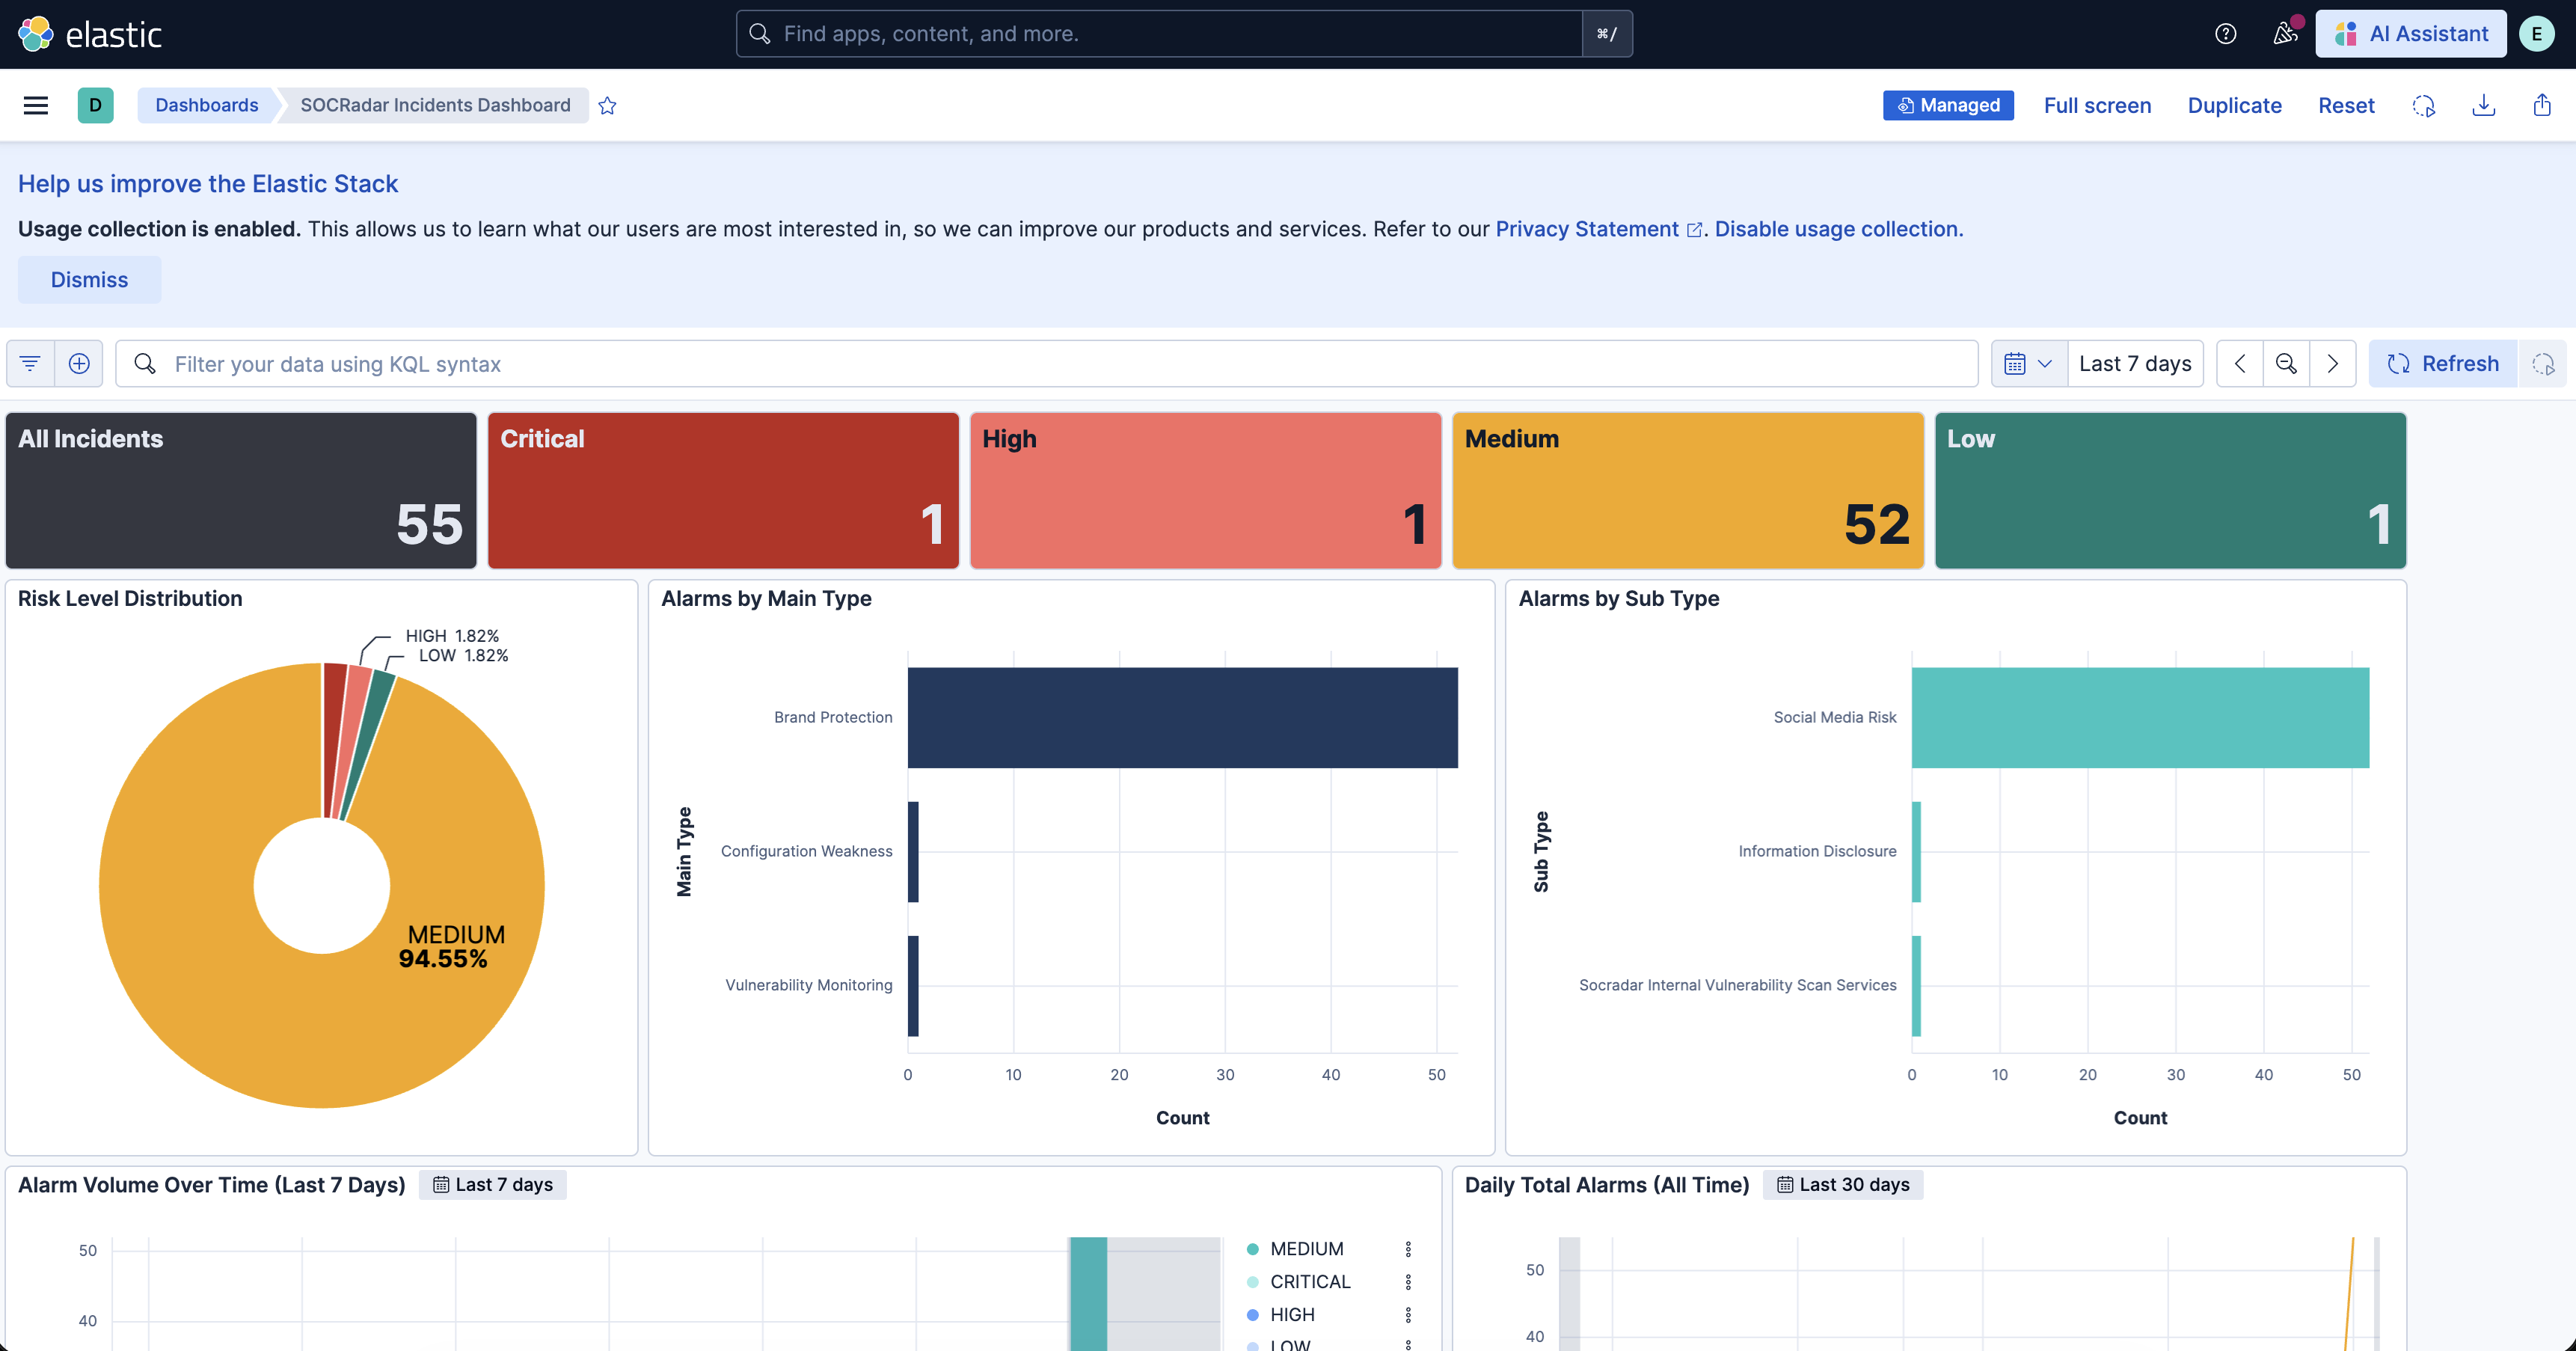
This integration includes one or more Kibana dashboards that visualizes the data collected by the integration. The screenshots below illustrate how the ingested data is displayed.
Changelog
| Version | Details | Minimum Kibana version |
|---|---|---|
| 0.1.0 | Enhancement (View pull request) Initial draft of the package |
9.0.0 8.18.0 |