GCP Compute Engine OpenTelemetry Assets
| Version | 0.3.0
|
| Subscription level What's this? |
Basic |
| Developed by What's this? |
Elastic |
| Minimum Kibana version(s) | 9.6.0 |
To use pre-release integrations, go to the Integrations page in Kibana, scroll down, and toggle on the Display beta integrations option.
This package contains Kibana assets for monitoring Compute Engine virtual machines with Google Cloud Monitoring metrics collected by the OpenTelemetry Collector.
The package is content only. It does not configure data collection. Use the Google Cloud Monitoring (OpenTelemetry) input package (googlecloudmonitor_input_otel) to collect Compute Engine metrics into Elasticsearch.
You need Elasticsearch for storing and searching your data and Kibana for visualizing and managing it. You can use our hosted Elasticsearch Service on Elastic Cloud, which is recommended, or self-manage the Elastic Stack on your own hardware.
Install the Google Cloud Monitoring OpenTelemetry Input package (googlecloudmonitor_input_otel) and configure it to collect Compute Engine Cloud Monitoring metrics (for example, compute.googleapis.com/instance/cpu/utilization). This content package provides assets that visualize data collected by that input.
When configuring the input package, set the dataset name to gcp.compute.otel so that data is written to the metrics-gcp.compute.otel-default data stream, which these dashboards query.
| Dashboard | Description |
|---|---|
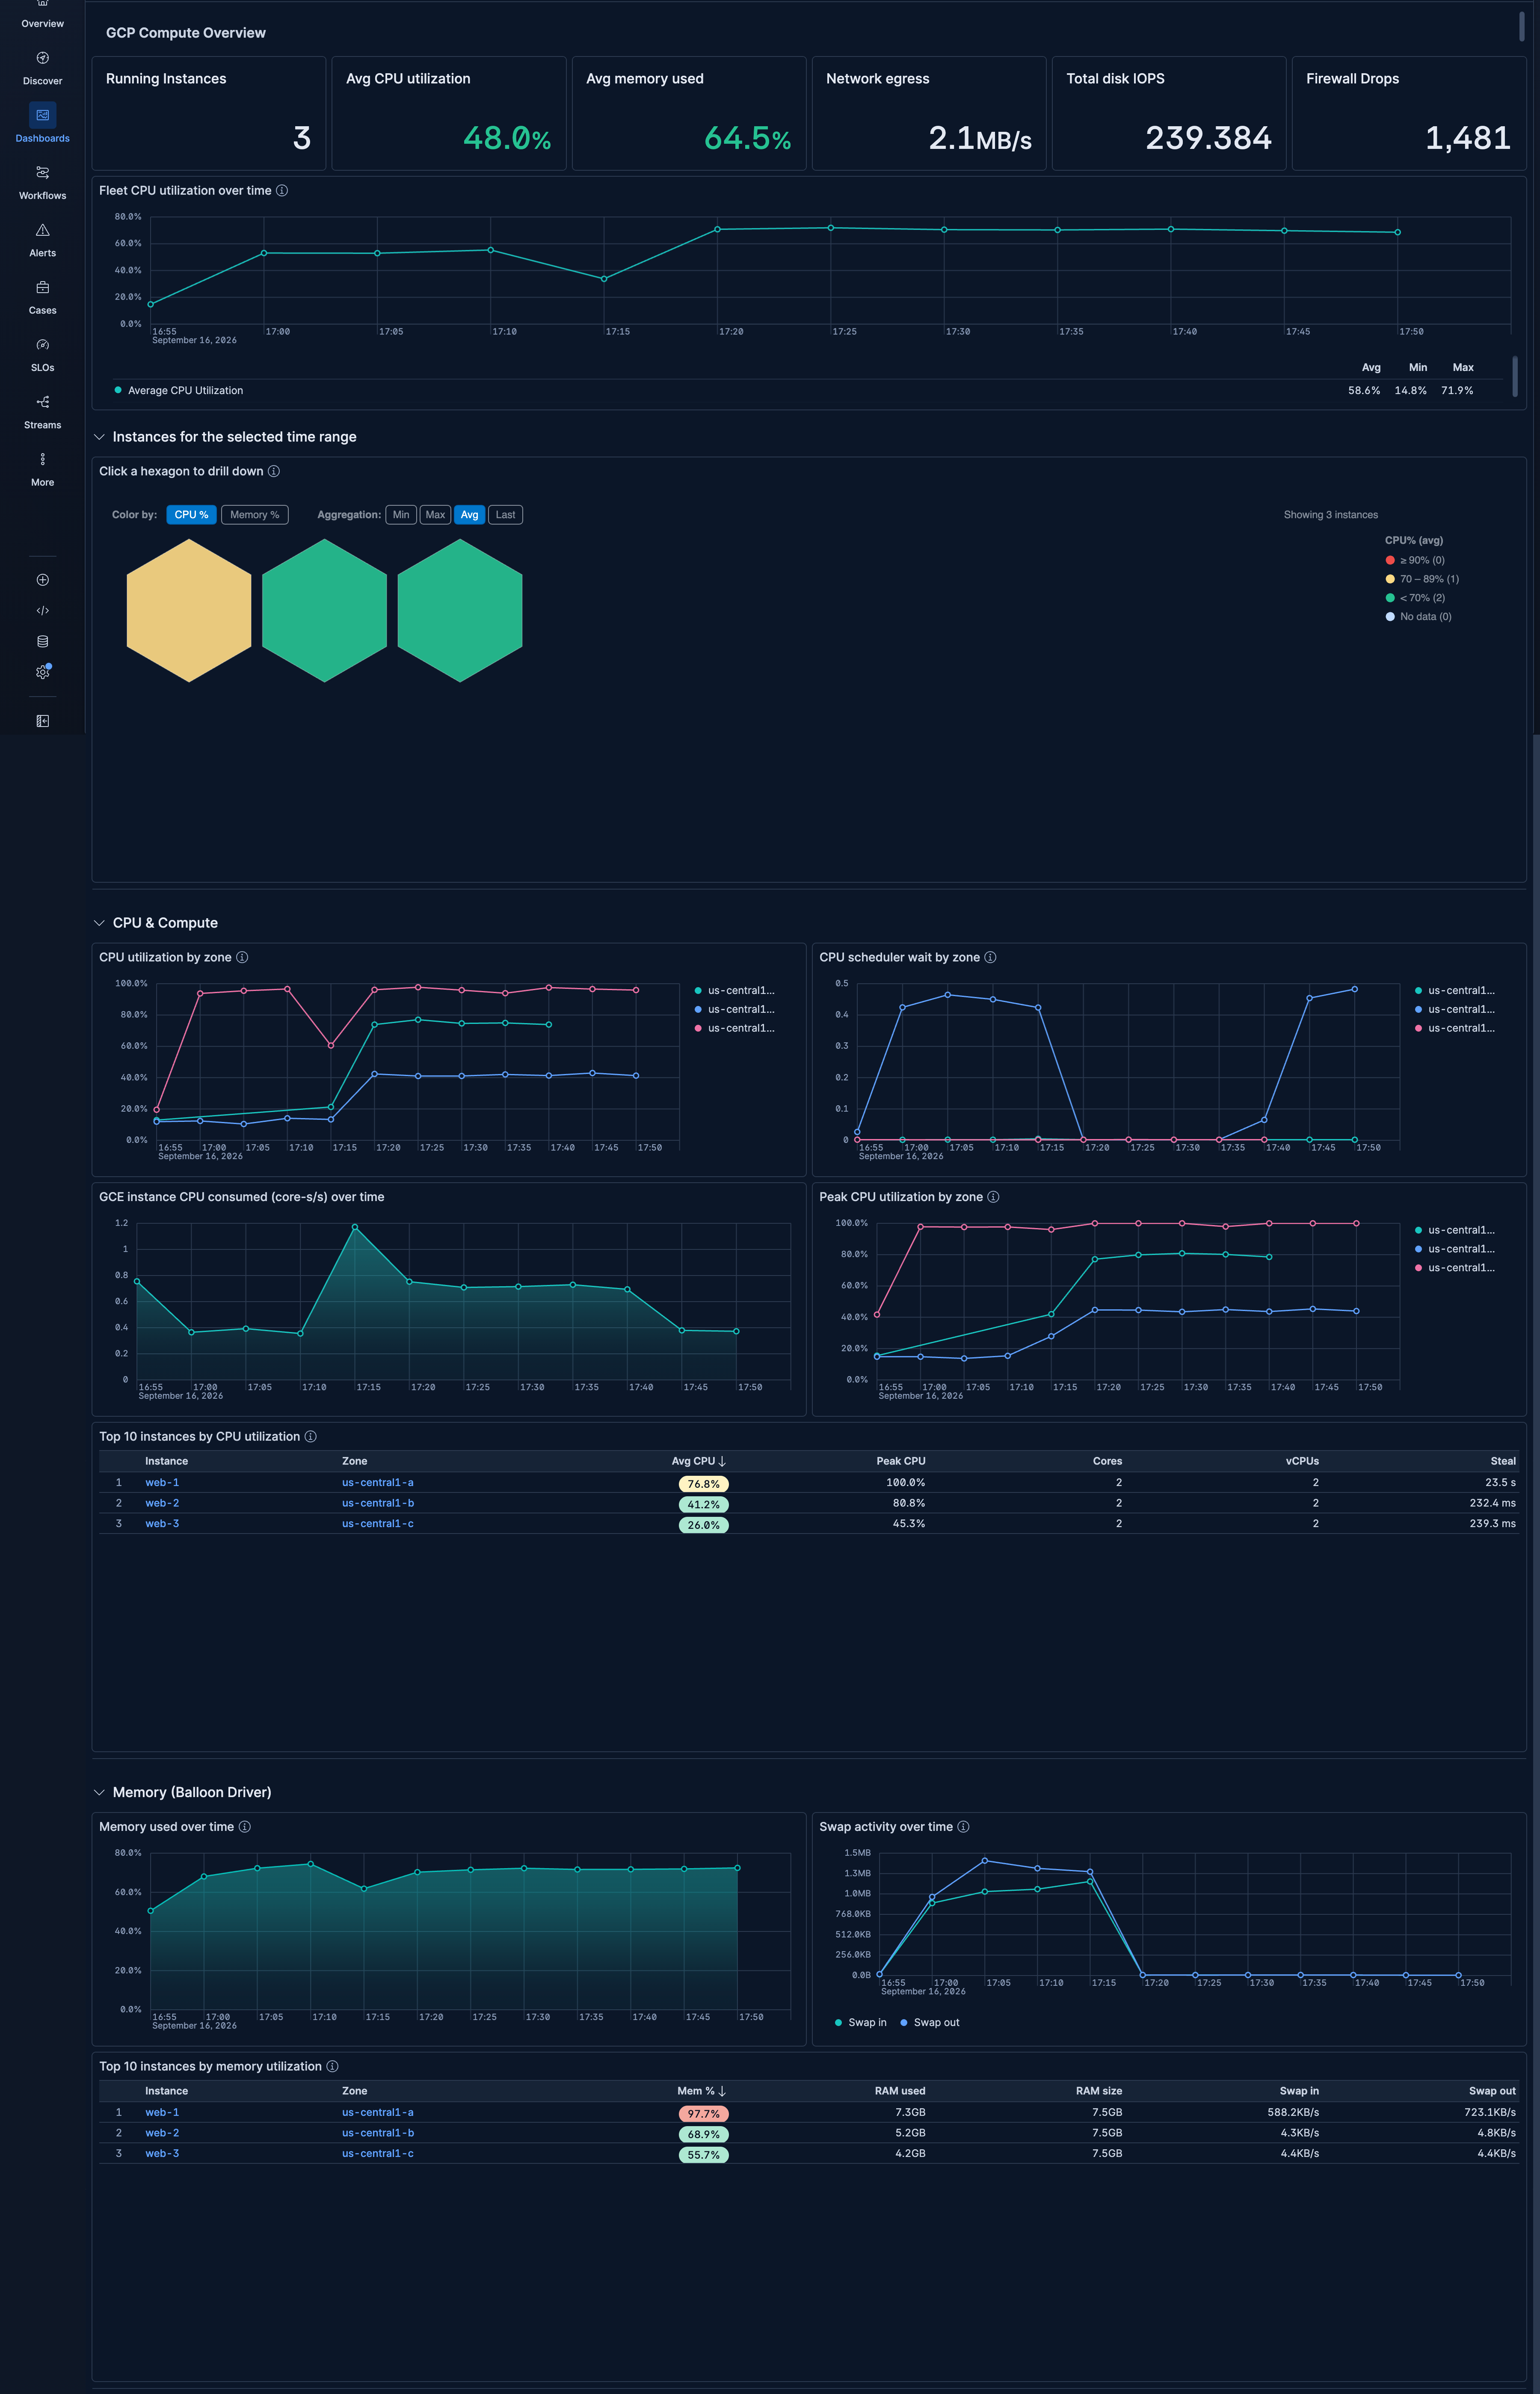
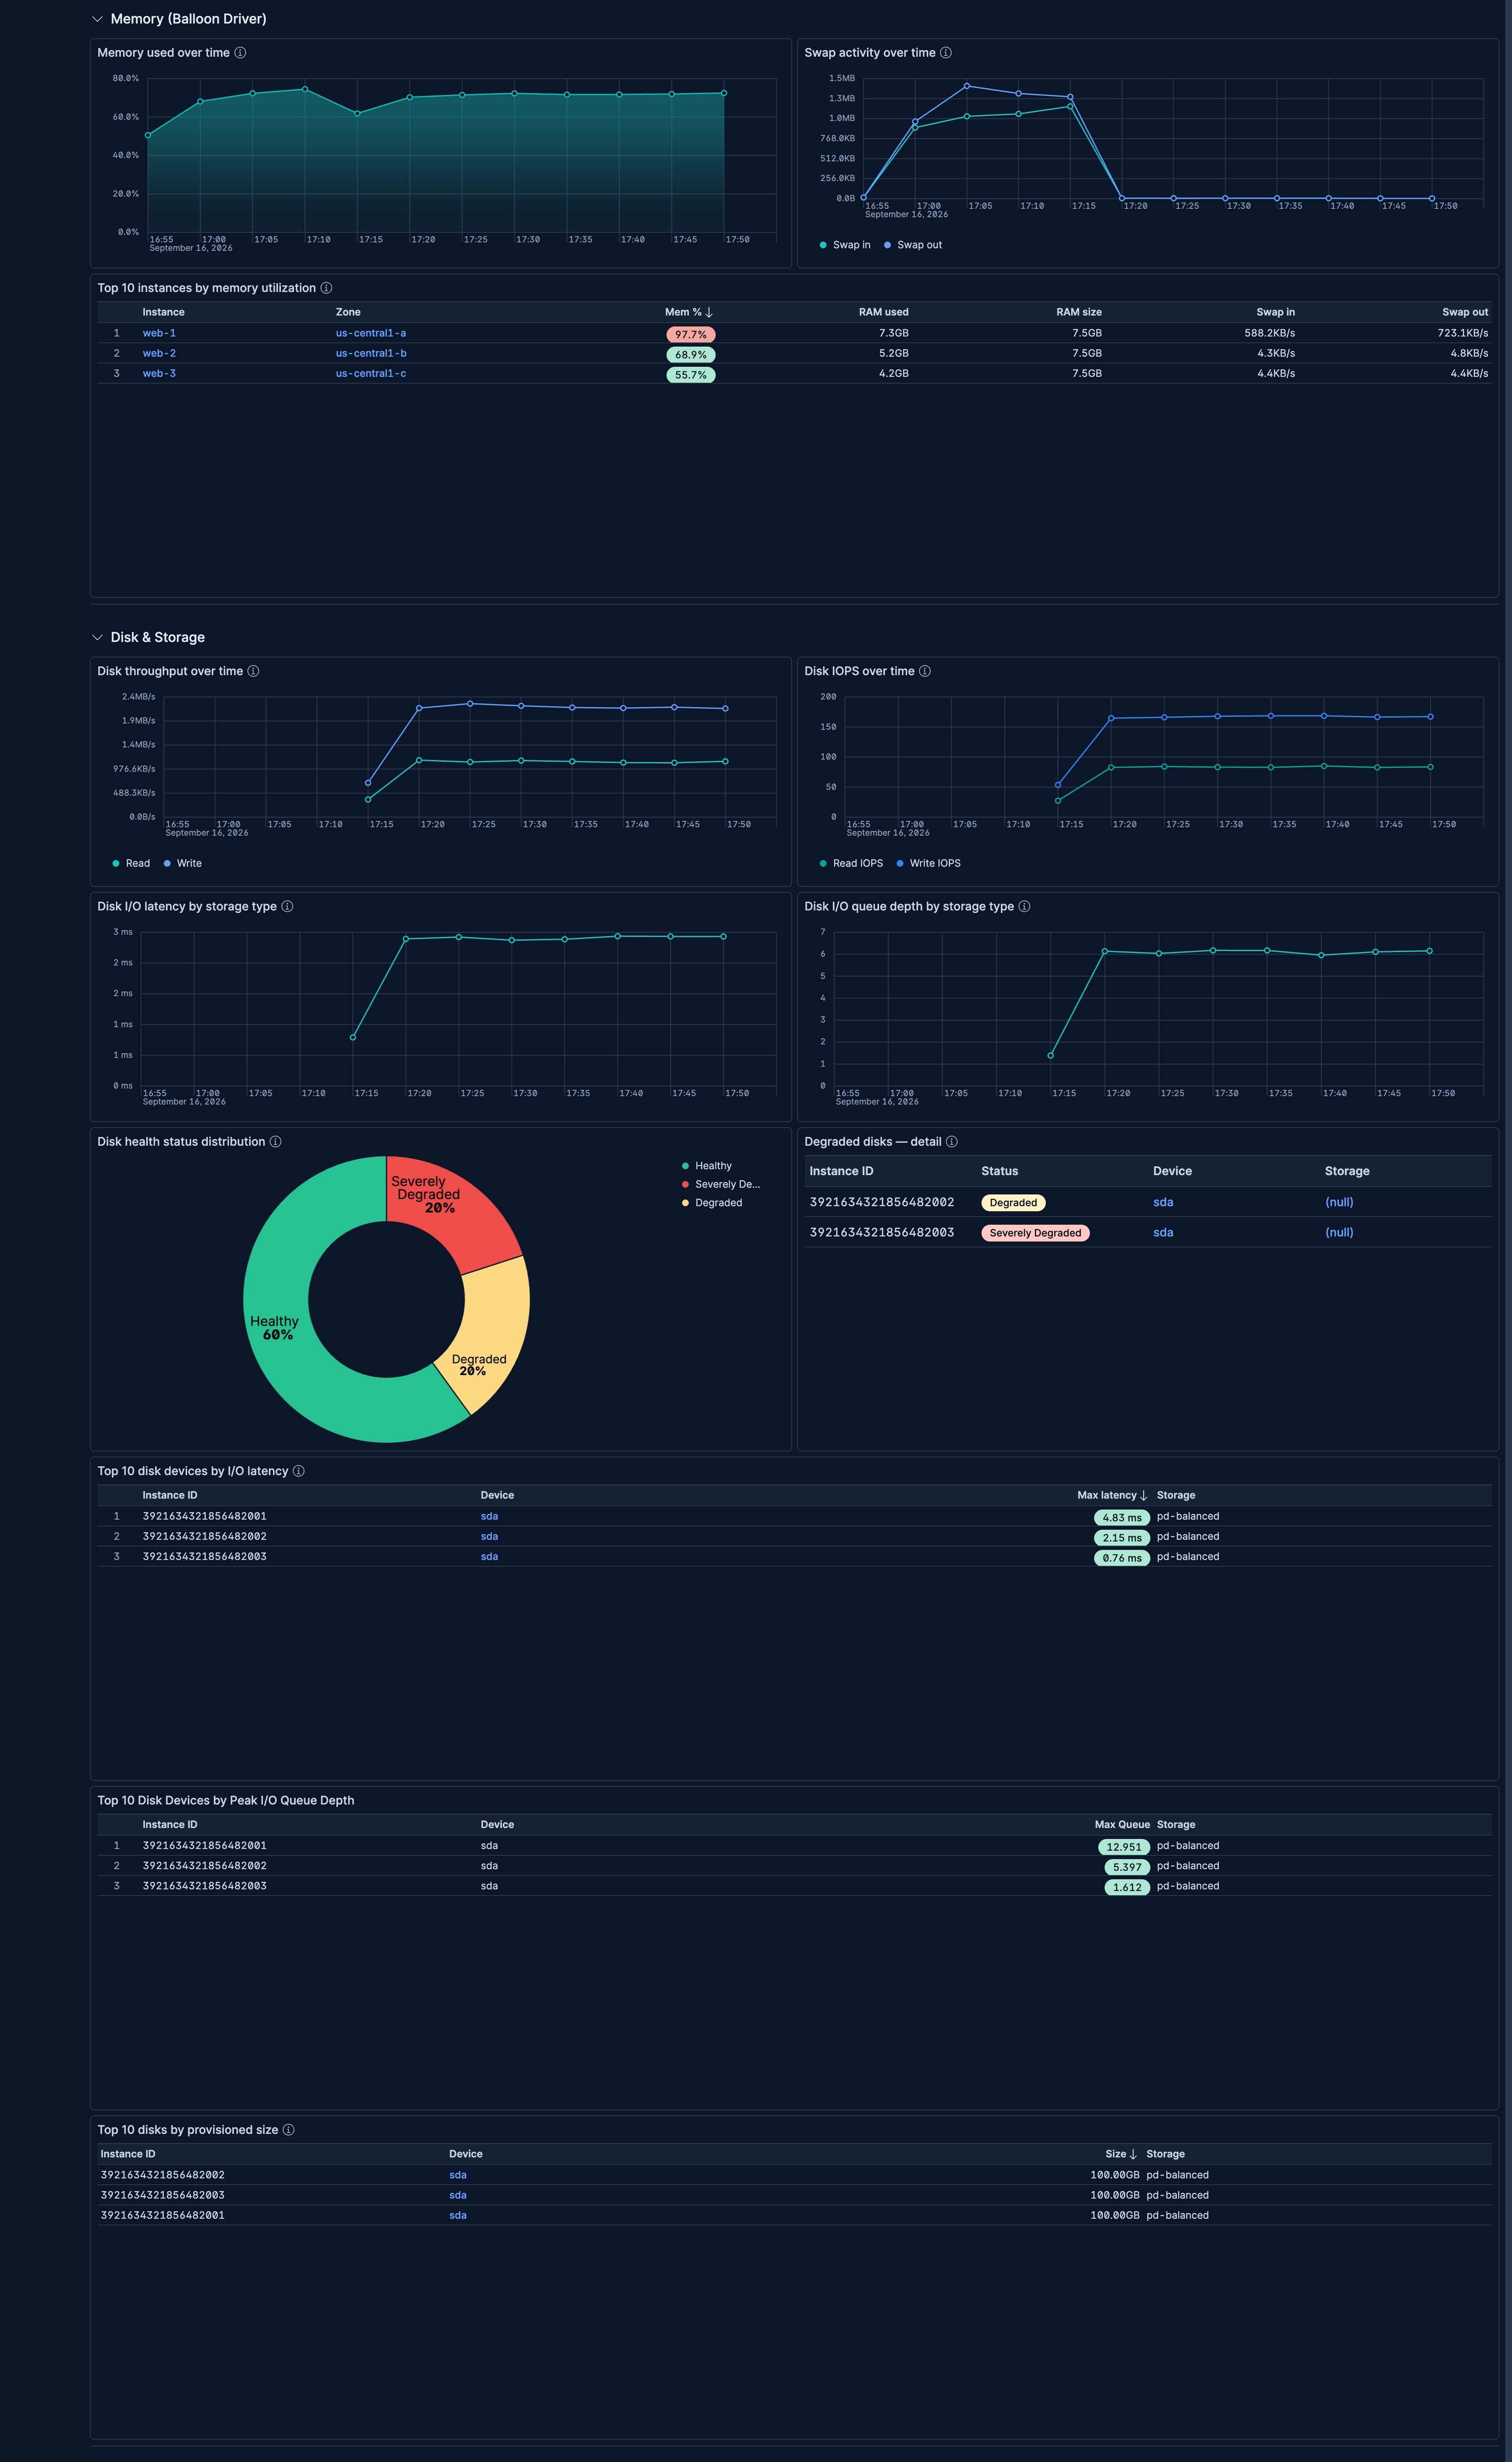
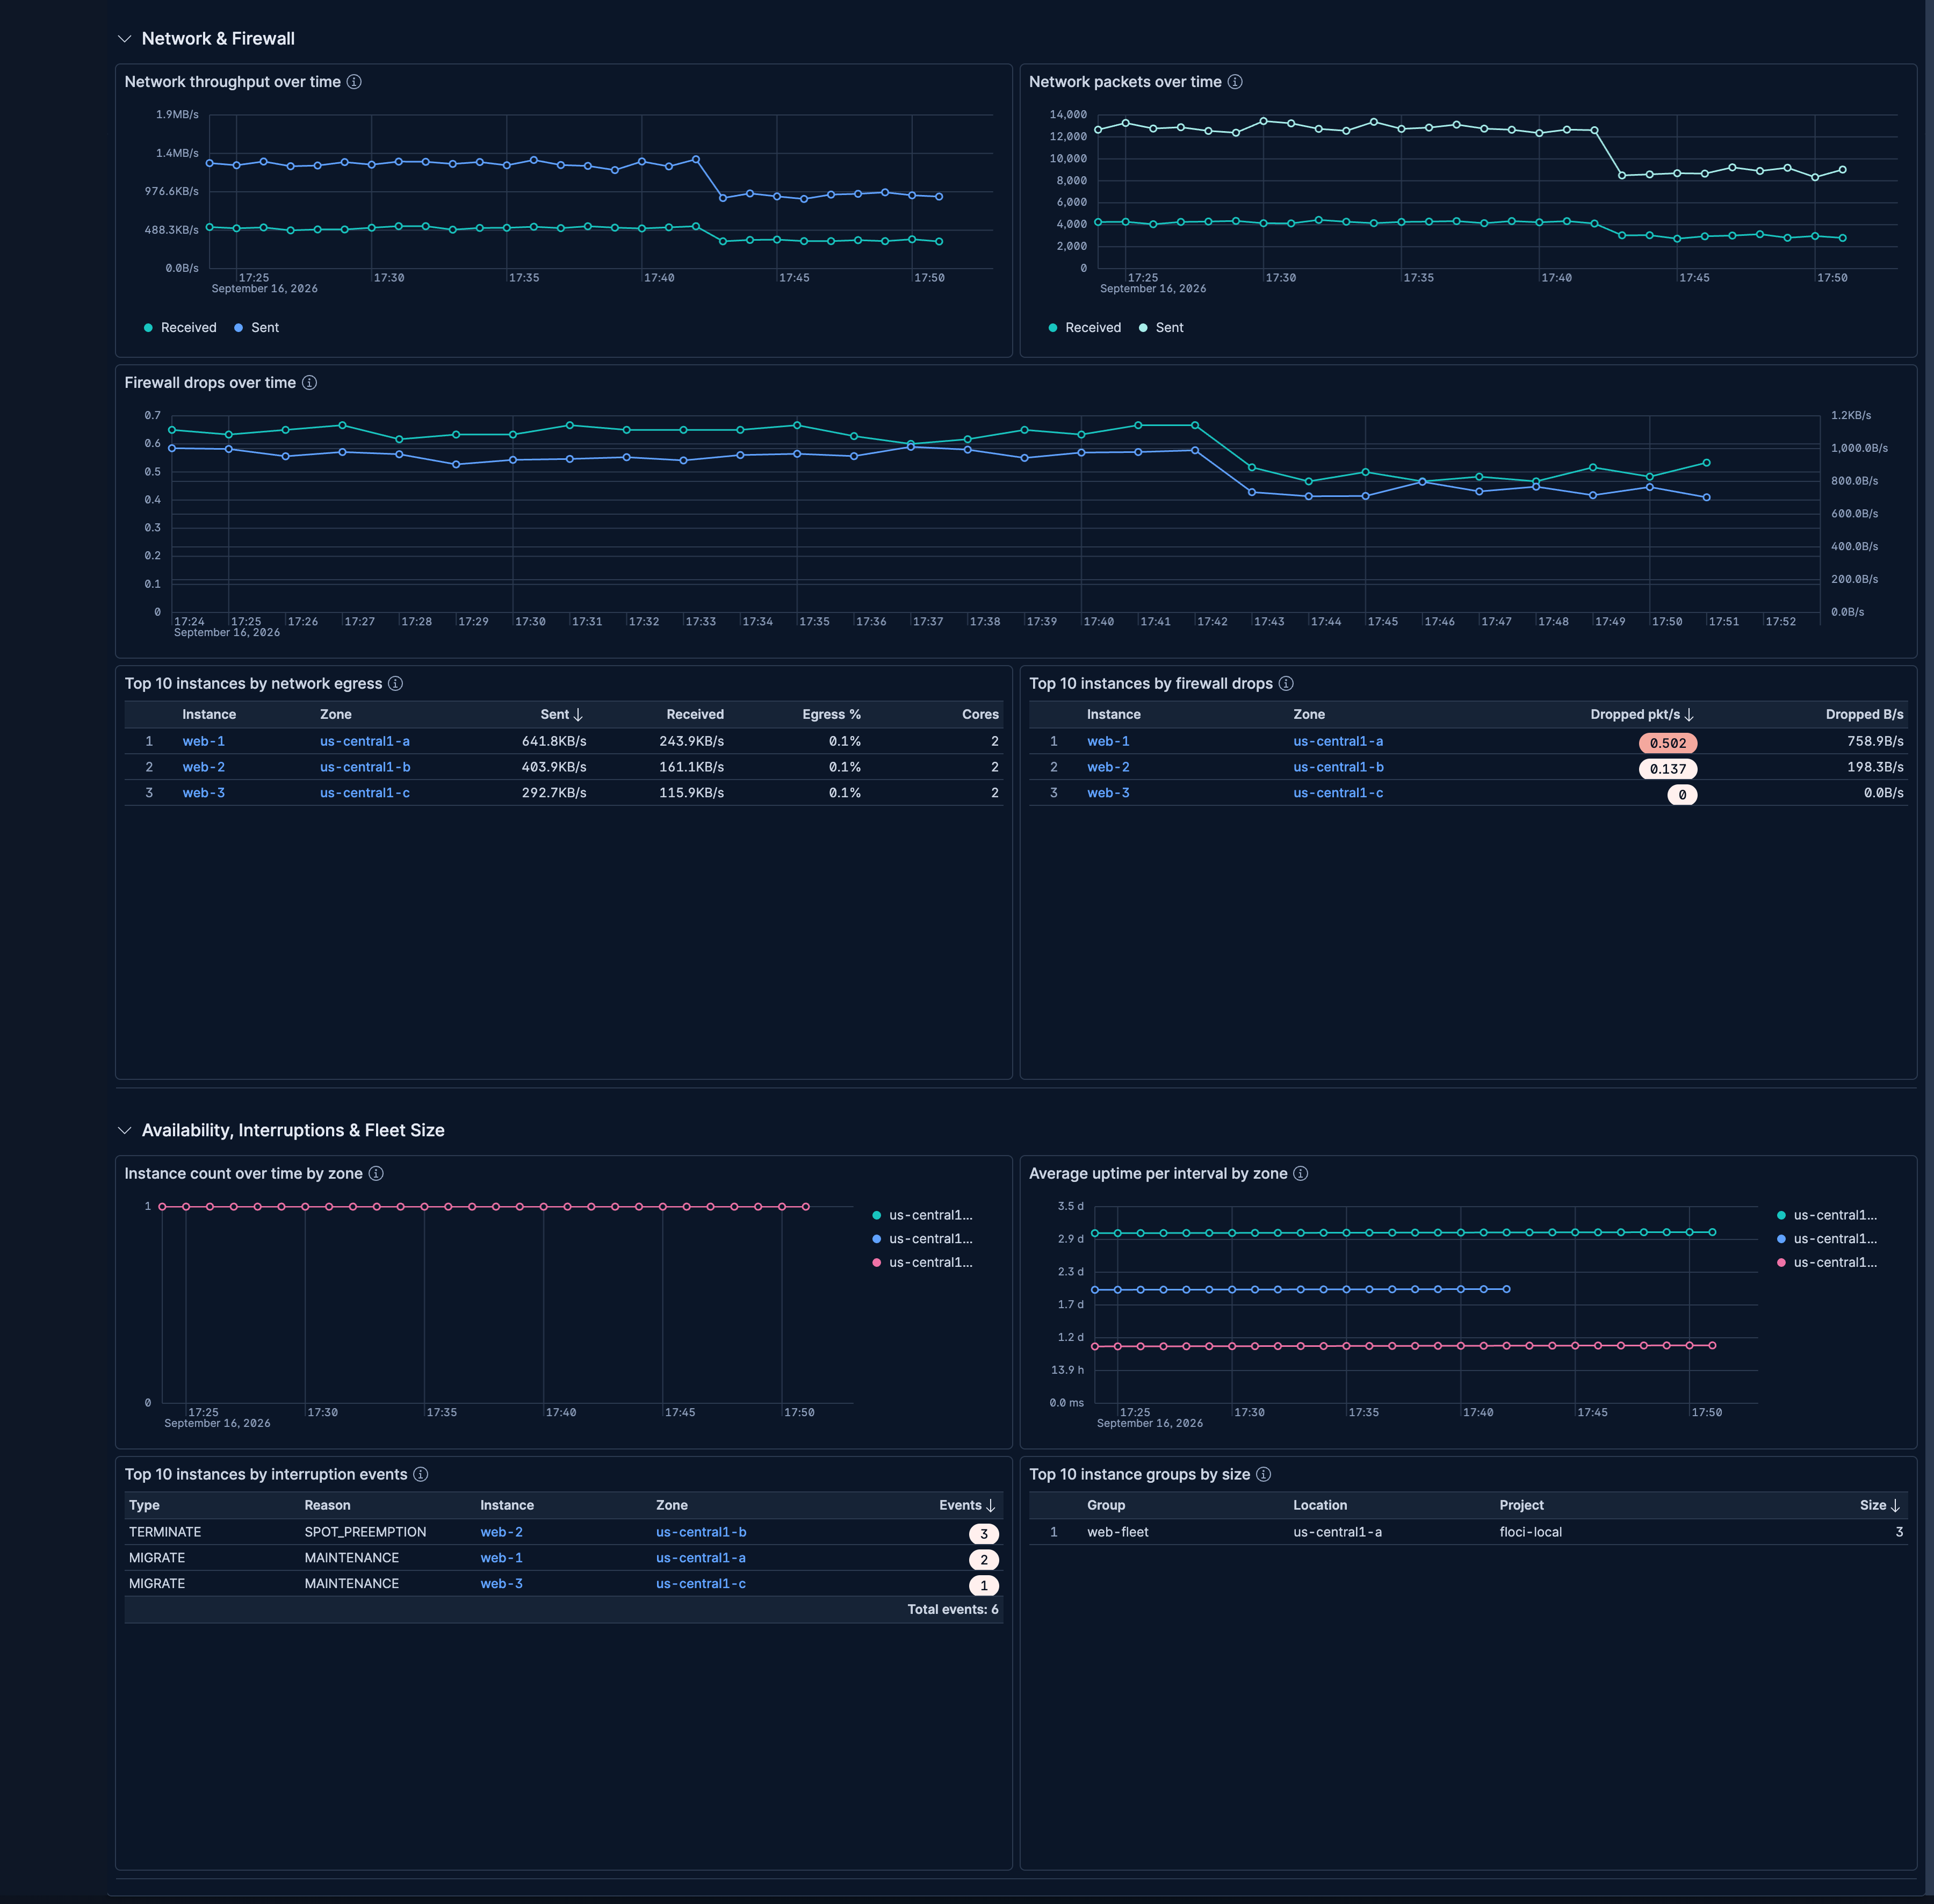
| [GCP Compute] Overview | Fleet-wide health overview covering CPU utilization, memory, swap, disk throughput, IOPS, latency, network, firewall drops, and instance availability across zones. |
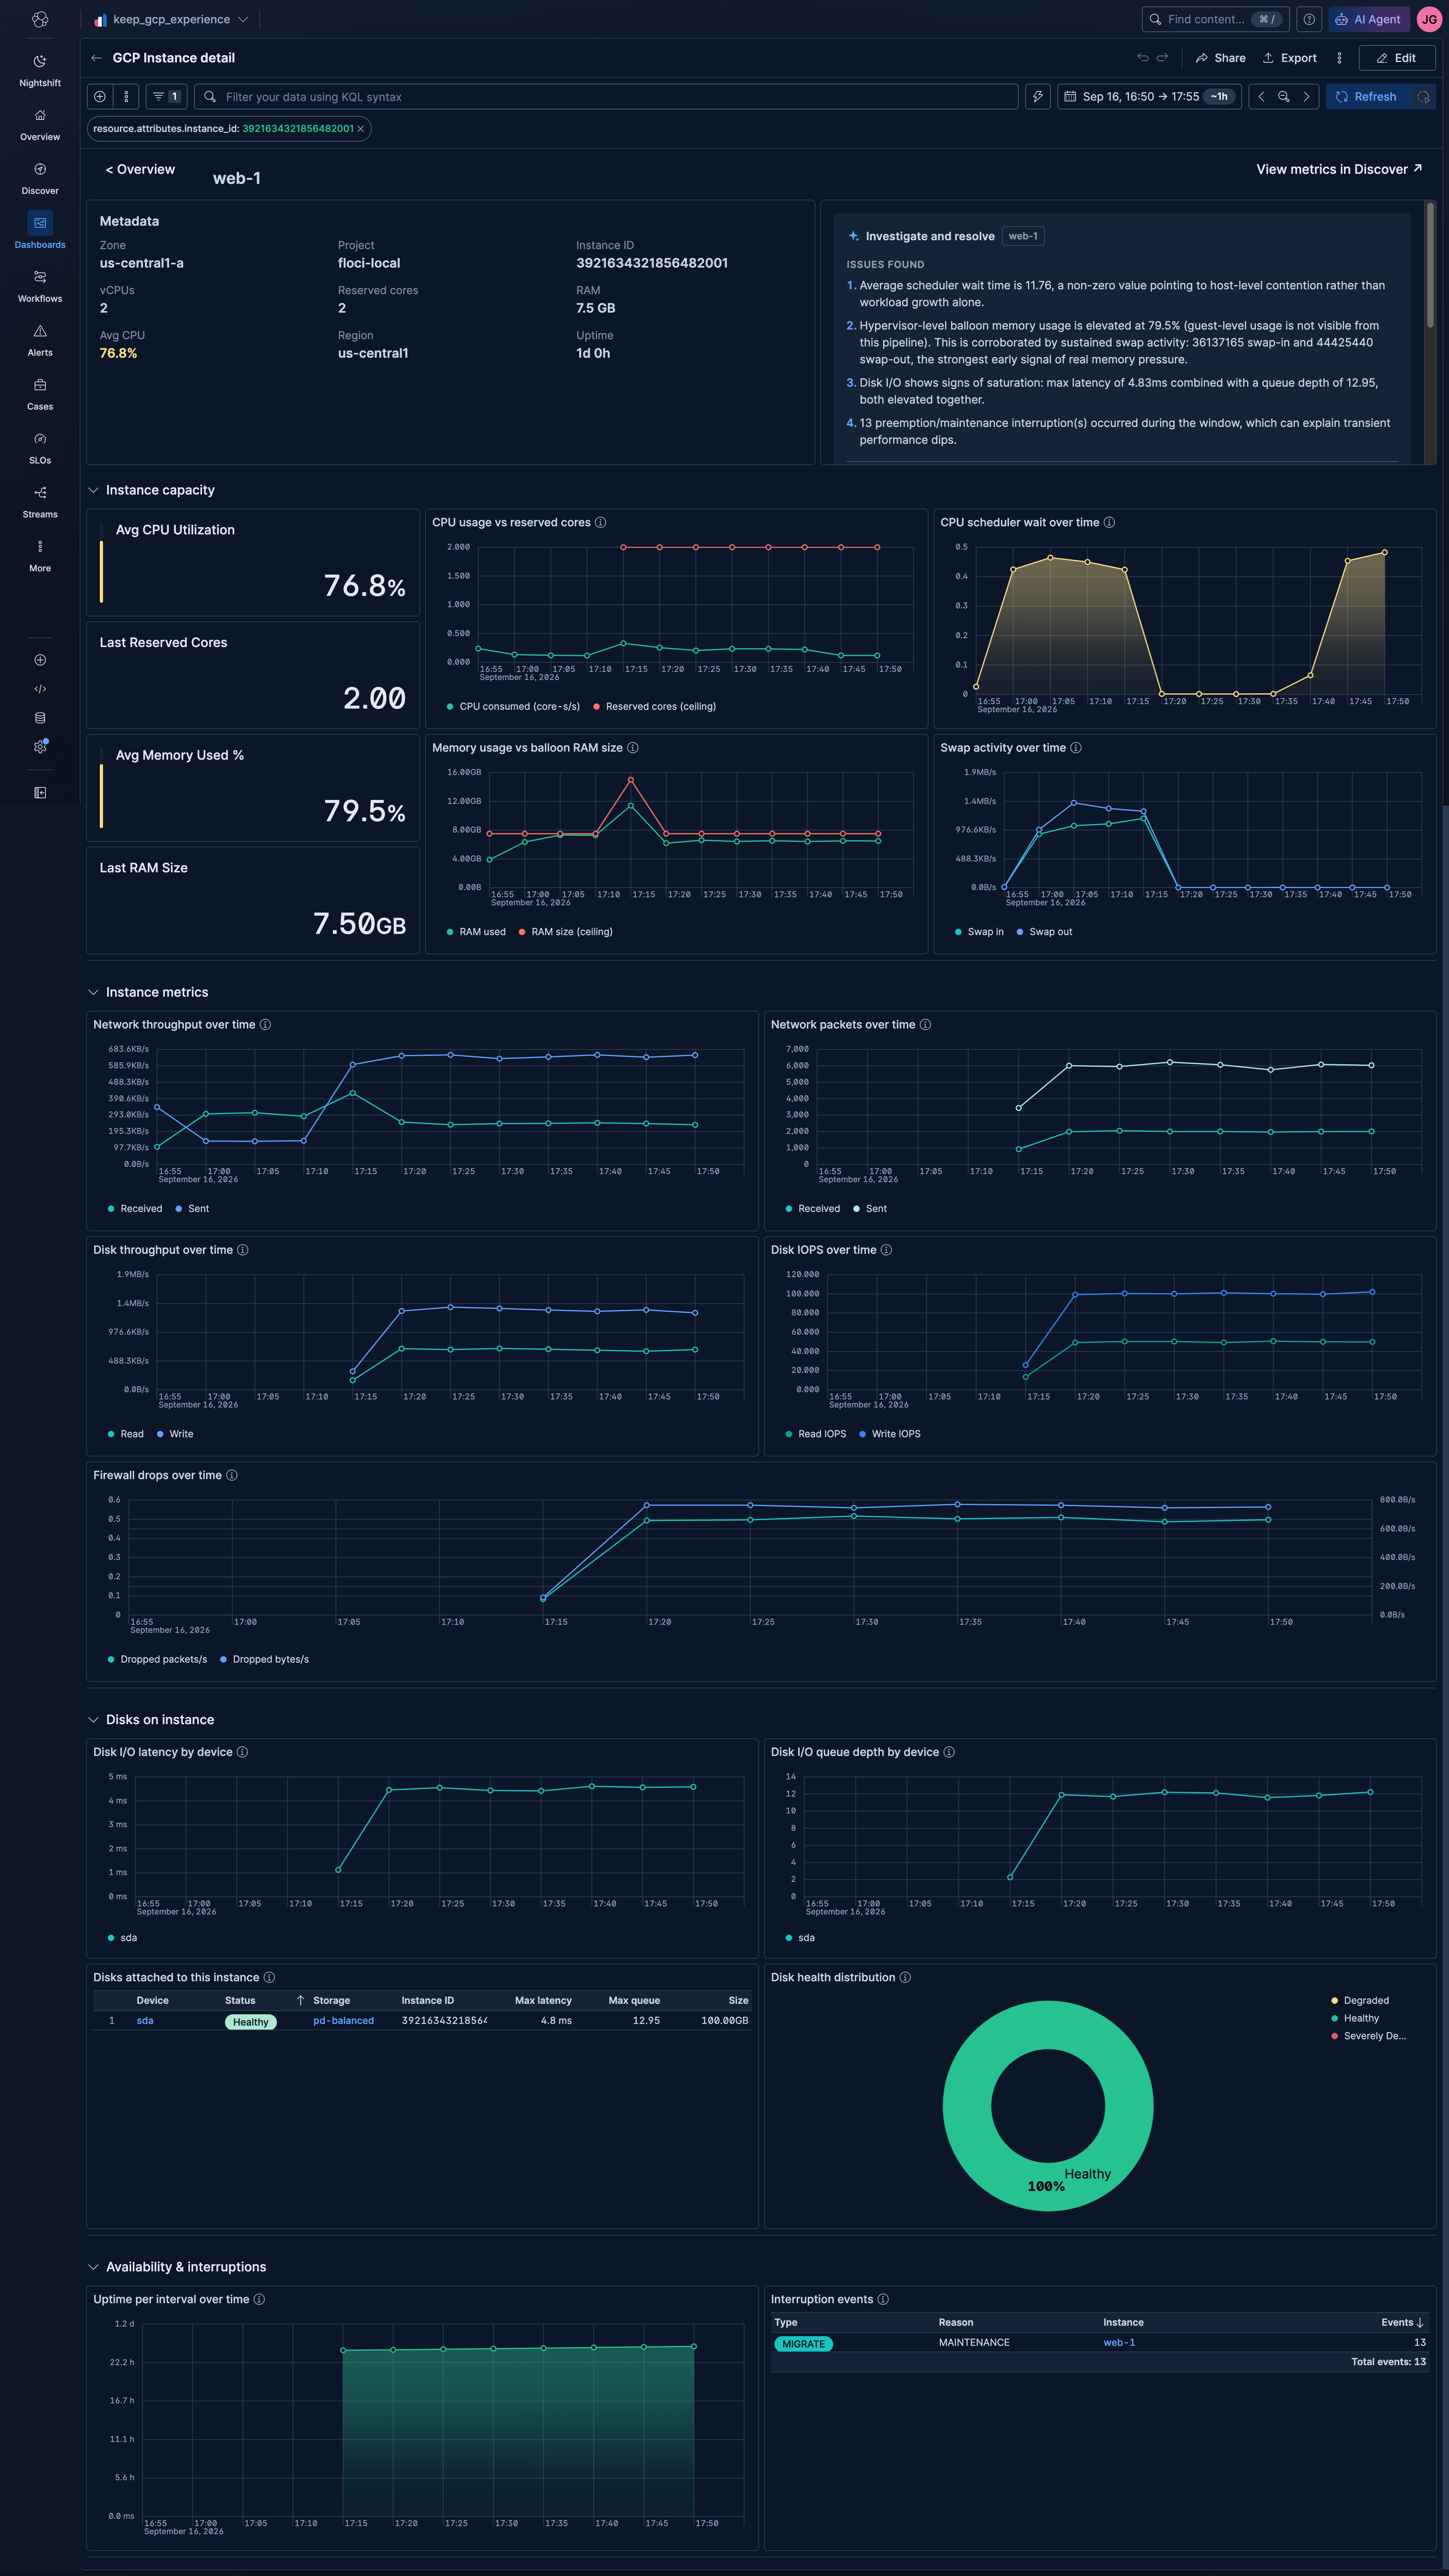
| [GCP Compute] GCE Instance Detail | Per-instance deep-dive into CPU, memory, swap, network throughput, disk throughput, IOPS, I/O latency, queue depth, disk health, uptime, and interruption events. |
This integration includes one or more Kibana dashboards that visualizes the data collected by the integration. The screenshots below illustrate how the ingested data is displayed.
Changelog
| Version | Details | Minimum Kibana version |
|---|---|---|
| 0.3.0 | Enhancement (View pull request) Add a "View in Google Console" row action to the instance tables, open "View metrics in Discover" in the same tab, chart network, disk, swap, firewall and CPU metrics on the overview and instance detail dashboards as totals per time bucket instead of per-second values that were inflated when instances started or stopped, count each interruption event once, and sort instances without memory data last in the memory utilization table. |
9.6.0 |
| 0.2.0 | Enhancement (View pull request) Improve overview dashboard header and navigation, align dashboard titles with the [GCP OTel] naming convention, open instance drilldowns in the same tab, fix scheduler wait axis formatting and limit zone charts to the top 10 zones. |
9.6.0 |
| 0.1.0 | Enhancement (View pull request) Initial draft of the GCP Compute Engine OpenTelemetry Assets package. |
9.6.0 |