Kibana connectors
These Kibana connectors are used to connect to external services for GenAI, alerting, and case management use cases.
To learn about connectors for syncing data to Elasticsearch for search use cases, refer to content connectors.
Connectors provide a central place to store connection information for services and integrations with Elastic or third-party systems.
If you're using connectors for alerting or case management, you can create rules and add actions that use connectors to send notifications when conditions are met.
Kibana provides connectors for LLM providers, Elastic Stack features, and third-party alerting and case management platforms.
Some connectors support Quick Connect OAuth 2.0, which lets you authorize access without registering your own OAuth app.
Access to connectors is granted based on your privileges to alerting-enabled features. For more information, go to Security.
Kibana provides the following connectors, grouped by category.
Generative AI
- AI Connector: Connect to third-party LLM services including Amazon Bedrock, Azure, Google Gemini, OpenAI, and Elastic Inference Service.
- Amazon Bedrock: Send a request to Amazon Bedrock.
- Elastic Managed LLMs: Send a request to Elastic Managed LLMs.
- Google Gemini: Send a request to Google Gemini.
- OpenAI: Send a request to OpenAI.
External MCP Server
- MCP: Connect to MCP servers and call their tools.
Elastic Stack
- Cases: Add alerts to Cases.
- Index: Index data into Elasticsearch.
- Observability AI Assistant: Send alerts to the AI Assistant.
- ServerLog: Add a message to a Kibana log.
Alerting and case management
- XSOAR: Create an incident in Cortex XSOAR.
- CrowdStrike: Send a request to CrowdStrike.
- D3 Security: Send a request to D3 Security.
- Email: Send email from your server.
- IBM Resilient: Create an incident in IBM Resilient.
- Jira: Create an incident in Jira.
- Jira Service Management: Create or close an alert in Jira Service Management.
- Microsoft Defender for Endpoint: Send requests to Microsoft Defender-enrolled hosts.
- Microsoft Teams: Send a message to a Microsoft Teams channel.
- Opsgenie: Create or close an alert in Opsgenie.
- PagerDuty: Send an event in PagerDuty.
- SentinelOne: Send a request to SentinelOne.
- ServiceNow ITSM: Create an incident in ServiceNow.
- ServiceNow ITOM: Create an event in ServiceNow.
- ServiceNow SecOps: Create a security incident in ServiceNow.
- Slack: Send a message to a Slack channel or user.
- Swimlane: Create an incident in Swimlane.
- TheHive: Create cases and alerts in TheHive.
- Tines: Send events to a Tines Story.
- Torq: Trigger a Torq workflow.
- Webhook: Send a request to a web service.
- Webhook - Case Management: Send a request to a Case Management web service.
- xMatters: Send actionable alerts to on-call xMatters resources.
Data and context sources
Third-party search
Amazon EKS: Discover EKS clusters and node groups, scale node groups, manage cluster access entries, and mint Kubernetes tokens.
Amazon S3: List and download content from AWS S3 buckets.
Ansible Control Server: Launch and monitor Ansible Automation Controller / AWX jobs.
Argo CD: Manage GitOps applications in Argo CD — sync, inspect health and resources.
AWS CloudWatch: List and suppress alarms, query metrics and Logs Insights, and retrieve log events from AWS CloudWatch.
AWS X-Ray: Retrieve X-Ray insights, service graphs, and trace summaries and details for distributed tracing.
Azure Blob Storage: List containers and blobs, and retrieve blob content from Azure Blob Storage.
Azure Functions: Invoke HTTP-triggered functions, read function keys, and start, stop, or restart function apps.
Azure Kubernetes Service (AKS): List, inspect, and manage AKS clusters and node pools.
Azure Monitor: List and triage alerts, query metrics and logs, and control alert rules in Azure Monitor.
Azure SQL: Query tables, search rows, explore schema, and execute SQL in an Azure SQL Database.
BigQuery: Run GoogleSQL queries and retrieve results from Google BigQuery.
Bitbucket: Open, review, comment on, and merge pull requests, create branches, report commit build statuses, and trigger pipelines in Bitbucket Cloud.
Box: Search files and folders, read content, and query enterprise content using Box AI.
Brave Search: Search the web using the Brave Search API.
Buildkite: Trigger, observe, retry, and cancel builds, unblock deploy gates, and post annotations.
Confluence Cloud: Search and retrieve Confluence Cloud pages and spaces using the REST API v2.
Databricks: Execute SQL queries, discover tables and schemas, and poll async query results in Databricks.
Datadog: List and mute monitors, manage downtimes and incidents, post events, query metrics and logs, and start a workflow from a monitor webhook.
Dropbox: Search files and folders, retrieve file content and metadata, and manage shared links in Dropbox.
Dynatrace: Triage Davis problems, ingest events, query metrics and entities, and manage maintenance windows.
Elasticsearch: Search, index, and manage documents, retrieve mappings and aliases, and run ES|QL queries in Elasticsearch.
Firecrawl: Scrape, search, map, and crawl the web using the Firecrawl API.
Figma: Browse design files, inspect structure, render nodes as images, and explore team projects in Figma.
GitHub: Search code, issues, and pull requests, access repository contents and metadata, and start a workflow from repository webhooks.
GitLab: Search projects, manage issues and merge requests, browse repository files, and trigger CI/CD pipelines in GitLab.
Gmail: Search, read, label, quarantine, and send emails in Gmail.
Google Calendar: Search and access events and calendars in Google Calendar.
Google Cloud Monitoring: Find, silence, and snooze GCP alerting policies, and enrich alerts with metric, uptime, and SLO data.
Google Cloud Storage: Search and access objects in Google Cloud Storage buckets.
Google Drive: Search and access files and folders in Google Drive.
Google Kubernetes Engine: List clusters and node pools, scale and autoscale node pools, upgrade, roll back, and harden GKE clusters, and track the resulting operations.
Grafana: Read alerts and rules, manage silences, and post annotations.
GraphQL: Run queries and mutations, and introspect schemas on any GraphQL endpoint.
HubSpot: Search and retrieve contacts, companies, deals, and tickets from HubSpot CRM.
Jenkins: Trigger, monitor, and stop Jenkins builds, and manage jobs, test reports, and the build queue.
Jina Reader: Convert web pages into markdown from their URL and search the web for better LLM grounding.
Jira Cloud: Search issues with JQL, retrieve project and issue details, and look up users in Jira Cloud.
Kubernetes: Read and modify resources in a Kubernetes cluster through its REST API.
Microsoft Teams: Search messages and browse teams, channels, and chats in Microsoft Teams, and start a workflow from channel, chat, and team events.
Monday.com: Search boards, read and create items, post updates, and manage workspaces in Monday.com.
MongoDB: Query MongoDB collections using find, aggregate, count, and listCollections, and write with insertOne, updateOne, and deleteOne in workflows.
MySQL: Query tables, search rows, explore schema, and execute SQL in a MySQL database.
New Relic: Acknowledge and resolve AI issues, manage muting rules, and run NRQL queries.
Notion: Explore content and databases in Notion.
OneDrive: Search files and folders, browse drives, read file content, and list files shared with you in Microsoft OneDrive.
OpenSearch: Acknowledge and search alerts, run and manage monitors, handle Security Analytics detector alerts, and search and index documents.
Outlook: Search emails, list folders, and read messages and attachments in Microsoft Outlook.
PagerDuty: Access and manage incidents, escalation policies, schedules, on-calls, users, and teams in PagerDuty.
PostHog: Triage error-tracking issues, run HogQL queries, and control feature flags.
Prometheus: Run PromQL queries, and read, silence, and manage alerts and alert groups in Alertmanager.
Rootly: Declare and drive incidents through their lifecycle.
Salesforce: Query and retrieve data from your Salesforce org using SOQL and the REST API.
Sentry: Triage Sentry issues and provision issue alert rules.
ServiceNow: Search and retrieve records from ServiceNow, and start a workflow from incident, journal, and change-approval events.
You can also read, create, update, and delete records, incidents, and events in ServiceNow. SharePoint online: Search across SharePoint sites, pages, and content using the Microsoft Graph API.
SharePoint Server: Search and retrieve documents, list items, folders, and site pages from an on-premises SharePoint Server instance.
Slack (v2): Search and send messages in Slack, and start a workflow from Slack events.
Snowflake: Query Snowflake, discover databases, schemas, tables, and views, and run semantic searches through Cortex Search.
SolarWinds Platform: Run SWQL queries, list, read, and acknowledge active alerts, and look up nodes.
Tavily: Search the web and extract content from web pages.
Trello: Search boards, lists, and cards, create and update cards, and post comments in Trello.
UniFi: Inventory UniFi Network sites, devices, clients, and networks, inspect UniFi Protect cameras and sensors, and restart devices or authorize guests.
Workday: Access Workday HR data across workers, org structure, time off, recruiting, and holidays.
Zabbix: Triage problems, manage maintenance windows, and enable or disable hosts and triggers.
Zendesk: Search and retrieve Zendesk tickets, users, organizations, and Help Center articles using the Zendesk API.
Zoom: Access Zoom meetings, recordings, transcripts, and participants.
Identity management
- 1Password: Manage users in 1Password Enterprise Password Manager — list, get, suspend, and reactivate users.
- Okta: Contain compromised identities — suspend users, revoke sessions, reset MFA, manage group membership, and query System Log events.
- Google Cloud IAM: Disable service accounts, revoke leaked keys, and grant or revoke IAM role bindings.
- Google Cloud Secret Manager: Inspect secrets, add and disable secret versions, and read access policy.
Email security
- Sublime Security: Search flagged email, get verdicts, and quarantine, trash, or restore message groups in Sublime Security.
Threat intelligence
- AbuseIPDB: Check IP reputation and report abusive IPs.
- AlienVault OTX: Retrieve community-driven threat intelligence.
- Censys: Enrich hosts, web properties, and certificates, submit assets for rescanning, and run CensEye threat-hunting jobs.
- Google Threat Intelligence: Search threat collections and IOC streams, enrich IP, domain, URL, and file indicators, and scan URLs.
- GreyNoise: Detect and classify Internet scanning noise.
- MISP: Search attributes and events, check indicators and warninglists, and write sightings, events, attributes, and tags back to MISP.
- Shodan: Perform Internet-wide asset discovery and vulnerability scanning.
- ThreatQ: Search and enrich intelligence, update indicators, link objects, and run operations.
- URLScan.io: Search historical URL scans, detonate a URL in a sandboxed browser, and retrieve verdicts, screenshots, and page content.
- URLVoid: Check domain and URL reputation using multi-engine scanning.
- VirusTotal: Perform file scanning, URL and domain analysis, result retrieval, and threat intelligence lookups.
Some connector types are paid commercial features, while others are free. For a comparison of the Elastic subscription levels, go to the subscription page.
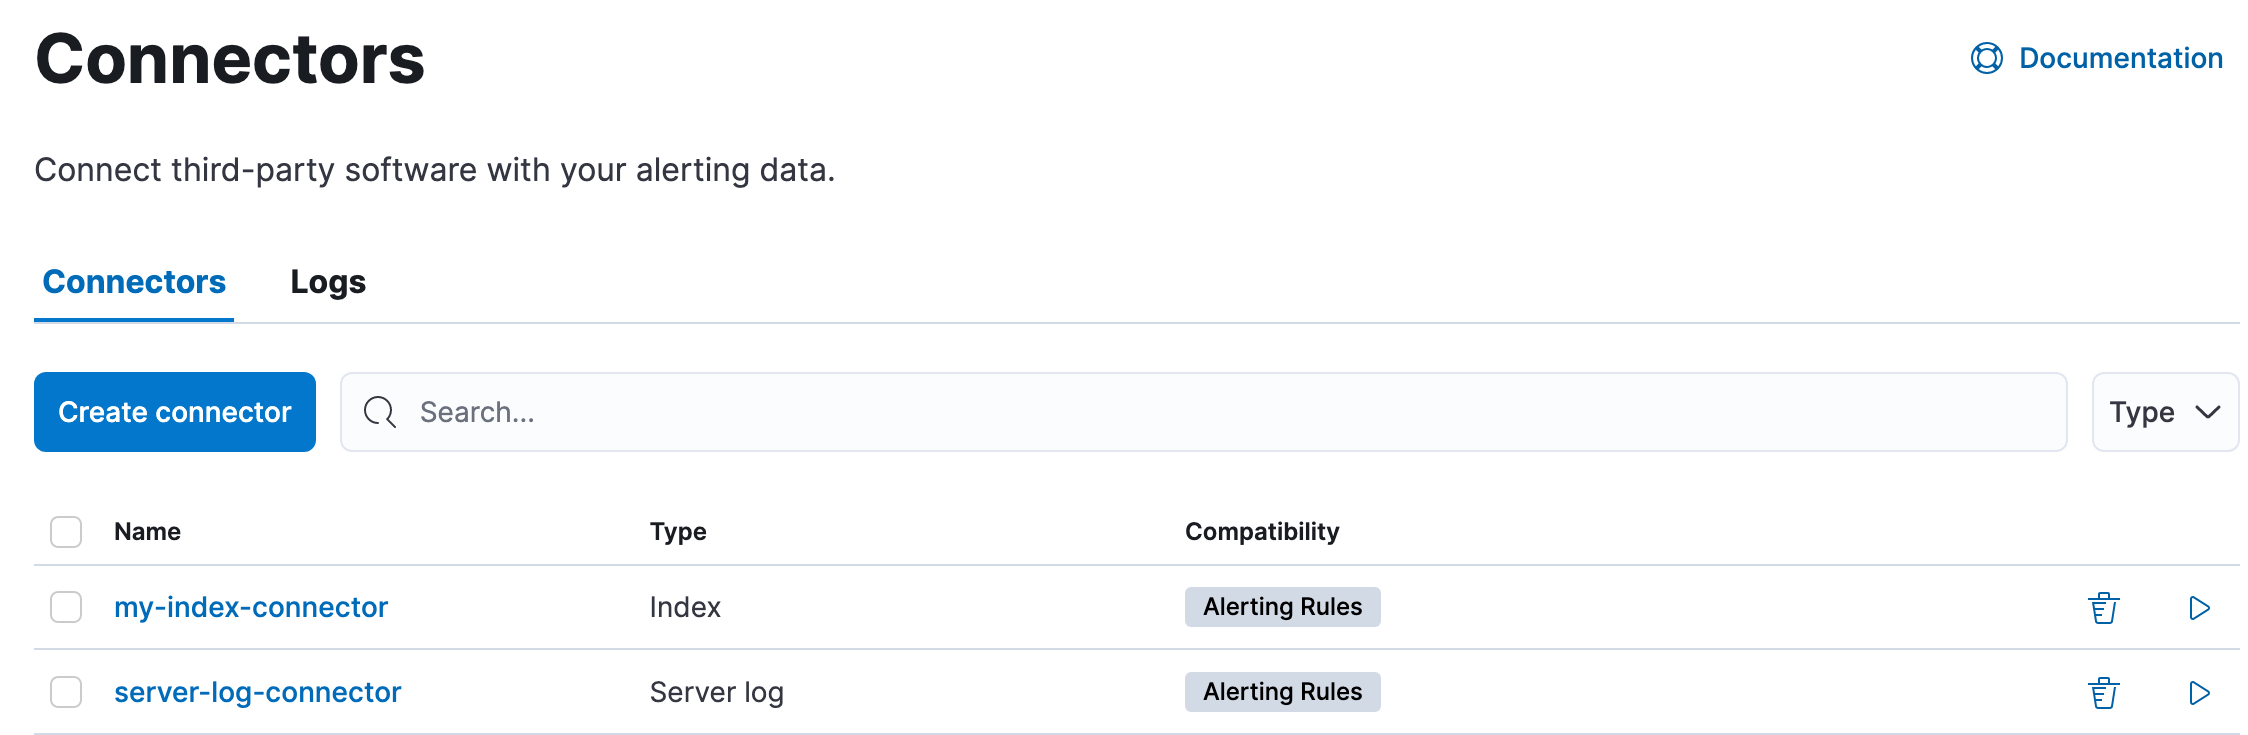
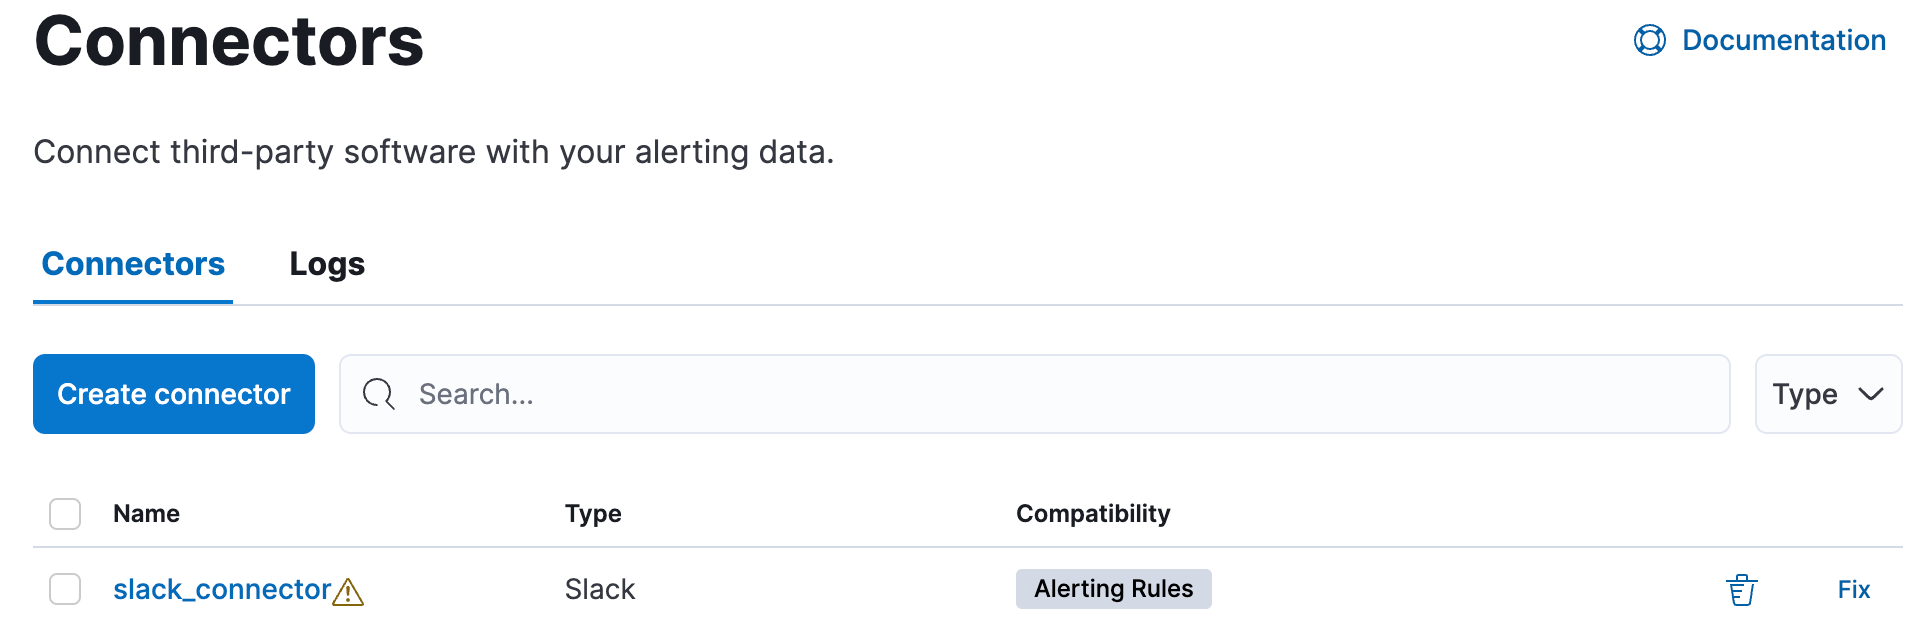
In Stack Management > Connectors, you can find a list of the connectors in the current space. You can use the search bar to find specific connectors by name and type. The Type dropdown also enables you to filter to a subset of connector types.

You can delete individual connectors using the trash icon. Alternatively, select multiple connectors and delete them in bulk using the Delete button.
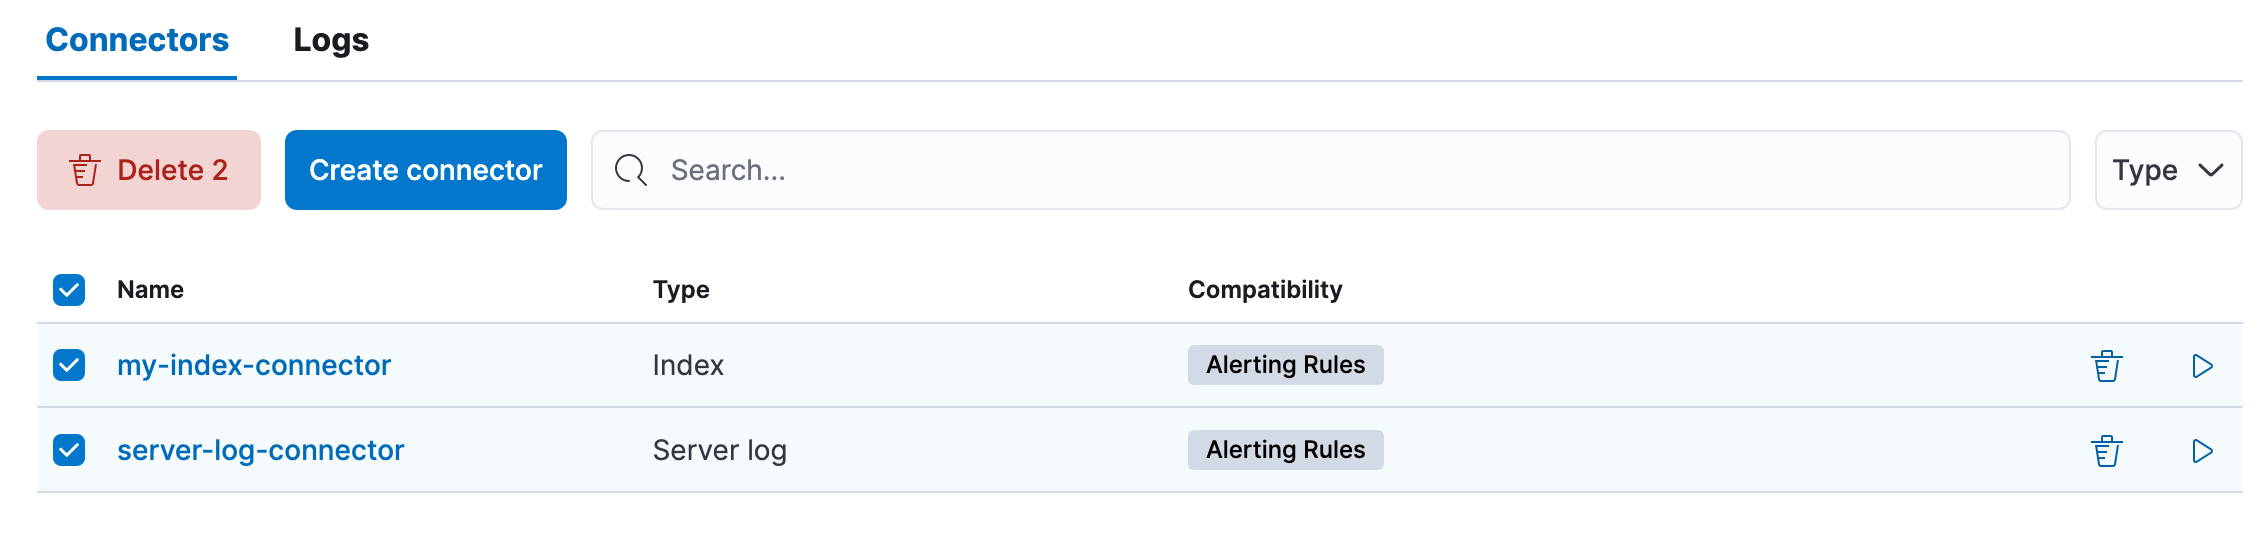
You can delete a connector even if there are still actions referencing it. When this happens the action will fail to run and errors appear in the Kibana logs.
New connectors can be created with the Create connector button, which guides you to select the type of connector and configure its properties.
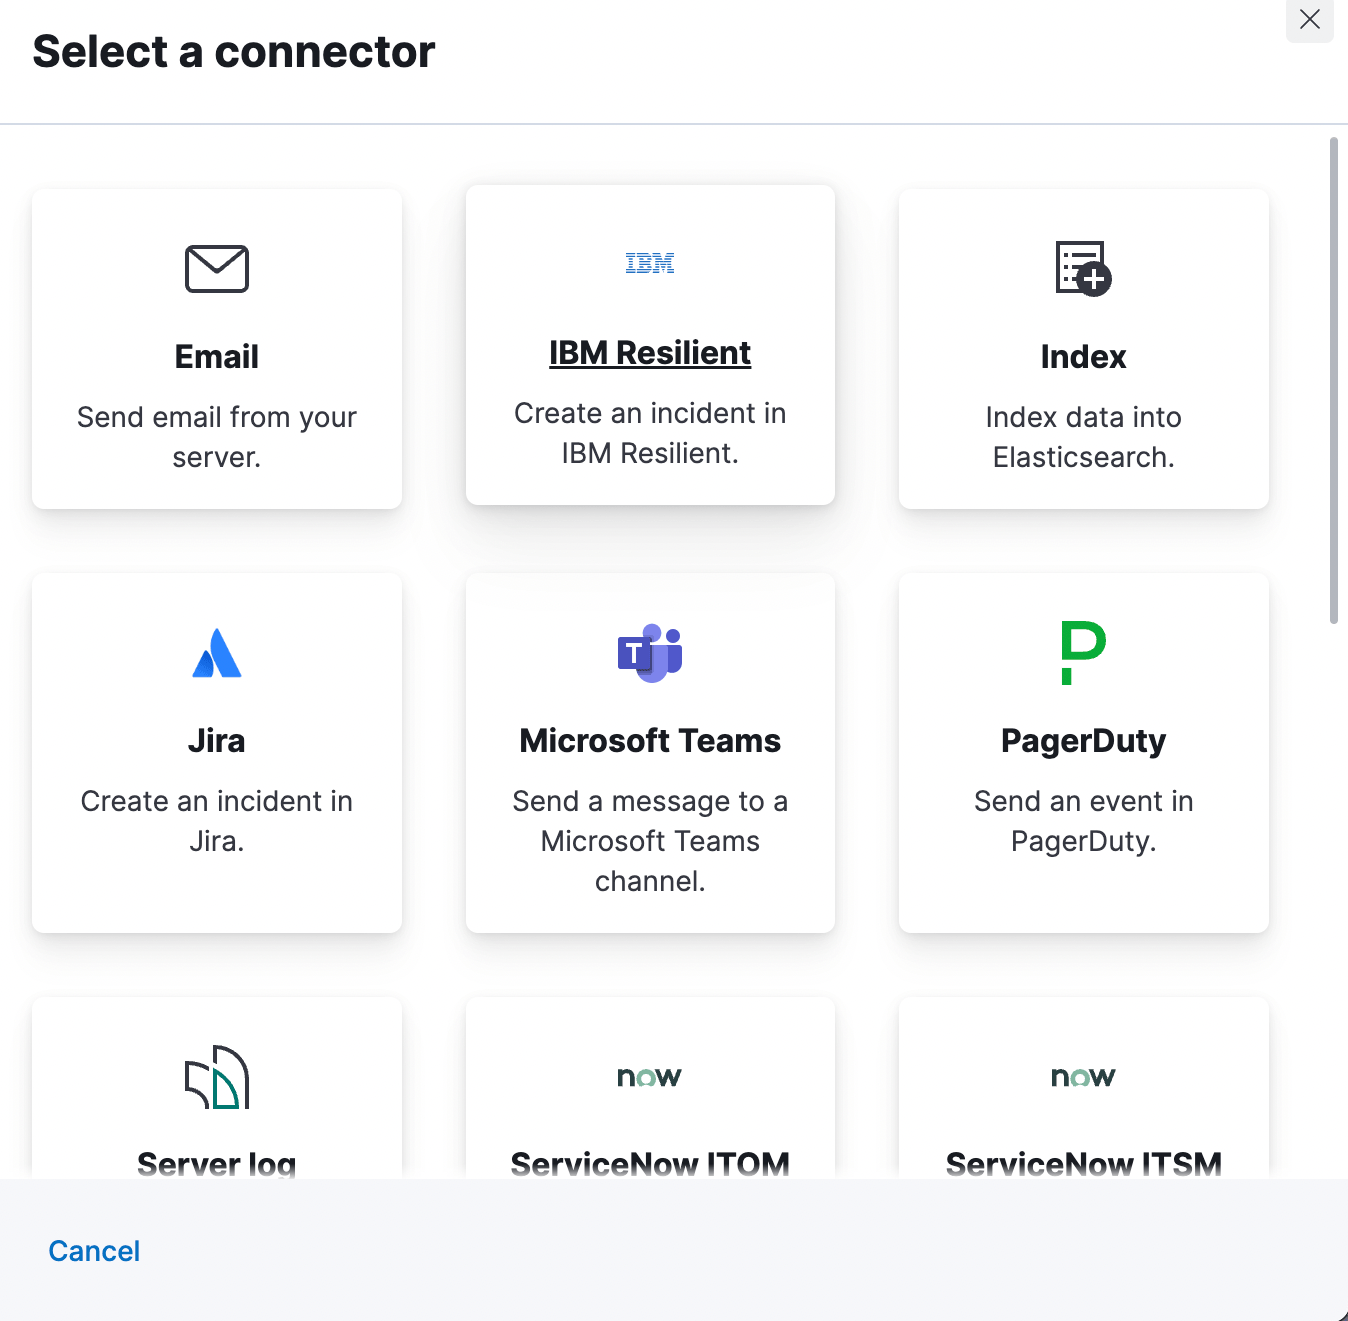
After you create a connector, it is available for use any time you set up an action in the current space.
For out-of-the-box and standardized connectors, refer to preconfigured connectors.
You can also manage connectors as resources with the Elasticstack provider for Terraform. For more details, refer to the elasticstack_kibana_action_connector resource.
When you create a connector, you set a Connector name (the display name in Kibana) and a Connector ID (the stable identifier used by APIs and integrations). Kibana suggests a connector ID by slugifying the connector name. It produces a value that uses only lowercase letters, numbers, and hyphens, then truncates it to at most 36 characters if needed. Spaces and most other characters become hyphens. You can edit that suggestion before you save.
The Connector ID must be unique among connectors available in the current Kibana space, including preconfigured connectors. After you save the connector, the connector ID cannot be changed. To use a different ID, create a new connector with the same type and configuration, choose the new ID, then update rules and other integrations to reference that connector.
To create a connector with the API, use Create a connector. Send POST /api/actions/connector (or POST /s/<space_id>/api/actions/connector outside the default space) to let Kibana generate an ID, or include the desired ID in the path: POST /api/actions/connector/<connector_id>. Custom IDs must follow the same rules as in the UI. They can only be 1–36 characters, and must use lowercase letters, numbers, and hyphens only.
Rules use connectors to route actions to different destinations like log files, ticketing systems, and messaging tools. While each Kibana app can offer their own types of rules, they typically share connectors. Stack Management > Connectors offers a central place to view and manage all the connectors in the current space.
If you are running Kibana on-prem, you can preconfigure a connector to have all the information it needs prior to startup by adding it to the kibana.yml file. Refer to preconfigured connectors for more information.
Use the action configuration settings to customize connector networking configurations, such as proxies, certificates, or TLS settings. You can set configurations that apply to all your connectors or use xpack.actions.customHostSettings to set per-host configurations.
To import and export connectors, use the Saved Objects Management UI.
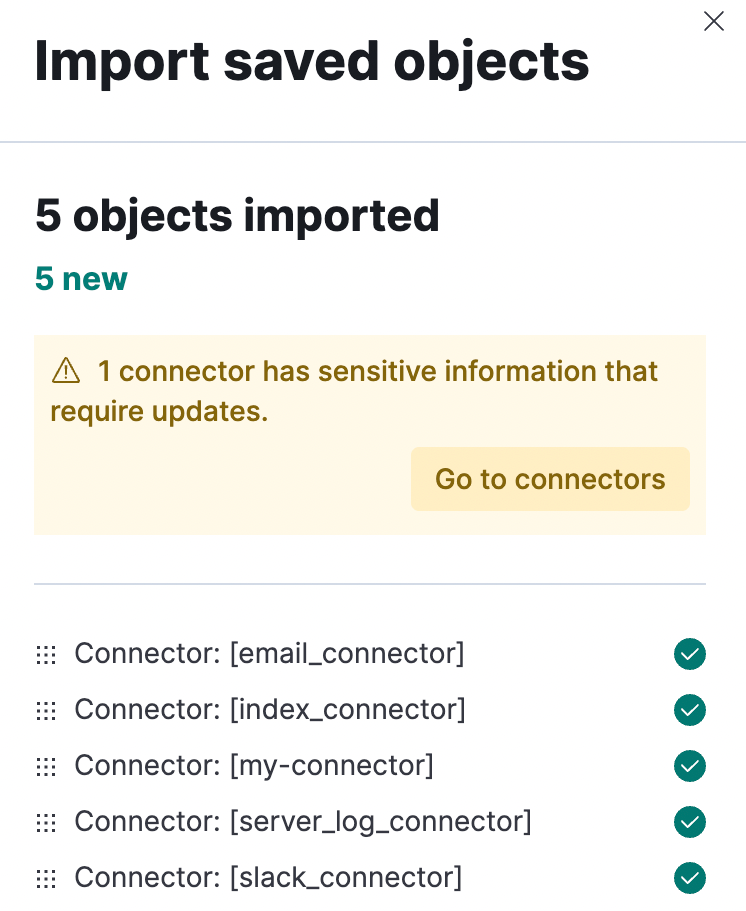
If a connector is missing sensitive information after the import, a Fix button appears in Connectors.
When cloud deployment or project metadata is available, outbound connector HTTP requests include a deployment or project identifier in the User-Agent header. When that metadata is not available, connector requests do not add this fragment. The User-Agent stays at the default HTTP client value (for example, axios/1.7.2).
IT and information security teams can match outbound connector traffic in third-party audit or access logs to the originating deployment or project—for example, during incident response or when a vendor contacts Elastic about suspicious activity.
For every outbound HTTP request made by a connector (for example, to Slack, Google Workspace, or PagerDuty), Kibana sets a User-Agent header that includes an identifier for the deployment or project that originated the traffic. This is automatic and does not require connector configuration, networking settings, or other administrator actions.
The header starts with the underlying HTTP client name and version (for example, axios/1.7.2). When cloud metadata is available, an additional Elastic fragment is appended.
| Environment | Example suffix in User-Agent |
Meaning |
|---|---|---|
| Elastic Cloud Hosted | elastic (deployment:<deployment_id>) |
<deployment_id> is the deployment ID. |
| Elastic Cloud Serverless | elastic (project:<project_id>) |
<project_id> is the serverless project ID. |
Elastic Cloud organization administrators can look up deployment and Elastic Cloud Serverless project identifiers across their organization. Users with other roles can look them up only for deployments and projects they have access to.
Kibana does not provide a UI or API to resolve the deployment or project values shown in connector User-Agent headers. Use the following steps instead:
- Copy the identifier from the header. The identifier is the substring after
deployment:orproject:. - Open the Elastic Cloud console and sign in.
- Go to the Hosted (for Elastic Cloud Hosted deployments) or Serverless (for Serverless projects) page, and enter the ID in the search field to find the matching deployment or project.
The Task Manager health API helps you understand the performance of all tasks in your environment. However, if connectors fail to run, they will report as successful to Task Manager. The failure stats will not accurately depict the performance of connectors.
For more information on connector successes and failures, refer to the Event log index.