OpenTelemetry internal telemetry Assets
| Version | 1.1.0 (View all) |
| Subscription level What's this? |
Basic |
| Developed by What's this? |
Elastic |
| Minimum Kibana version(s) | 9.3.0 |
This package contains dashboards that visualize the internal metrics from OpenTelemetry components.
The OTel collector dashboards are compatible with the metrics defined here in the OpenTelemetry collector documentation. The oldest tested version of the OpenTelemetry Collector in combination with this package is v1.44.0.
The dashboards rely on field names defined in above documentation.
You need to follow the documentation of the OpenTelemetry collector to setup and send internal telemetry to your cluster.
The most important prerequisite is to define the telemetry section under service:
service:
  telemetry:
    metrics:
      readers:
        - periodic:
            exporter:
              otlp:
                protocol: http/protobuf
                endpoint: https://backend:4318
With this, you'll have internal telemetry on normal verbosity level.
The above configuration defines an OTLP endpoint that sends internal telemetry to a target collector over an OTLP connection. This target collector then exports the internal telemetry data to Elasticsearch using the elasticsearch exporter. The integration subsequently reads this internal telemetry data from Elasticsearch.
For all the other config, refer to the upstream documentation.
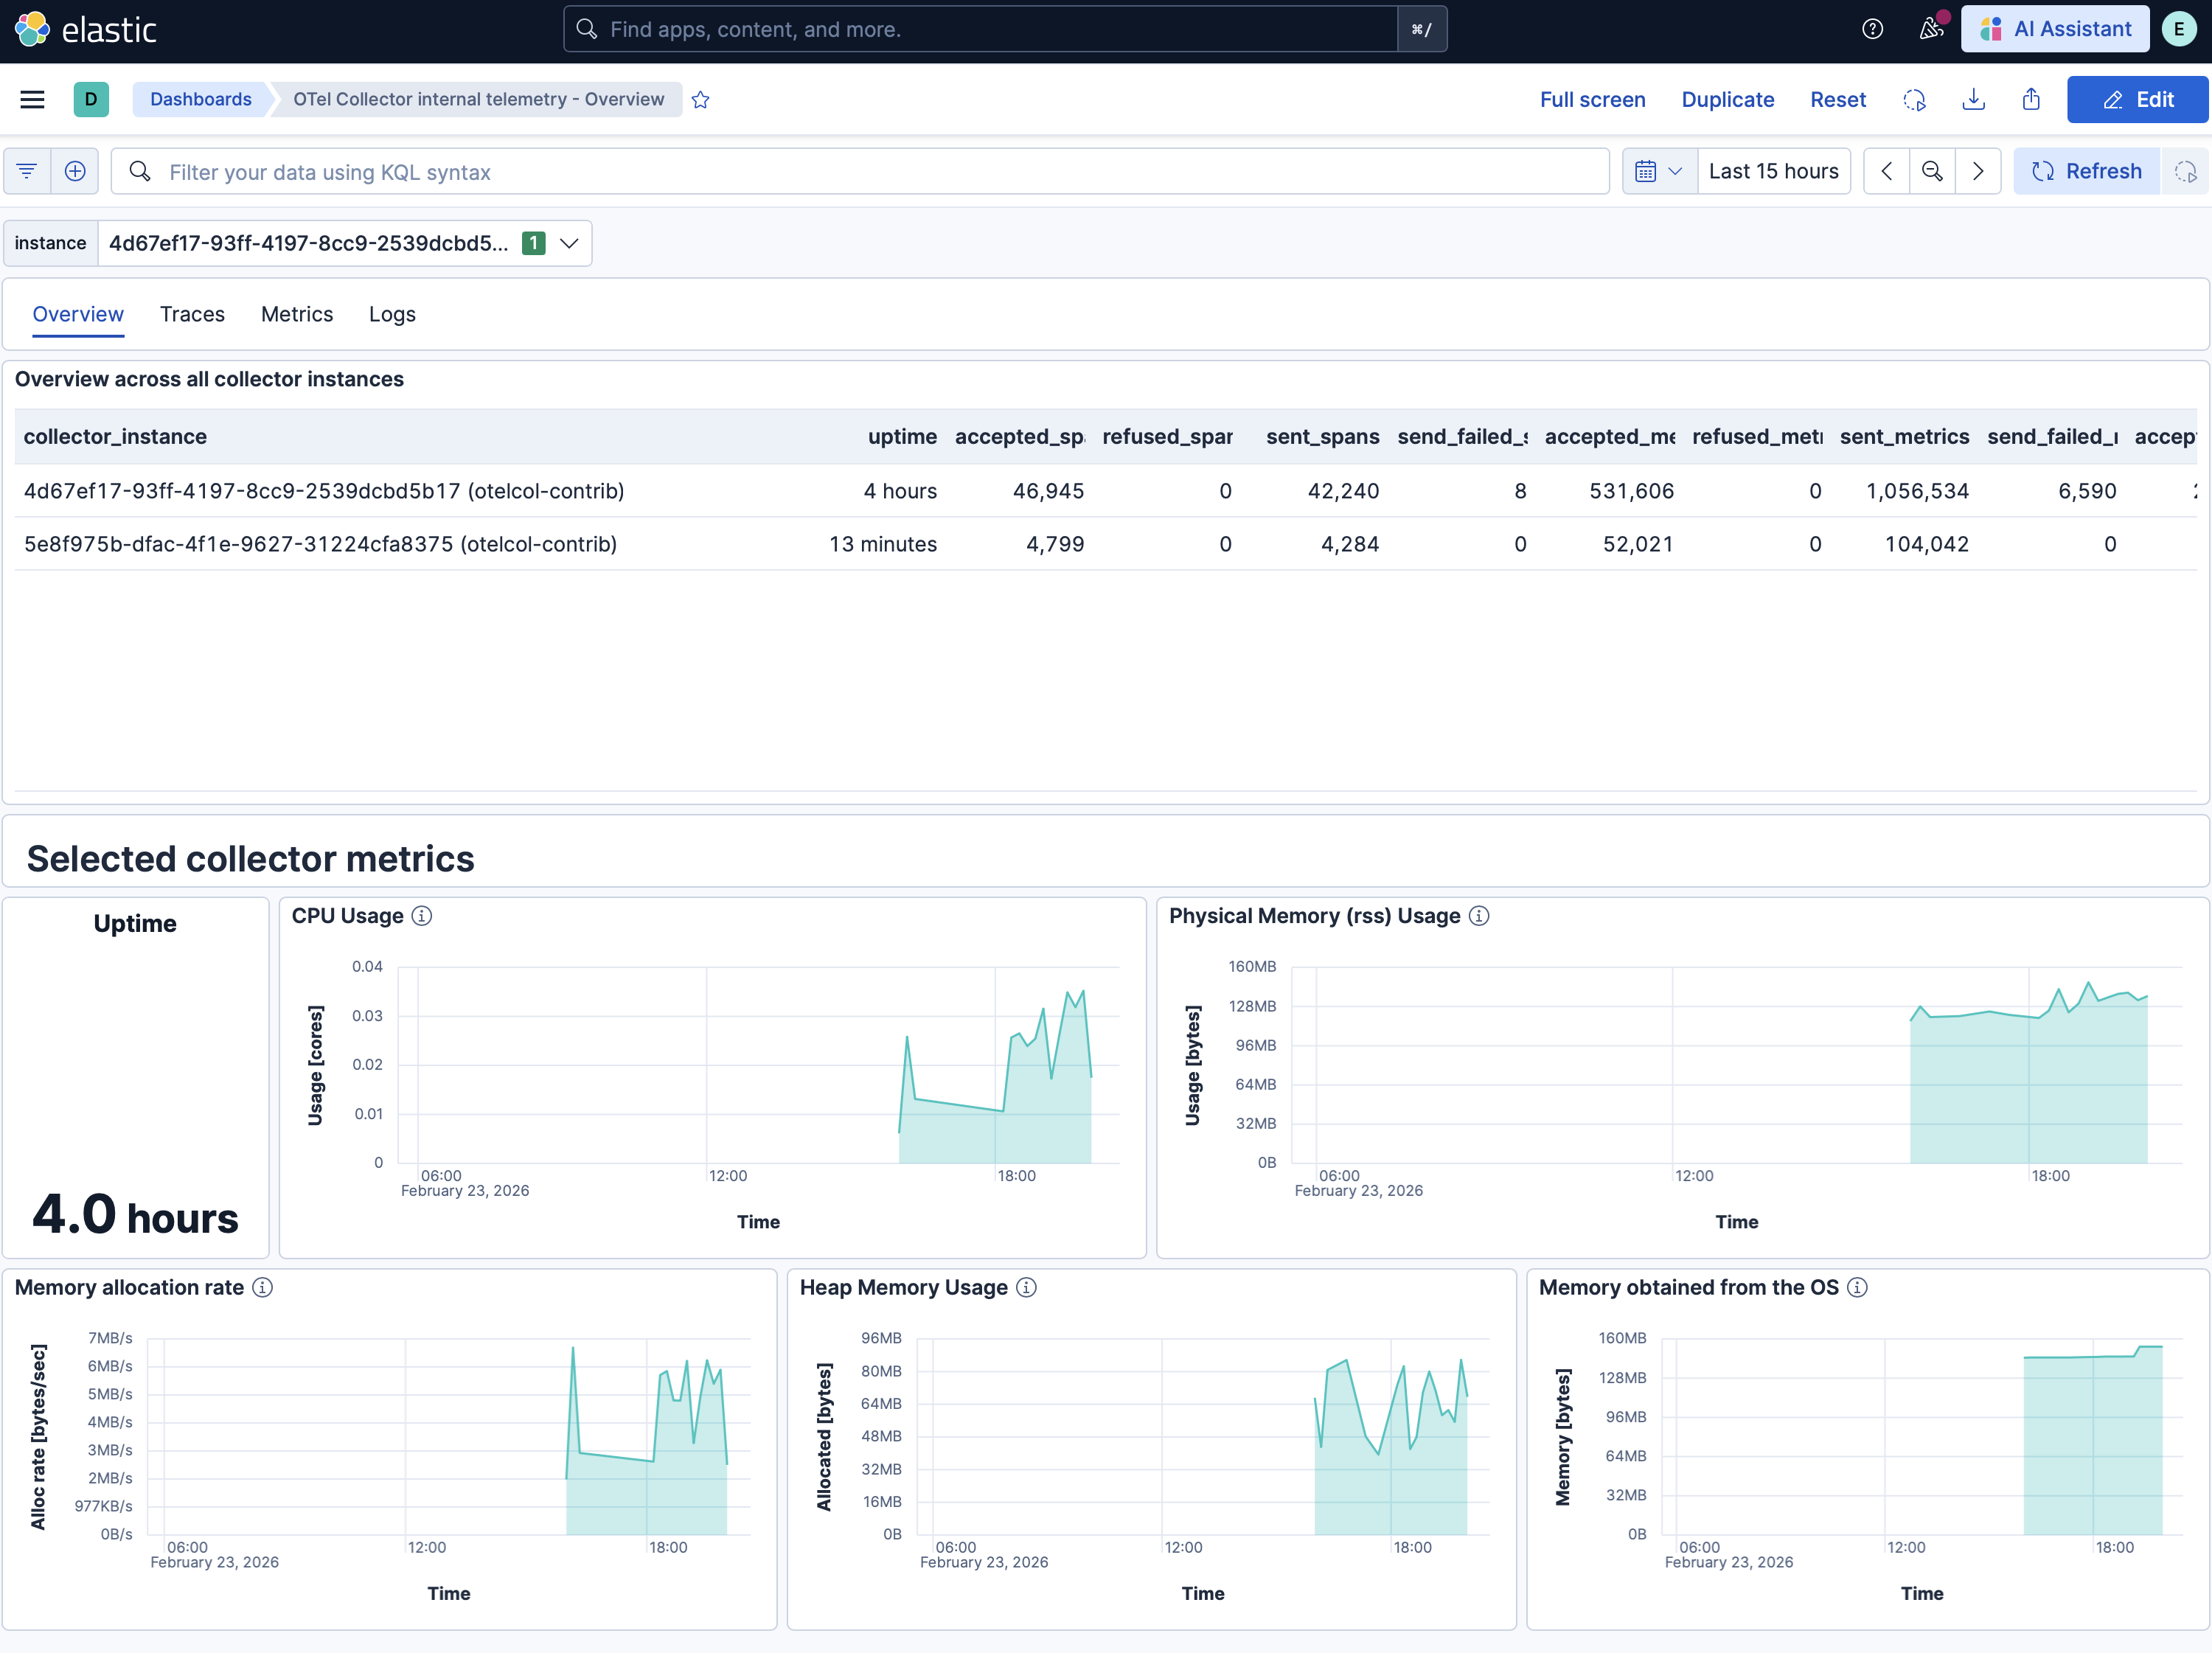
This integration includes one or more Kibana dashboards that visualizes the data collected by the integration. The screenshots below illustrate how the ingested data is displayed.
Changelog
| Version | Details | Minimum Kibana version |
|---|---|---|
| 1.1.0 | Enhancement (View pull request) Add alerting rules for failed span, metric point and log record exports. |
9.3.0 |
| 1.0.0 | Enhancement (View pull request) Add ES|QL based dashboards and increase minimum Kibana version to 9.3. |
9.3.0 |
| 0.1.0 | Enhancement (View pull request) Add lens based dashboards for older Kibana versions (8.19+). |
8.19.0 |
| 0.0.4 | Enhancement (View pull request) Separate dashboards per event type and adding more dropdowns to filter by receiver, exporter, processor and more. |
9.3.0 |
| 0.0.3 | Enhancement (View pull request) Extend docs |
— |
| 0.0.2 | Enhancement (View pull request) Use SVG for icon |
— |
| 0.0.1 | Enhancement (View pull request) Adding visualizations for OpenTelemetry Collector internal telemetry including CPU, memory, usage, queue size, failed and exported spans, metrics, traces. |
— |
