Fortinet FortiMail Integration for Elastic
| Version | 2.19.0 (View all) |
| Subscription level What's this? |
Basic |
| Developed by What's this? |
Elastic |
| Ingestion method(s) | File, Network Protocol |
| Minimum Kibana version(s) | 9.0.0 8.11.0 |
This AI-assisted guide was validated by our engineers. You may need to adjust the steps to match your environment.
The Fortinet FortiMail integration for Elastic enables you to collect and analyze logs from your FortiMail instances. FortiMail provides multi-layered protection against a wide spectrum of email-borne threats, including spam, phishing, malware, zero-day threats, impersonation, and Business Email Compromise (BEC) attacks. By integrating FortiMail with the Elastic Stack, you gain visibility into your email environment and can correlate security events across your infrastructure.
This integration is compatible with Fortinet FortiMail version 7.2.2.
This integration is compatible with Elastic Stack version 8.11.0 or higher.
This integration collects logs from FortiMail by receiving syslog data or reading log files directly. You configure your FortiMail instance to forward logs in CSV format to an Elastic Agent using tcp or udp. Alternatively, the agent can read logs from a local file using the filestream input. The agent then processes the data through the log data stream and maps it to the Elastic Common Schema (ECS), allowing you to visualize and analyze it using Kibana dashboards.
The Fortinet FortiMail integration collects log messages in CSV format for the following types:
- History events: Records of email processing, delivery status, and message flow through the appliance.
- System events: Logs related to appliance management, administrator actions, and system health status.
- Mail events: Details about processed email messages and their attributes.
- Antispam events: Records of messages identified as spam, phishing, or graymail based on your configured filters.
- Antivirus events: Details about detected malware, viruses, and suspicious attachments found in emails.
- Encryption events: Records of secure email delivery, including encryption and decryption actions.
This integration includes the following data stream:
log: Collects FortiMail event logs sent via Syslog (TCPorUDP) or read from a file usingfilestream.
Integrating your FortiMail logs with Elastic provides visibility into your email security environment and helps you with several key tasks:
- Email threat detection: You can monitor and analyze spam, malware, and phishing attempts across your organization in real-time.
- Security incident response: You'll be able to correlate email security events with data from other sources in Elastic to investigate complex attacks.
- Compliance and auditing: You can maintain long-term, searchable archives of mail flow and administrative actions to meet regulatory requirements.
- Operational monitoring: You'll gain insights into mail delivery performance and system health to ensure your email infrastructure is running smoothly.
You'll need the following to use this integration:
- Full administrative access to the FortiMail web UI to configure logging settings.
- Network connectivity between your FortiMail device and the server hosting the Elastic Agent.
- Open ports in any intervening firewalls, such as
UDP 514orTCP 9024, to allow Syslog traffic. - The
CSVformat option enabled in your FortiMail logging configuration. This setting is mandatory for the integration to parse logs correctly. - The IP address of your Elastic Agent host and the specific port it's configured to listen on for Syslog messages.
- An Elastic Agent installed and enrolled in Fleet.
- Connectivity that allows the Elastic Agent host to be reached from the FortiMail device over the configured Syslog protocol (TCP or UDP) and port.
Elastic Agent must be installed on a host that can receive syslog data or access the log files from Fortinet FortiMail. For more details, check the Elastic Agent installation instructions. You can install only one Elastic Agent per host.
Elastic Agent is required to:
- Stream data from the syslog or log file receiver.
- Ship the data to Elastic, where the events are processed via the integration's ingest pipelines.
Follow these steps to configure your FortiMail instance:
- Log in to the FortiMail web UI.
- Navigate to Log & Report > Log Setting > Remote.
- Click New to create a new remote logging profile.
- In the configuration dialog, check the Enable box to activate the profile.
- You'll need to configure the following settings for the syslog server:
- Name: Enter a descriptive name for the logging target, such as
elastic-agent-syslog. - Server name/IP: Enter the IP address of the server where the Elastic Agent is running (replace with your actual value).
- Port: Enter the port number that the Elastic Agent is configured to listen on for syslog messages, such as UDP
9024or TCP9024(replace with your actual value). - Level: Select the minimum severity level of logs to be sent. A common starting point is
NoticeorInformation. - Facility: Choose a facility identifier to distinguish FortiMail logs, for example,
local7. This must match what you expect in the agent's configuration. - CSV format: This is a mandatory step. Enable this option to ensure logs are sent in the comma-separated value (CSV) format required for parsing.
- Log protocol: Select Syslog.
- Name: Enter a descriptive name for the logging target, such as
- In the Logging Policy Configuration section at the bottom of the dialog, select the checkboxes for all the log types you wish to collect:
- History
- System Event
- Mail Event
- Antispam
- Antivirus
- Encryption
- Click Create to save the remote logging profile. FortiMail will begin forwarding logs that match your configuration to the specified Elastic Agent.
For more information, refer to the following vendor documentation:
- FortiMail Administration Guide: Configuring Syslog
- FortiMail Administration Guide: About FortiMail Logging
- In Kibana, navigate to Management > Integrations.
- Search for Fortinet FortiMail and select it.
- Click Add Fortinet FortiMail.
- Follow the prompts to add the integration to an existing Elastic Agent policy or create a new one.
- Configure the input type based on your FortiMail setup.
The integration supports the following input types:
Configure these fields to collect logs from a file:
- Paths: Provide a list of glob-based paths for the agent to crawl and fetch (e.g.,
/var/log/fortimail/*.log). - Timezone Offset: Set the timezone offset so datetimes are correctly parsed if you're ingesting logs from a host on a different timezone. Use a canonical ID (e.g.,
Europe/Amsterdam) or an HH:mm differential (e.g.,-05:00). Default:local. - Preserve original event: Check this to preserve a raw copy of the original event in the
event.originalfield. Default:false. - Tags: Add custom tags to your events. Default:
['forwarded', 'fortinet_fortimail-log']. - Preserve duplicate custom fields: Check this to preserve
fortinet_fortimail.logfields that were copied to Elastic Common Schema (ECS) fields. Default:false. - Processors: Add custom processors to reduce or enhance the exported event metadata before parsing.
Configure these fields to collect logs over a TCP socket:
- Listen Address: Set the bind address to listen for TCP connections (e.g.,
0.0.0.0to bind to all available interfaces). Default:localhost. - Listen Port: Set the TCP port number to listen on. Default:
9024. - Preserve original event: Check this to preserve a raw copy of the original event in the
event.originalfield. Default:false. - Custom TCP Options: Specify custom configuration options such as
framing: rfc6587,max_message_size: 50KiB, ormax_connections: 1. - SSL Configuration: Set the SSL configuration options for encrypted communication. See the SSL documentation for details.
- Timezone Offset: Set the timezone offset so datetimes are correctly parsed. Default:
local. - Tags: Add custom tags to your events. Default:
['forwarded', 'fortinet_fortimail-log']. - Preserve duplicate custom fields: Check this to preserve fields that were copied to ECS fields. Default:
false. - Processors: Add custom processors to enhance or reduce event fields.
Configure these fields to collect logs over a UDP socket:
- Listen Address: Set the bind address to listen for UDP connections (e.g.,
0.0.0.0). Default:localhost. - Listen Port: Set the UDP port number to listen on. Default:
9024. - Timezone Offset: Set the timezone offset for correct parsing of datetimes. Default:
local. - Preserve original event: Check this to preserve a raw copy of the original event in the
event.originalfield. Default:false. - Custom UDP Options: Specify options such as
read_bufferormax_message_size: 50KiB. - Tags: Add custom tags to your events. Default:
['forwarded', 'fortinet_fortimail-log']. - Preserve duplicate custom fields: Check this to preserve fields that were copied to ECS fields. Default:
false. - Processors: Add custom processors to manage event data before parsing.
After you finish the configuration, save and deploy the integration.
To verify your deployment, follow these steps:
- Navigate to Management > Fleet > Agents and confirm the status of your Elastic Agent is
Healthy. - You can perform the following actions to generate test data in Fortinet FortiMail:
- Send a test email through the FortiMail unit to generate
HistoryandMail Eventlogs. - Log in and out of the FortiMail web UI to generate
System Eventlogs. - Trigger an antispam or antivirus rule with a test email to generate
AntispamorAntiviruslogs. - Modify a non-critical configuration setting to generate a
System Eventlog.
- Send a test email through the FortiMail unit to generate
- In Kibana, navigate to Analytics > Discover.
- Select the
logs-*data view and enter the following KQL filter:data_stream.dataset : "fortinet_fortimail.log" - Verify the following fields are populated:
event.dataset(should befortinet_fortimail.log)fortinet_fortimail.log.type(e.g.,History,System,Mail,Antispam,Antivirus)event.outcomeorevent.actionmessage(containing the raw log)
- Navigate to Analytics > Dashboards and search for Fortinet FortiMail to view pre-built visualizations.
For help with Elastic ingest tools, check the Common problems documentation.
The following issues are commonly encountered when setting up the Fortinet FortiMail integration:
- CSV format not enabled: If your logs aren't being parsed correctly or fields appear unorganized, the FortiMail device might not be sending logs in CSV format. To fix this, log in to the FortiMail web UI, navigate to Log & Report > Log Setting > Remote, edit the logging profile for the Elastic Agent, and ensure you've checked the CSV format option.
- Incorrect syslog server IP or port: If no logs reach the Elastic Agent, double-check the Server name/IP and Port settings in your FortiMail remote logging profile against the
listen_addressandlisten_portyou configured in the Elastic Agent's integration policy. - Firewall blocking syslog traffic: Network firewalls between the FortiMail appliance and the Elastic Agent host can block syslog traffic. Ensure the configured syslog port (e.g.,
9024) is open bi-directionally on all firewalls. You can use tools likencortelnetto test connectivity from the FortiMail to the Elastic Agent host. - Facility or level mismatch: Logs might not be forwarded if the FortiMail's logging level or facility code doesn't match what you expect. For troubleshooting, set the FortiMail's logging Level to Debug or Information and ensure you've selected all relevant log types in the Logging Policy Configuration section.
- Parsing failures due to malformed CSV: If you see
error.messagefields in Kibana or events are dropped, it indicates the logs aren't in the expected CSV format or have unexpected deviations. Verify that the CSV format option is explicitly enabled on the FortiMail device and check the rawmessagefield in Kibana for any discrepancies. - TCP framing issues: When you use the TCP input, ensure the framing settings match between your FortiMail device and the Elastic Agent configuration. The integration defaults to
rfc6587. If you've customized the syslog format on the vendor side, you may need to adjust the Custom TCP Options to match the expected framing or line delimiters.
For more information on architectures that can be used for scaling this integration, check the Ingest Architectures documentation.
When you collect logs via syslog for the log data stream, you can choose between TCP and UDP protocols:
TCPoffers reliable, ordered delivery. This ensures all your log data arrives, which is crucial for auditing and security monitoring.UDPprovides faster, connectionless delivery. It's suitable for high-volume, less critical logs where you can accept some data loss in exchange for performance gains.
To manage high data volumes and reduce processing overhead on both the FortiMail device and the Elastic Agent, you should configure the FortiMail device to forward only necessary logs. You can do this by:
- Selecting
NoticeorInformationseverity levels. - Enabling only specific log categories required for monitoring, such as
History,System Event,Mail Event,Antispam,Antivirus, orEncryption.
While a single Elastic Agent can handle a significant volume of syslog data, you should deploy multiple Elastic Agents for high-throughput environments or geographically dispersed FortiMail instances. To ensure optimal performance:
- Resource each agent with appropriate CPU and memory based on your expected log volume.
- Distribute your FortiMail devices across multiple agents to balance the load and ensure no single agent becomes a bottleneck.
These inputs can be used with this integration:
filestream
For more details about the Filestream input settings, check the Filebeat documentation.
To collect logs via Filestream, select Collect logs via Filestream and configure the following parameters:
- Filestream paths: The full path to the related log file.
tcp
For more details about the TCP input settings, check the Filebeat documentation.
To collect logs via TCP, select Collect logs via TCP and configure the following parameters:
Required Settings:
- Host
- Port
Common Optional Settings:
- Max Message Size - Maximum size of incoming messages
- Max Connections - Maximum number of concurrent connections
- Timeout - How long to wait for data before closing idle connections
- Line Delimiter - Character(s) that separate log messages
To enable encrypted connections, configure the following SSL settings:
SSL Settings:
- Enable SSL - Toggle to enable SSL/TLS encryption
- Certificate - Path to the SSL certificate file (
.crtor.pem) - Certificate Key - Path to the private key file (
.key) - Certificate Authorities - Path to CA certificate file for client certificate validation (optional)
- Client Authentication - Require client certificates (
none,optional, orrequired) - Supported Protocols - TLS versions to support (e.g.,
TLSv1.2,TLSv1.3)
Example SSL Configuration:
ssl.enabled: true
ssl.certificate: "/path/to/server.crt"
ssl.key: "/path/to/server.key"
ssl.certificate_authorities: ["/path/to/ca.crt"]
ssl.client_authentication: "optional"
udp
For more details about the UDP input settings, check the Filebeat documentation.
To collect logs via UDP, select Collect logs via UDP and configure the following parameters:
Required Settings:
- Host
- Port
Common Optional Settings:
- Max Message Size - Maximum size of UDP packets to accept (default: 10KB, max: 64KB)
- Read Buffer - UDP socket read buffer size for handling bursts of messages
- Read Timeout - How long to wait for incoming packets before checking for shutdown
The log data stream collects various log types from Fortinet FortiMail instances, including system events, virus detections, spam filtering results, and mail delivery logs.
Exported fields
| Field | Description | Type |
|---|---|---|
| @timestamp | Event timestamp. | date |
| data_stream.dataset | Data stream dataset. | constant_keyword |
| data_stream.namespace | Data stream namespace. | constant_keyword |
| data_stream.type | Data stream type. | constant_keyword |
| event.dataset | Event dataset. | constant_keyword |
| event.module | Event module. | constant_keyword |
| fortinet_fortimail.log.action | keyword | |
| fortinet_fortimail.log.classifier | keyword | |
| fortinet_fortimail.log.client.cc | keyword | |
| fortinet_fortimail.log.client.ip | ip | |
| fortinet_fortimail.log.client.name | keyword | |
| fortinet_fortimail.log.date | keyword | |
| fortinet_fortimail.log.destination_ip | ip | |
| fortinet_fortimail.log.detail | keyword | |
| fortinet_fortimail.log.device_id | keyword | |
| fortinet_fortimail.log.direction | keyword | |
| fortinet_fortimail.log.disposition | keyword | |
| fortinet_fortimail.log.domain | keyword | |
| fortinet_fortimail.log.endpoint | keyword | |
| fortinet_fortimail.log.from | keyword | |
| fortinet_fortimail.log.hfrom | keyword | |
| fortinet_fortimail.log.id | keyword | |
| fortinet_fortimail.log.ip | ip | |
| fortinet_fortimail.log.mailer | keyword | |
| fortinet_fortimail.log.message | keyword | |
| fortinet_fortimail.log.message_id | keyword | |
| fortinet_fortimail.log.message_length | long | |
| fortinet_fortimail.log.module | keyword | |
| fortinet_fortimail.log.network | keyword | |
| fortinet_fortimail.log.notif_delay | keyword | |
| fortinet_fortimail.log.policy_id | keyword | |
| fortinet_fortimail.log.port | long | |
| fortinet_fortimail.log.priority | keyword | |
| fortinet_fortimail.log.priority_number | long | |
| fortinet_fortimail.log.read_status | keyword | |
| fortinet_fortimail.log.reason | keyword | |
| fortinet_fortimail.log.recv_time | keyword | |
| fortinet_fortimail.log.resolved | keyword | |
| fortinet_fortimail.log.scan_time | double | |
| fortinet_fortimail.log.sent_from | keyword | |
| fortinet_fortimail.log.session_id | keyword | |
| fortinet_fortimail.log.source.folder | keyword | |
| fortinet_fortimail.log.source.ip | ip | |
| fortinet_fortimail.log.source.type | keyword | |
| fortinet_fortimail.log.status | keyword | |
| fortinet_fortimail.log.sub_module | keyword | |
| fortinet_fortimail.log.sub_type | keyword | |
| fortinet_fortimail.log.subject | keyword | |
| fortinet_fortimail.log.time | keyword | |
| fortinet_fortimail.log.to | keyword | |
| fortinet_fortimail.log.type | keyword | |
| fortinet_fortimail.log.ui | keyword | |
| fortinet_fortimail.log.ui_ip | ip | |
| fortinet_fortimail.log.url | keyword | |
| fortinet_fortimail.log.user | keyword | |
| fortinet_fortimail.log.virus | keyword | |
| fortinet_fortimail.log.xfer_time | double | |
| input.type | Type of Filebeat input. | keyword |
| log.file.device_id | ID of the device containing the filesystem where the file resides. | keyword |
| log.file.fingerprint | The sha256 fingerprint identity of the file when fingerprinting is enabled. | keyword |
| log.file.idxhi | The high-order part of a unique identifier that is associated with a file. (Windows-only) | keyword |
| log.file.idxlo | The low-order part of a unique identifier that is associated with a file. (Windows-only) | keyword |
| log.file.inode | Inode number of the log file. | keyword |
| log.file.vol | The serial number of the volume that contains a file. (Windows-only) | keyword |
| log.offset | Log offset. | long |
| log.source.address | Source address from which the log event was read / sent from. | keyword |
| tags | User defined tags. | keyword |
Example
{
    "@timestamp": "2013-02-25T07:01:34.000Z",
    "agent": {
        "ephemeral_id": "6e27a1ae-39ab-4632-8e9b-d6d0b7a1e56b",
        "id": "4a5f8370-e38c-43b1-9dc9-b2c1e0788c6d",
        "name": "docker-fleet-agent",
        "type": "filebeat",
        "version": "8.10.2"
    },
    "data_stream": {
        "dataset": "fortinet_fortimail.log",
        "namespace": "ep",
        "type": "logs"
    },
    "destination": {
        "ip": "81.2.69.194"
    },
    "ecs": {
        "version": "8.17.0"
    },
    "elastic_agent": {
        "id": "4a5f8370-e38c-43b1-9dc9-b2c1e0788c6d",
        "snapshot": false,
        "version": "8.10.2"
    },
    "email": {
        "direction": "unknown",
        "from": {
            "address": [
                "aaa@example.com"
            ]
        },
        "subject": "Test12345",
        "to": {
            "address": [
                "user1@example.com"
            ]
        },
        "x_mailer": "proxy"
    },
    "event": {
        "agent_id_status": "verified",
        "code": "0200025843",
        "dataset": "fortinet_fortimail.log",
        "ingested": "2023-10-03T09:51:39Z",
        "kind": "event",
        "original": "<187>date=2013-02-25,time=07:01:34,device_id=FE100C3909600504,log_id=0200025843,type=statistics,pri=information,session_id=\"r1PF1YTh025836-r1PF1YTh025836\",client_name=\"user\",dst_ip=\"81.2.69.194\",endpoint=\"\",from=\"aaa@example.com\",to=\"user1@example.com\",polid=\"0:1:0\",domain=\"example.com\",subject=\"Test12345\",mailer=\"proxy\",resolved=\"FAIL\",direction=\"unknown\",virus=\"\",disposition=\"Delay\",classifier=\"Session Limits\",message_length=\"199986\"",
        "outcome": "failure"
    },
    "fortinet_fortimail": {
        "log": {
            "classifier": "Session Limits",
            "client": {
                "name": "user"
            },
            "date": "2013-02-25",
            "destination_ip": "81.2.69.194",
            "device_id": "FE100C3909600504",
            "direction": "unknown",
            "disposition": "Delay",
            "domain": "example.com",
            "from": "aaa@example.com",
            "id": "0200025843",
            "mailer": "proxy",
            "message_length": 199986,
            "policy_id": "0:1:0",
            "priority": "information",
            "priority_number": 187,
            "resolved": "FAIL",
            "session_id": "r1PF1YTh025836-r1PF1YTh025836",
            "subject": "Test12345",
            "time": "07:01:34",
            "to": "user1@example.com",
            "type": "statistics"
        }
    },
    "input": {
        "type": "tcp"
    },
    "log": {
        "level": "information",
        "source": {
            "address": "192.168.144.4:54368"
        },
        "syslog": {
            "facility": {
                "code": 22
            },
            "priority": 187,
            "severity": {
                "code": 6
            }
        }
    },
    "observer": {
        "product": "FortiMail",
        "serial_number": "FE100C3909600504",
        "type": "firewall",
        "vendor": "Fortinet"
    },
    "related": {
        "ip": [
            "81.2.69.194"
        ],
        "user": [
            "user",
            "aaa@example.com",
            "user1@example.com"
        ]
    },
    "server": {
        "domain": "example.com",
        "registered_domain": "example.com",
        "top_level_domain": "com"
    },
    "source": {
        "user": {
            "name": "user"
        }
    },
    "tags": [
        "preserve_original_event",
        "preserve_duplicate_custom_fields",
        "forwarded",
        "fortinet_fortimail-log"
    ]
}
For more information about Fortinet FortiMail logging and configuration, you can refer to the following resources:
- Fortinet FortiMail Product Page
- About FortiMail logging
- FortiMail Administration Guide: About Logging
- FortiMail Administration Guide: Configuring Syslog
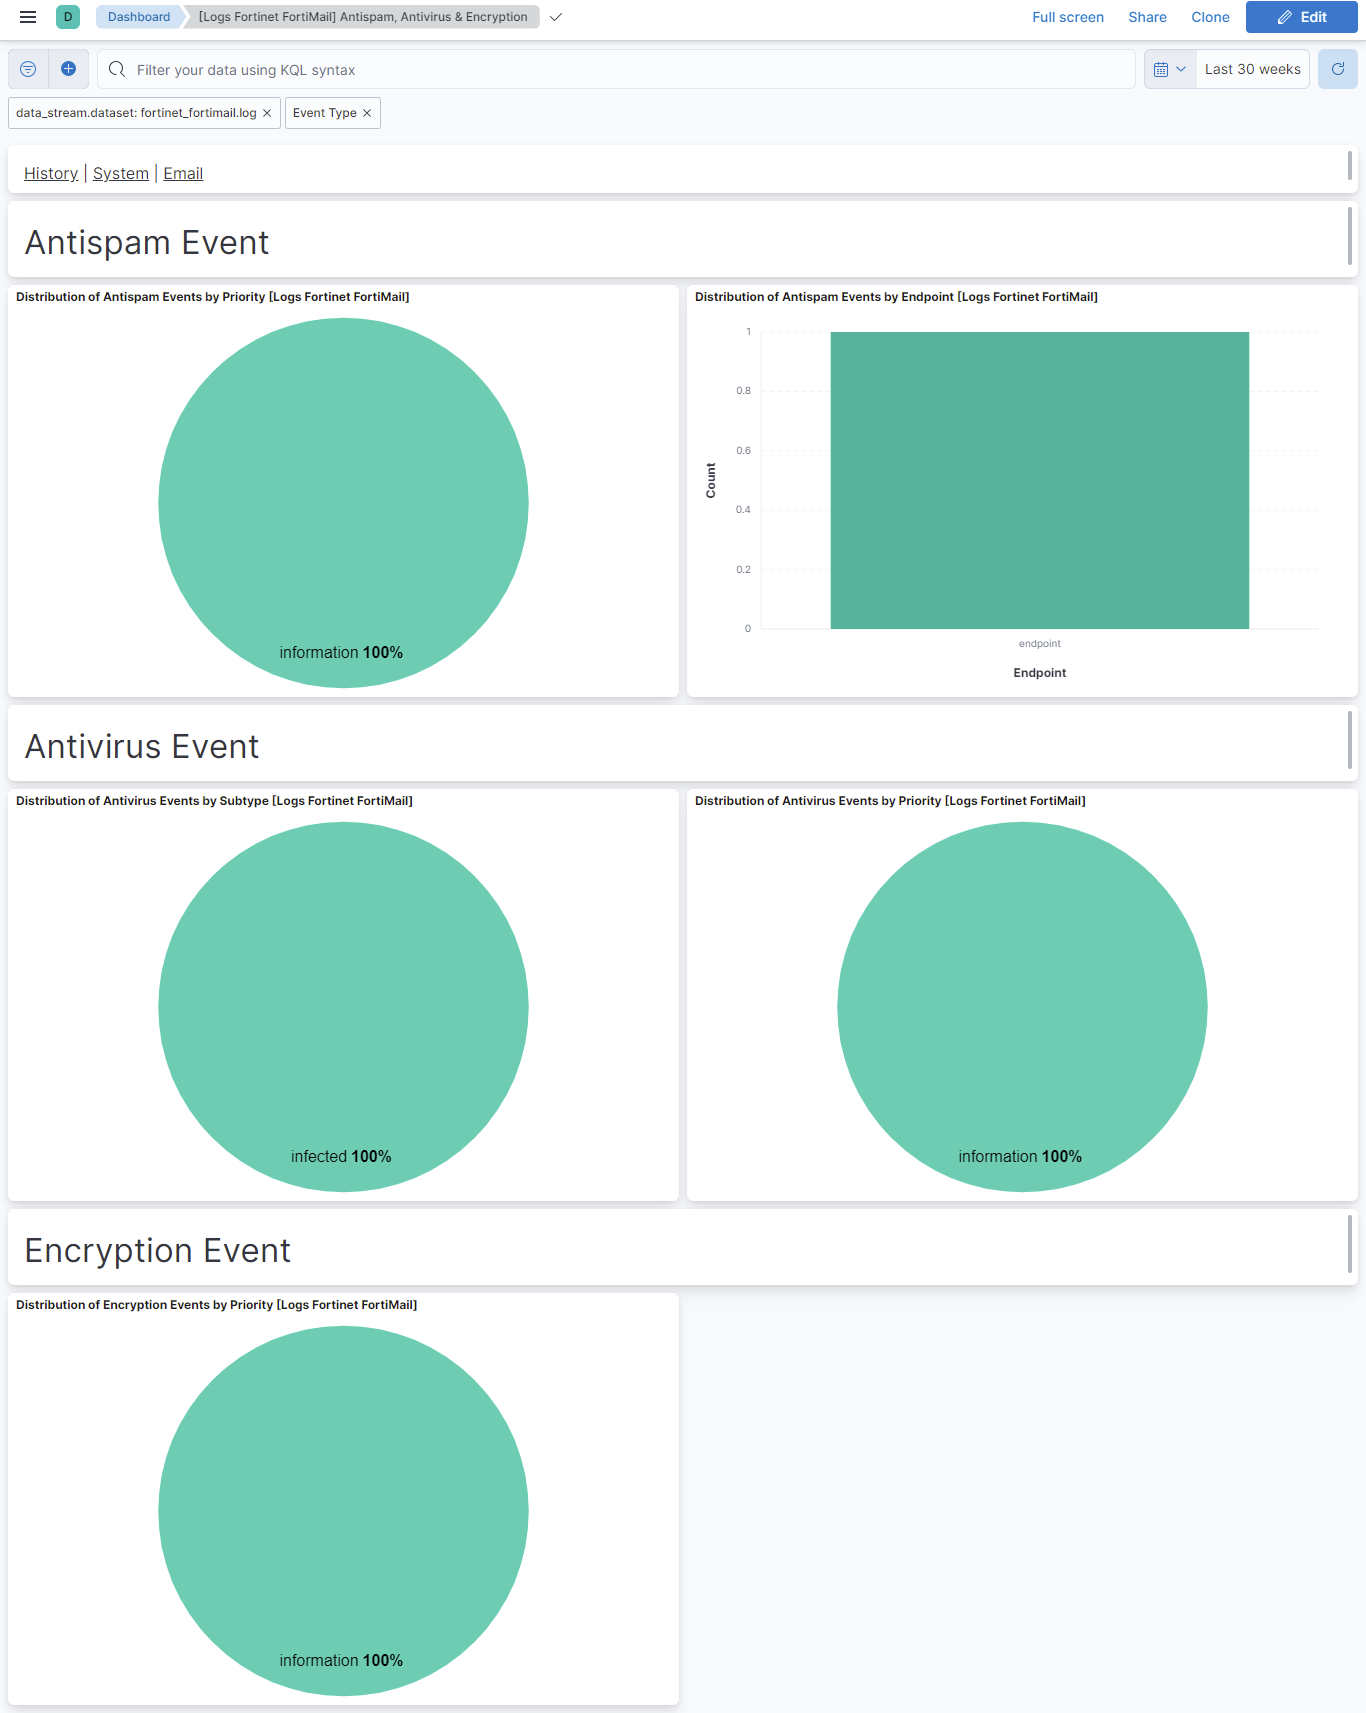
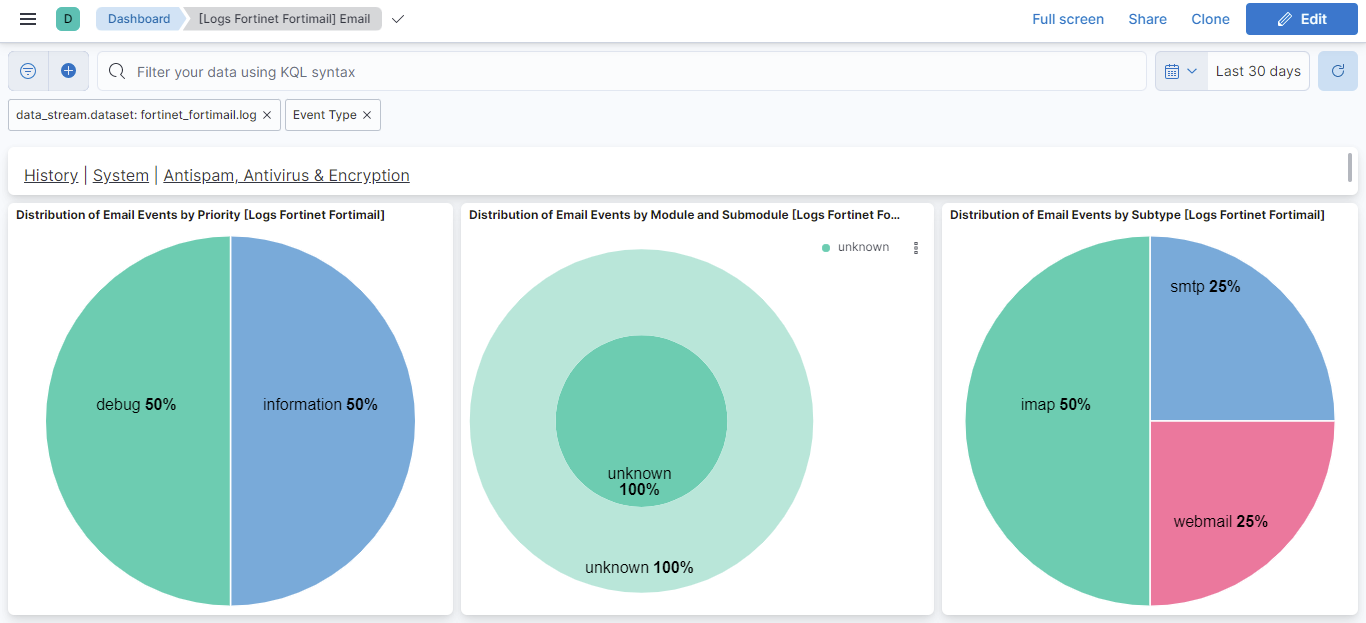
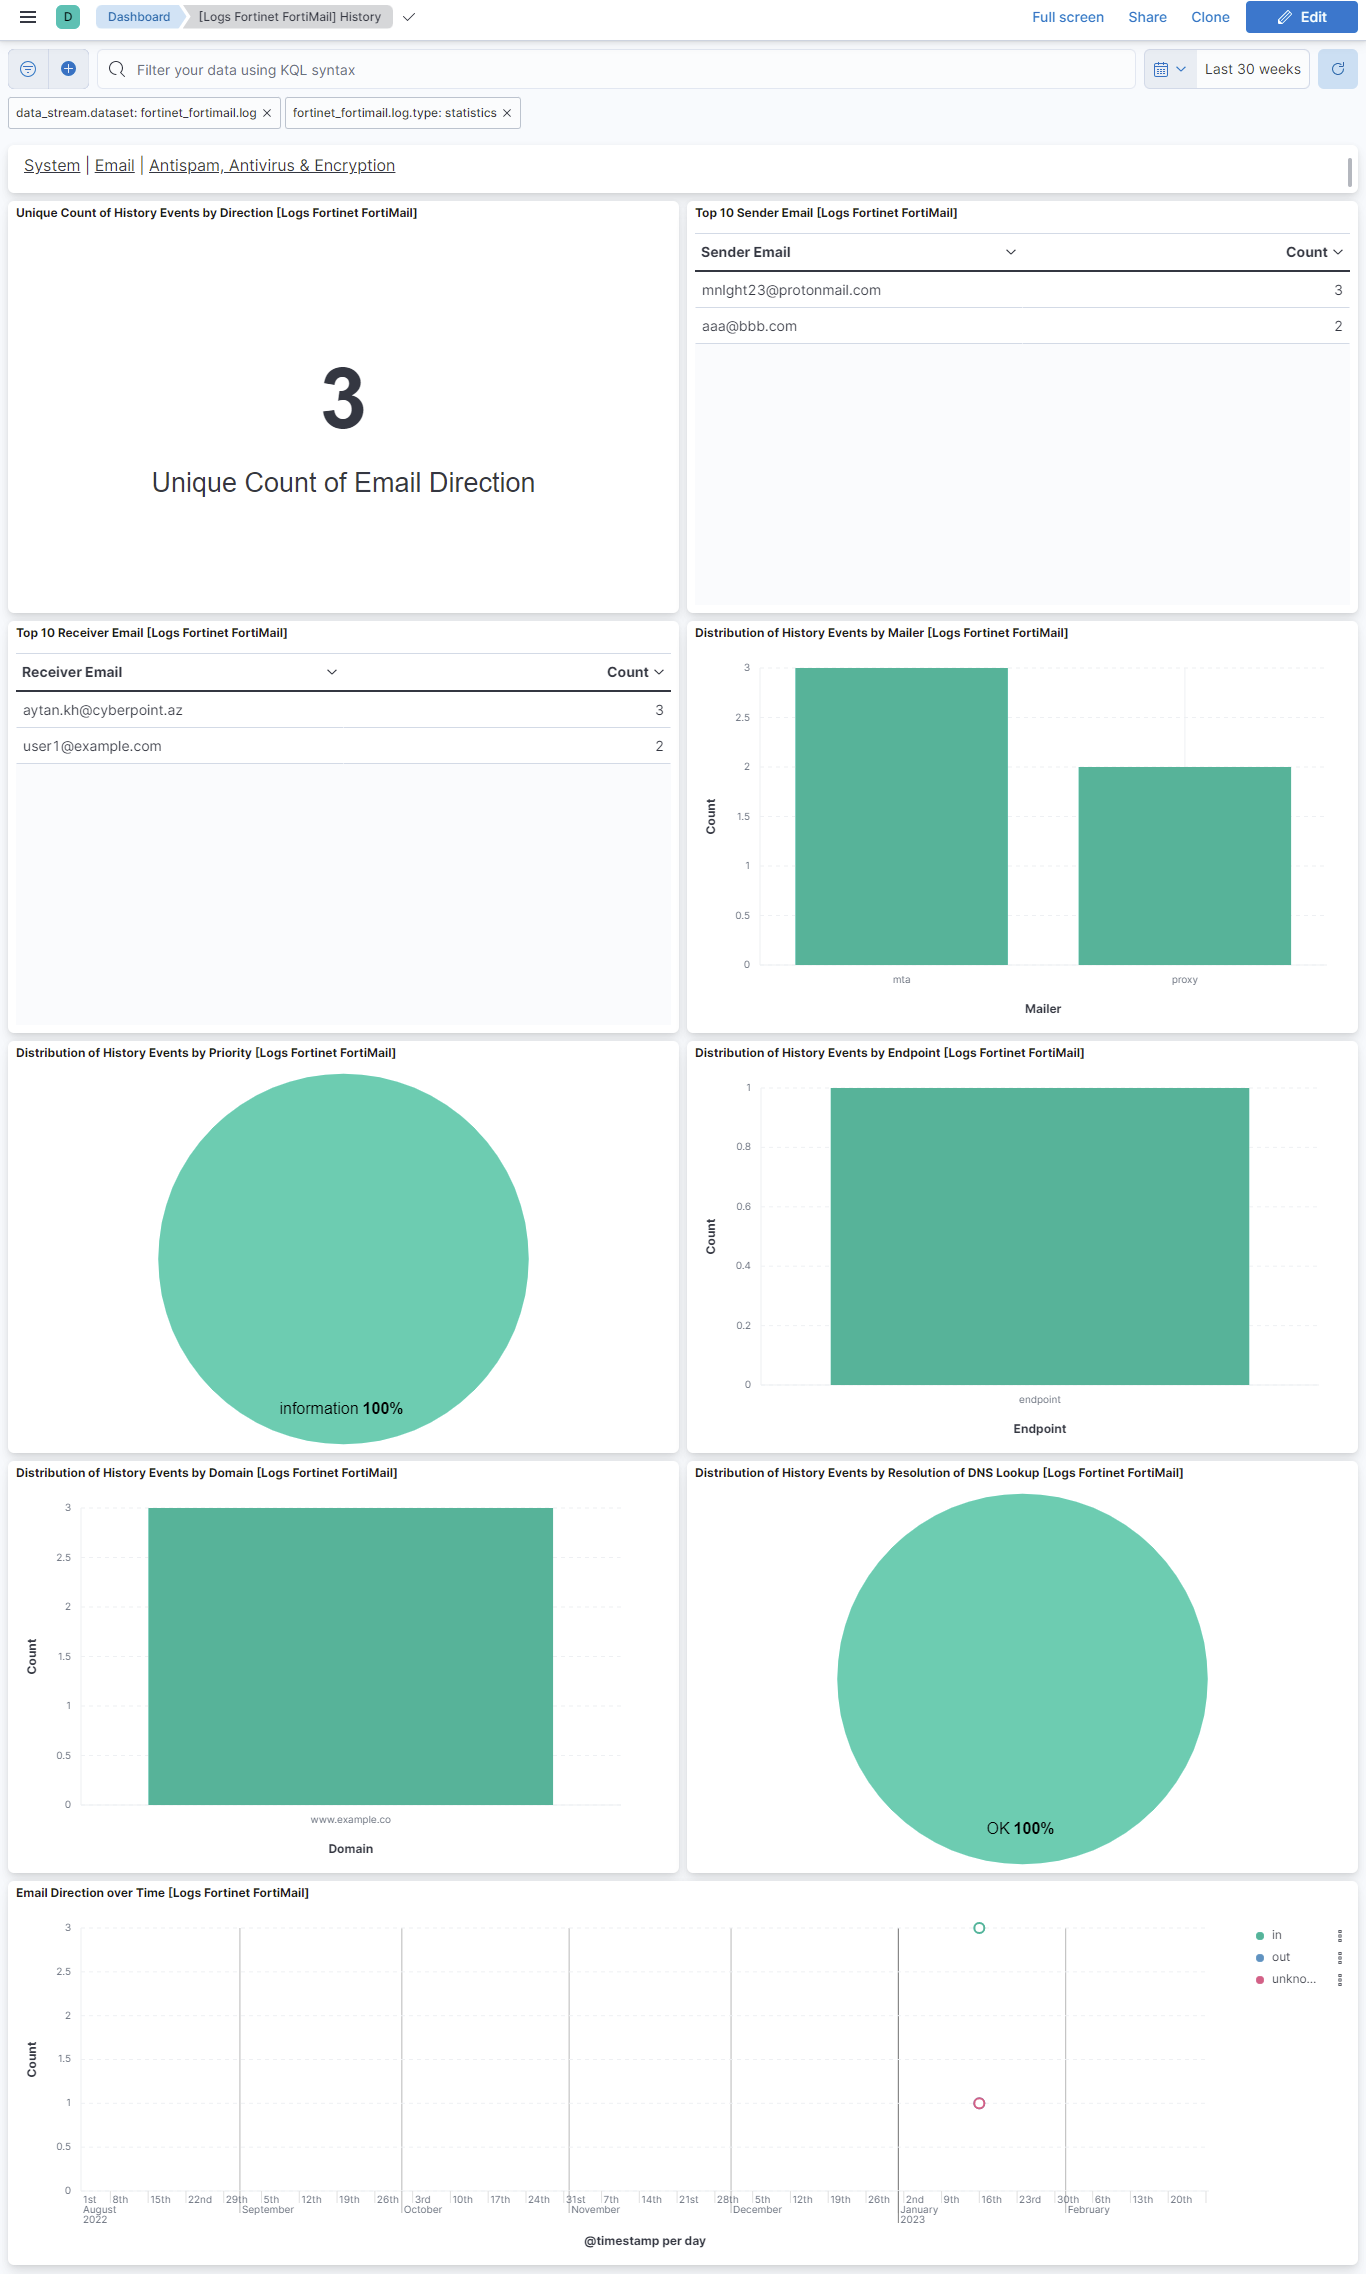
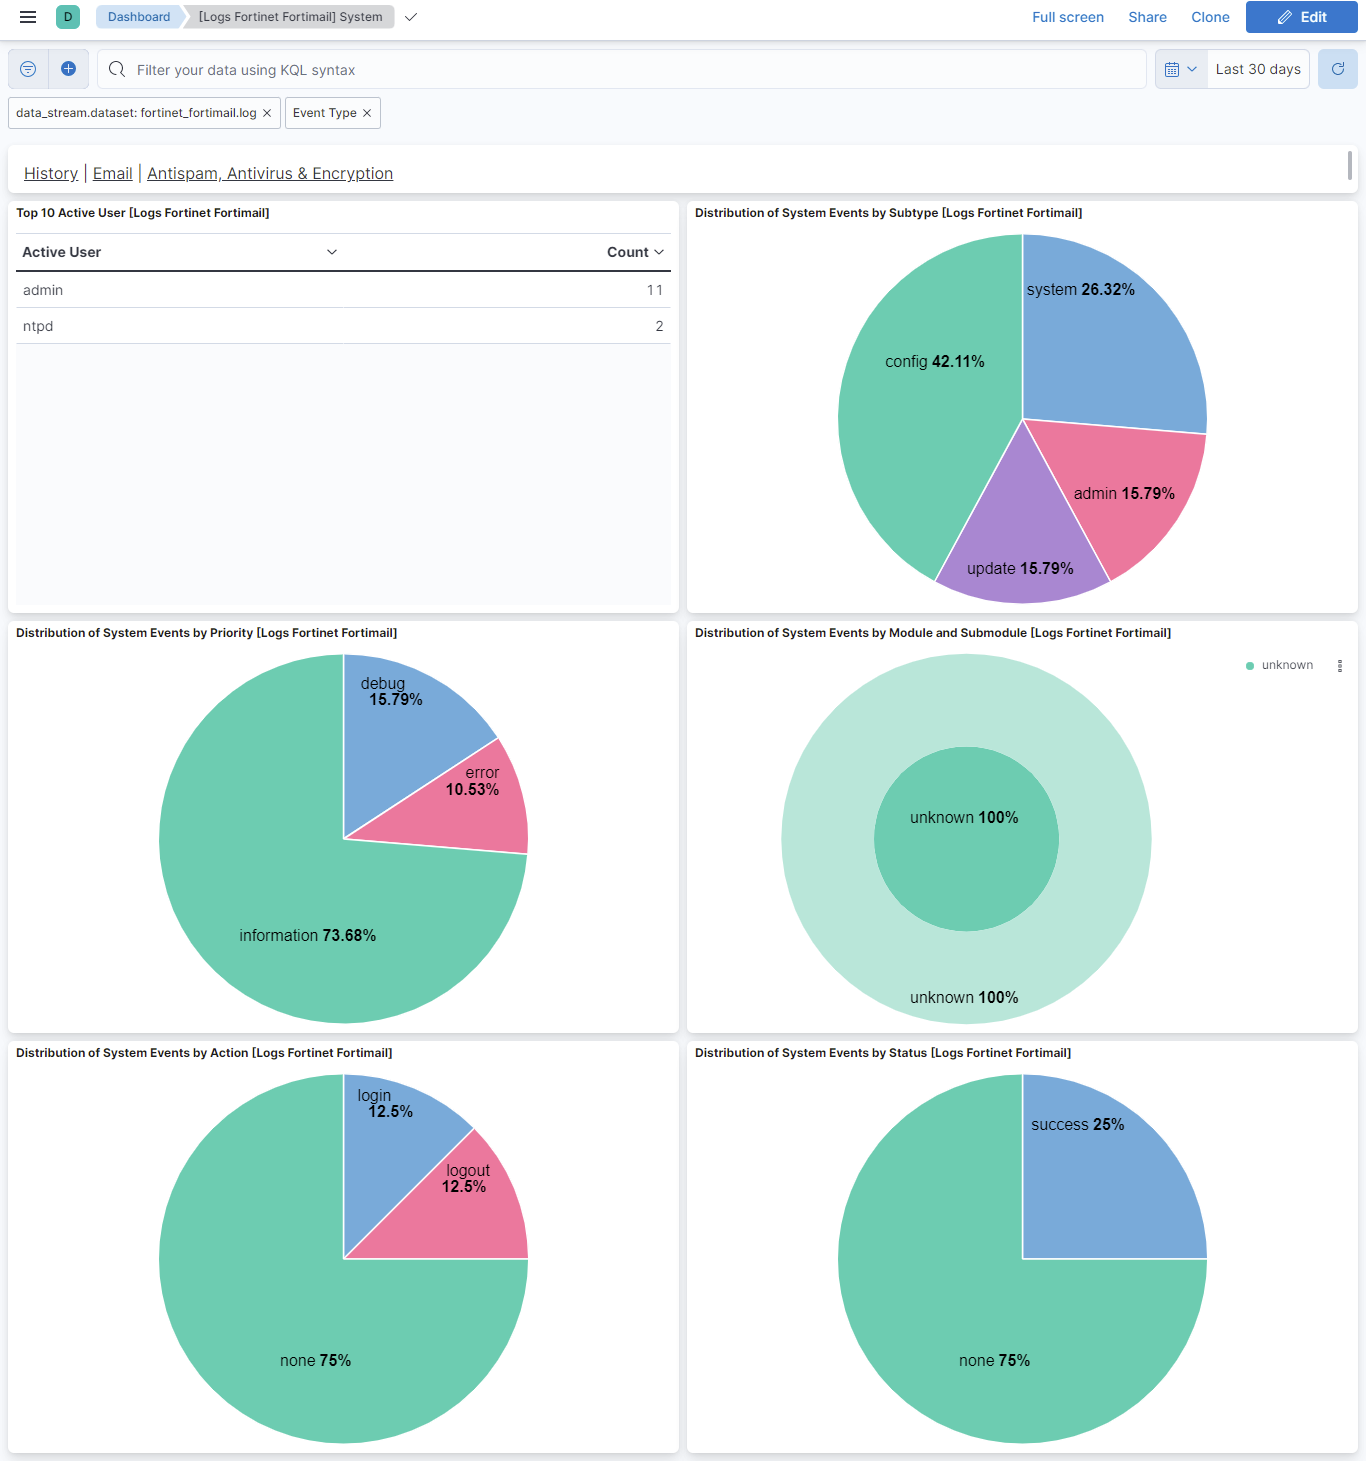
This integration includes one or more Kibana dashboards that visualizes the data collected by the integration. The screenshots below illustrate how the ingested data is displayed.
Changelog
| Version | Details | Minimum Kibana version |
|---|---|---|
| 2.19.0 | Enhancement (View pull request) update documentation |
9.0.0 8.11.0 |
| 2.18.1 | Bug fix (View pull request) Removed orphaned tag json file for security-solution-default. |
9.0.0 8.11.0 |
| 2.18.0 | Enhancement (View pull request) Map url field. |
9.0.0 8.11.0 |
| 2.17.1 | Bug fix (View pull request) Remove duplicate security-solution-default tag references |
9.0.0 8.11.0 |
| 2.17.0 | Enhancement (View pull request) Preserve event.original on pipeline error. |
9.0.0 8.11.0 |
| 2.16.1 | Enhancement (View pull request) Generate processor tags and normalize error handler. |
9.0.0 8.11.0 |
| 2.16.0 | Enhancement (View pull request) Replace navigation with links panels. Updated support for kibana version to 8.11.0 and above. |
9.0.0 8.11.0 |
| 2.15.1 | Enhancement (View pull request) Changed owners. |
9.0.0 8.3.0 |
| 2.15.0 | Enhancement (View pull request) Support stack version 9.0. |
9.0.0 8.3.0 |
| 2.14.1 | Bug fix (View pull request) Updated SSL description to be uniform and to include links to documentation. |
8.3.0 |
| 2.14.0 | Enhancement (View pull request) ECS version updated to 8.17.0. |
8.3.0 |
| 2.13.1 | Bug fix (View pull request) Tolerate existing event.timezone value. |
8.3.0 |
| 2.13.0 | Enhancement (View pull request) Update package spec to 3.0.3. |
8.3.0 |
| 2.12.2 | Enhancement (View pull request) Changed owners |
8.3.0 |
| 2.12.1 | Bug fix (View pull request) Fix exclude_files pattern. |
8.3.0 |
| 2.12.0 | Enhancement (View pull request) ECS version updated to 8.11.0. |
8.3.0 |
| 2.11.0 | Enhancement (View pull request) Improve 'event.original' check to avoid errors if set. |
8.3.0 |
| 2.10.0 | Enhancement (View pull request) Adapt fields for changes in file system info |
8.3.0 |
| 2.9.0 | Enhancement (View pull request) ECS version updated to 8.10.0. |
8.3.0 |
| 2.8.0 | Enhancement (View pull request) The format_version in the package manifest changed from 2.11.0 to 3.0.0. Removed dotted YAML keys from package manifest. Added 'owner.type: elastic' to package manifest. |
8.3.0 |
| 2.7.0 | Enhancement (View pull request) Add tags.yml file so that integration's dashboards and saved searches are tagged with "Security Solution" and displayed in the Security Solution UI. |
8.3.0 |
| 2.6.0 | Enhancement (View pull request) Handle block rule addition and removal. |
8.3.0 |
| 2.5.0 | Enhancement (View pull request) Update package to ECS 8.9.0. |
8.3.0 |
| 2.4.0 | Enhancement (View pull request) Ensure event.kind is correctly set for pipeline errors. |
8.3.0 |
| 2.3.0 | Enhancement (View pull request) Update package to ECS 8.8.0. |
8.3.0 |
| 2.2.0 | Enhancement (View pull request) Update package-spec version to 2.7.0. |
8.3.0 |
| 2.1.0 | Enhancement (View pull request) Update package to ECS 8.7.0. |
8.3.0 |
| 2.0.0 | Enhancement (View pull request) Replace RSA2ELK with Syslog integration. |
8.3.0 |
| 1.3.1 | Enhancement (View pull request) Added categories and/or subcategories. |
8.0.0 7.14.1 |
| 1.3.0 | Enhancement (View pull request) Update package to ECS 8.6.0. |
8.0.0 7.14.1 |
| 1.2.0 | Enhancement (View pull request) Update package to ECS 8.5.0. |
8.0.0 7.14.1 |
| 1.1.2 | Bug fix (View pull request) Remove duplicate field. |
8.0.0 7.14.1 |
| 1.1.1 | Enhancement (View pull request) Use ECS geo.location definition. |
8.0.0 7.14.1 |
| 1.1.0 | Enhancement (View pull request) Update Ingest Pipeline with observer Fields |
8.0.0 7.14.1 |
| 1.0.0 | Enhancement (View pull request) Initial version of Fortinet FortiMail as separate package |
8.0.0 7.14.1 |


