WebSphere Application Server
| Version | 1.6.1 (View all) |
| Subscription level What's this? |
Basic |
| Developed by What's this? |
Elastic |
| Ingestion method(s) | Prometheus |
| Minimum Kibana version(s) | 9.0.0 8.13.0 |
This Elastic integration is used to collect the following metrics from IBM WebSphere Application Server:
- JDBC metrics
- Servlet metrics
- Session Manager metrics
- ThreadPool metrics
This integration uses Prometheus to collect above metrics.
To open Prometheus endpoint read following instructions.
This integration has been tested against WebSphere Application Server traditional version 9.0.5.17.
If host.ip is shown conflicted under metrics-* data view, then this issue can be solved by reindexing the JDBC, Servlet, Session Manager and ThreadPool data stream's indices.
This data stream collects JDBC (Java Database Connectivity) related metrics.
Example
{
    "@timestamp": "2022-05-19T13:33:01.029Z",
    "agent": {
        "ephemeral_id": "7fca7599-6641-4340-ab44-e026d1b4935a",
        "id": "a0386d69-0749-44b4-8487-9b92e66852a1",
        "name": "docker-fleet-agent",
        "type": "metricbeat",
        "version": "8.2.0"
    },
    "data_stream": {
        "dataset": "websphere_application_server.jdbc",
        "namespace": "ep",
        "type": "metrics"
    },
    "ecs": {
        "version": "8.11.0"
    },
    "elastic_agent": {
        "id": "a0386d69-0749-44b4-8487-9b92e66852a1",
        "snapshot": false,
        "version": "8.2.0"
    },
    "event": {
        "agent_id_status": "verified",
        "category": "web",
        "dataset": "websphere_application_server.jdbc",
        "duration": 364066933,
        "ingested": "2022-05-19T13:33:04Z",
        "kind": "metric",
        "module": "websphere_application_server",
        "type": "info"
    },
    "host": {
        "architecture": "x86_64",
        "containerized": true,
        "hostname": "docker-fleet-agent",
        "ip": [
            "172.31.0.5"
        ],
        "mac": [
            "02-42-C0-A8-FB-04"
        ],
        "name": "docker-fleet-agent",
        "os": {
            "codename": "focal",
            "family": "debian",
            "kernel": "3.10.0-1160.45.1.el7.x86_64",
            "name": "Ubuntu",
            "platform": "ubuntu",
            "type": "linux",
            "version": "20.04.4 LTS (Focal Fossa)"
        }
    },
    "metricset": {
        "name": "collector",
        "period": 60000
    },
    "server": {
        "address": "elastic-package-service_websphere_application_server_1:9080"
    },
    "service": {
        "address": "http://elastic-package-service_websphere_application_server_1:9080/metrics",
        "type": "prometheus"
    },
    "tags": [
        "websphere_application_server-jdbc",
        "prometheus"
    ],
    "websphere_application_server": {
        "jdbc": {
            "connection": {
                "allocated": 0,
                "closed": 0,
                "created": 0,
                "free": 0,
                "handles": 0,
                "managed": 0,
                "returned": 0,
                "total": {
                    "fault": 0,
                    "in_use": 0,
                    "seconds_in_use": 0,
                    "wait": 0,
                    "wait_seconds": 0
                },
                "waiting_threads": 0
            },
            "data_source": "jms/built-in-jms-connectionfactory",
            "percent_used": 0,
            "pool_size": 0
        }
    }
}
ECS Field Reference
Please refer to the following document for detailed information on ECS fields.
Exported fields
| Field | Description | Type |
|---|---|---|
| @timestamp | Event timestamp. | date |
| data_stream.dataset | Data stream dataset. | constant_keyword |
| data_stream.namespace | Data stream namespace. | constant_keyword |
| data_stream.type | Data stream type. | constant_keyword |
| event.category | Event category. | constant_keyword |
| event.dataset | Event dataset. | constant_keyword |
| event.kind | Event kind | constant_keyword |
| event.module | Event module | constant_keyword |
| event.type | Event type | constant_keyword |
| websphere_application_server.jdbc.connection.allocated | The total number of connections that were allocated. | long |
| websphere_application_server.jdbc.connection.closed | The total number of connections that were closed. | long |
| websphere_application_server.jdbc.connection.created | The total number of connections that were created. | long |
| websphere_application_server.jdbc.connection.free | The number of free connections in the pool. | long |
| websphere_application_server.jdbc.connection.handles | The number of Connection objects in use for a particular connection pool. The number applies to V5.0 data sources only. | long |
| websphere_application_server.jdbc.connection.managed | The number of ManagedConnection objects that are in use for a particular connection pool. The number applies to V5.0 data sources only. | long |
| websphere_application_server.jdbc.connection.returned | The total number of connections that were returned to the pool. | long |
| websphere_application_server.jdbc.connection.total.fault | The number of connection timeouts in the pool. | long |
| websphere_application_server.jdbc.connection.total.in_use | The total number of times that a connection was in use. | long |
| websphere_application_server.jdbc.connection.total.operations_calls | The number of JDBC calls. | long |
| websphere_application_server.jdbc.connection.total.operations_seconds | The total time (in seconds) that was spent running the JDBC calls, including the time spent in the JDBC driver, network, and database. The total time applies to V5.0 data sources only. | double |
| websphere_application_server.jdbc.connection.total.seconds_in_use | The total time (in seconds) that a connection was used. The total time is difference between the time at which the connection is allocated and returned. This value includes the JBDC operation time. | double |
| websphere_application_server.jdbc.connection.total.wait | The number of times a request was waited for a connection to be granted. | long |
| websphere_application_server.jdbc.connection.total.wait_seconds | The total wait time (in seconds) until a connection is granted. | double |
| websphere_application_server.jdbc.connection.waiting_threads | The number of threads that are concurrently waiting for a connection. | long |
| websphere_application_server.jdbc.data_source | Name of data source. | keyword |
| websphere_application_server.jdbc.percent_used | Percent of the pool that was in use. The value is based on the total number of configured connections in the ConnectionPool, not the current number of connections. | long |
| websphere_application_server.jdbc.pool_size | The size of the connection pool. | long |
| websphere_application_server.jdbc.total_cache_discarded | The number of statements that were discarded because the cache is full. | long |
This data stream collects Servlet related metrics.
Example
{
    "@timestamp": "2022-05-20T11:44:31.768Z",
    "agent": {
        "ephemeral_id": "2cc9ade1-a44e-4151-91bf-1e4865a9e57e",
        "id": "c05318bf-e468-4a7a-bd1d-7c7e4320cbde",
        "name": "docker-fleet-agent",
        "type": "metricbeat",
        "version": "8.2.0"
    },
    "data_stream": {
        "dataset": "websphere_application_server.servlet",
        "namespace": "ep",
        "type": "metrics"
    },
    "ecs": {
        "version": "8.11.0"
    },
    "elastic_agent": {
        "id": "c05318bf-e468-4a7a-bd1d-7c7e4320cbde",
        "snapshot": false,
        "version": "8.2.0"
    },
    "event": {
        "agent_id_status": "verified",
        "category": "web",
        "dataset": "websphere_application_server.servlet",
        "duration": 153850315,
        "ingested": "2022-05-20T11:44:35Z",
        "kind": "metric",
        "module": "websphere_application_server",
        "type": "info"
    },
    "host": {
        "architecture": "x86_64",
        "containerized": true,
        "hostname": "docker-fleet-agent",
        "ip": [
            "192.168.112.7"
        ],
        "mac": [
            "02-42-C0-A8-FB-04"
        ],
        "name": "docker-fleet-agent",
        "os": {
            "codename": "focal",
            "family": "debian",
            "kernel": "3.10.0-1160.45.1.el7.x86_64",
            "name": "Ubuntu",
            "platform": "ubuntu",
            "type": "linux",
            "version": "20.04.4 LTS (Focal Fossa)"
        }
    },
    "metricset": {
        "name": "collector",
        "period": 60000
    },
    "server": {
        "address": "elastic-package-service_websphere_application_server_1:9080"
    },
    "service": {
        "address": "http://elastic-package-service_websphere_application_server_1:9080/metrics",
        "type": "prometheus"
    },
    "tags": [
        "websphere_application_server-servlet",
        "prometheus"
    ],
    "websphere_application_server": {
        "servlet": {
            "app_name": "isclite#isclite.war",
            "loaded": 0,
            "reloaded": 0
        }
    }
}
ECS Field Reference
Please refer to the following document for detailed information on ECS fields.
Exported fields
| Field | Description | Type |
|---|---|---|
| @timestamp | Event timestamp. | date |
| data_stream.dataset | Data stream dataset. | constant_keyword |
| data_stream.namespace | Data stream namespace. | constant_keyword |
| data_stream.type | Data stream type. | constant_keyword |
| event.category | Event category. | constant_keyword |
| event.dataset | Event dataset. | constant_keyword |
| event.kind | Event kind | constant_keyword |
| event.module | Event module | constant_keyword |
| event.type | Event type | constant_keyword |
| websphere_application_server.servlet.app_name | Application name. | keyword |
| websphere_application_server.servlet.async_context.response_time_seconds | The total time spent (in seconds) per servlet for the AsyncContext response to complete. | double |
| websphere_application_server.servlet.async_context.responses.total | The total number of AsyncContext responses for the specified URL. | long |
| websphere_application_server.servlet.errors | Number of errors that were generated while responding to a request. | long |
| websphere_application_server.servlet.loaded | The number of servlets that were loaded. | long |
| websphere_application_server.servlet.reloaded | The number of servlets that were reloaded. | long |
| websphere_application_server.servlet.requests.concurrent | Number of concurrent requests sent to the servlet. | long |
| websphere_application_server.servlet.requests.processed | The total number of requests that a servlet processed. | long |
| websphere_application_server.servlet.response_time_seconds | The total response time (in seconds) to process servlet requests. | double |
| websphere_application_server.servlet.responses.processed | The total number of responses that a servlet processed. | long |
| websphere_application_server.servlet.uri.async_context.response_time_seconds | The total time spent (in seconds) per URL for the AsyncContext response to complete. | double |
| websphere_application_server.servlet.uri.async_context.responses.total | The total number of AsyncContext responses for the specified URL. | long |
| websphere_application_server.servlet.uri.requests.concurrent | The number of requests that were concurrently processed for the specified URL. | long |
| websphere_application_server.servlet.uri.requests.total | Total number of requests that a servlet processed for the specified URL. | long |
| websphere_application_server.servlet.uri.response_time_seconds | The total response time (in seconds) to process the requests for the specified URL. | double |
| websphere_application_server.servlet.uri.responses.total | The total number of responses for the specified URL. | long |
This data stream collects metrics related to Sessions.
Example
{
    "@timestamp": "2022-05-25T10:02:02.554Z",
    "agent": {
        "ephemeral_id": "ce98e7b5-b605-42ae-bc3e-93dfe4989d2b",
        "id": "9a7dfaf6-d476-47ba-8a87-e7196ca4d0a3",
        "name": "docker-fleet-agent",
        "type": "metricbeat",
        "version": "8.2.0"
    },
    "data_stream": {
        "dataset": "websphere_application_server.session_manager",
        "namespace": "ep",
        "type": "metrics"
    },
    "ecs": {
        "version": "8.11.0"
    },
    "elastic_agent": {
        "id": "9a7dfaf6-d476-47ba-8a87-e7196ca4d0a3",
        "snapshot": false,
        "version": "8.2.0"
    },
    "event": {
        "agent_id_status": "verified",
        "category": "web",
        "dataset": "websphere_application_server.session_manager",
        "duration": 35233763,
        "ingested": "2022-05-25T10:02:06Z",
        "kind": "metric",
        "module": "websphere_application_server",
        "type": "info"
    },
    "host": {
        "architecture": "x86_64",
        "containerized": true,
        "hostname": "docker-fleet-agent",
        "ip": [
            "192.168.240.6"
        ],
        "mac": [
            "02-42-C0-A8-FB-04"
        ],
        "name": "docker-fleet-agent",
        "os": {
            "codename": "focal",
            "family": "debian",
            "kernel": "3.10.0-1160.45.1.el7.x86_64",
            "name": "Ubuntu",
            "platform": "ubuntu",
            "type": "linux",
            "version": "20.04.4 LTS (Focal Fossa)"
        }
    },
    "metricset": {
        "name": "collector",
        "period": 60000
    },
    "server": {
        "address": "elastic-package-service_websphere_application_server_1:9080"
    },
    "service": {
        "address": "http://elastic-package-service_websphere_application_server_1:9080/metrics",
        "type": "prometheus"
    },
    "tags": [
        "websphere_application_server-session_manager",
        "prometheus"
    ],
    "websphere_application_server": {
        "session_manager": {
            "activated_non_existent_sessions": 0,
            "affinity_breaks": 0,
            "app_name": "ibmasyncrsp#ibmasyncrsp.war",
            "cache_discarded": 0,
            "external": {
                "bytes": {
                    "read": 0,
                    "written": 0
                },
                "time_seconds": {
                    "read": 0,
                    "written": 0
                }
            },
            "no_room_for_new_sessions": 0,
            "persistent_stores": {
                "data_read": 0,
                "data_written": 0
            },
            "sessions": {
                "active": 0,
                "created": 0,
                "current": 0,
                "invalidated": {
                    "by_timeouts": 0,
                    "total": 0
                },
                "life_time": 0
            },
            "time_since_session_last_activated": 0
        }
    }
}
ECS Field Reference
Please refer to the following document for detailed information on ECS fields.
Exported fields
| Field | Description | Type |
|---|---|---|
| @timestamp | Event timestamp. | date |
| data_stream.dataset | Data stream dataset. | constant_keyword |
| data_stream.namespace | Data stream namespace. | constant_keyword |
| data_stream.type | Data stream type. | constant_keyword |
| event.category | Event category. | constant_keyword |
| event.dataset | Event dataset. | constant_keyword |
| event.kind | Event kind | constant_keyword |
| event.module | Event module | constant_keyword |
| event.type | Event type | constant_keyword |
| websphere_application_server.session_manager.activated_non_existent_sessions | The number of non-existent sessions that are activated. | long |
| websphere_application_server.session_manager.affinity_breaks | The number of session affinity breaks. | long |
| websphere_application_server.session_manager.app_name | Name of the Application. | keyword |
| websphere_application_server.session_manager.cache_discarded | The number of times the cache was discarded. | long |
| websphere_application_server.session_manager.external.bytes.read | Size of the session data (in bytes) read from persistent stores. This size is applicable only for serialized persistent sessions and similar to the externalReadTime field. | long |
| websphere_application_server.session_manager.external.bytes.written | Size of the session data (in bytes) written to persistent stores. | long |
| websphere_application_server.session_manager.external.time_seconds.read | Time (in seconds) taken to read the session data from persistent store. For the Multirow session, the metrics are for the attribute; for the SingleRow session the metrics are for the whole session. The time is applicable only for persistent sessions. When you use a JMS persistent store, if you choose not to serialize the data, the counter is not available. | long |
| websphere_application_server.session_manager.external.time_seconds.written | Time (in seconds) taken to write the session data from persistent stores. This time is applicable only for (serialized) persistent sessions and is similar to the externalReadTime field. | long |
| websphere_application_server.session_manager.no_room_for_new_sessions | The number of times a request for a new session cannot be handled because this value exceeds the maximum session count. | long |
| websphere_application_server.session_manager.persistent_stores.data_read | Total number of times the session data was read from persistent stores. | long |
| websphere_application_server.session_manager.persistent_stores.data_written | Total number of times the session data being written to persistent store. | long |
| websphere_application_server.session_manager.sessions.active | The number of sessions that are currently accessed by requests. | long |
| websphere_application_server.session_manager.sessions.created | The number of sessions that were created by the server. | long |
| websphere_application_server.session_manager.sessions.current | The number of live sessions till date. | long |
| websphere_application_server.session_manager.sessions.invalidated.by_timeouts | The number of sessions that were invalidated by timeouts. | long |
| websphere_application_server.session_manager.sessions.invalidated.total | The total number of sessions that were invalidated. | long |
| websphere_application_server.session_manager.sessions.life_time | Life time of the session. | double |
| websphere_application_server.session_manager.time_since_session_last_activated | Time since this session was last activated. | double |
This data stream collects Thread related metrics.
Example
{
    "@timestamp": "2022-05-25T05:29:29.876Z",
    "agent": {
        "ephemeral_id": "89977a47-6584-45ca-acf9-b0fcdf8c5ee0",
        "id": "37bf4307-b56f-4bf5-9f94-5a2ab9cf49f0",
        "name": "docker-fleet-agent",
        "type": "metricbeat",
        "version": "8.2.0"
    },
    "data_stream": {
        "dataset": "websphere_application_server.threadpool",
        "namespace": "ep",
        "type": "metrics"
    },
    "ecs": {
        "version": "8.11.0"
    },
    "elastic_agent": {
        "id": "37bf4307-b56f-4bf5-9f94-5a2ab9cf49f0",
        "snapshot": false,
        "version": "8.2.0"
    },
    "event": {
        "agent_id_status": "verified",
        "category": "web",
        "dataset": "websphere_application_server.threadpool",
        "duration": 417718741,
        "ingested": "2022-05-25T05:29:33Z",
        "kind": "metric",
        "module": "websphere_application_server",
        "type": "info"
    },
    "host": {
        "architecture": "x86_64",
        "containerized": true,
        "hostname": "docker-fleet-agent",
        "ip": [
            "192.168.144.7"
        ],
        "mac": [
            "02-42-C0-A8-FB-04"
        ],
        "name": "docker-fleet-agent",
        "os": {
            "codename": "focal",
            "family": "debian",
            "kernel": "3.10.0-1160.45.1.el7.x86_64",
            "name": "Ubuntu",
            "platform": "ubuntu",
            "type": "linux",
            "version": "20.04.4 LTS (Focal Fossa)"
        }
    },
    "metricset": {
        "name": "collector",
        "period": 60000
    },
    "server": {
        "address": "elastic-package-service_websphere_application_server_1:9080"
    },
    "service": {
        "address": "http://elastic-package-service_websphere_application_server_1:9080/metrics",
        "type": "prometheus"
    },
    "tags": [
        "websphere_application_server-threadpool",
        "prometheus"
    ],
    "websphere_application_server": {
        "threadpool": {
            "active_time_seconds": 0,
            "name": "AriesThreadPool",
            "threads": {
                "active": 0,
                "cleared": 0,
                "stopped": {
                    "concurrent": 0,
                    "declared": 0
                },
                "total": 0
            },
            "total": {
                "active": 0,
                "created": 0,
                "destroyed": 0
            }
        }
    }
}
ECS Field Reference
Please refer to the following document for detailed information on ECS fields.
Exported fields
| Field | Description | Type |
|---|---|---|
| @timestamp | Event timestamp. | date |
| data_stream.dataset | Data stream dataset. | constant_keyword |
| data_stream.namespace | Data stream namespace. | constant_keyword |
| data_stream.type | Data stream type. | constant_keyword |
| event.category | Event category. | constant_keyword |
| event.dataset | Event dataset. | constant_keyword |
| event.kind | Event kind | constant_keyword |
| event.module | Event module | constant_keyword |
| event.type | Event type | constant_keyword |
| websphere_application_server.threadpool.active_time_seconds | The total time (in seconds) that the threads are in active state. | double |
| websphere_application_server.threadpool.name | Name of ThreadPool. | keyword |
| websphere_application_server.threadpool.threads.active | The number of concurrently active threads. | long |
| websphere_application_server.threadpool.threads.cleared | The number of thread stops that cleared. | long |
| websphere_application_server.threadpool.threads.stopped.concurrent | The number of concurrently stopped threads. | long |
| websphere_application_server.threadpool.threads.stopped.declared | The number of threads that were declared stopped. | long |
| websphere_application_server.threadpool.threads.total | The number of threads in a pool. | long |
| websphere_application_server.threadpool.total.active | The number of threads that were active. | long |
| websphere_application_server.threadpool.total.created | The total number of threads that were created. | long |
| websphere_application_server.threadpool.total.destroyed | The total number of threads that were destroyed. | long |
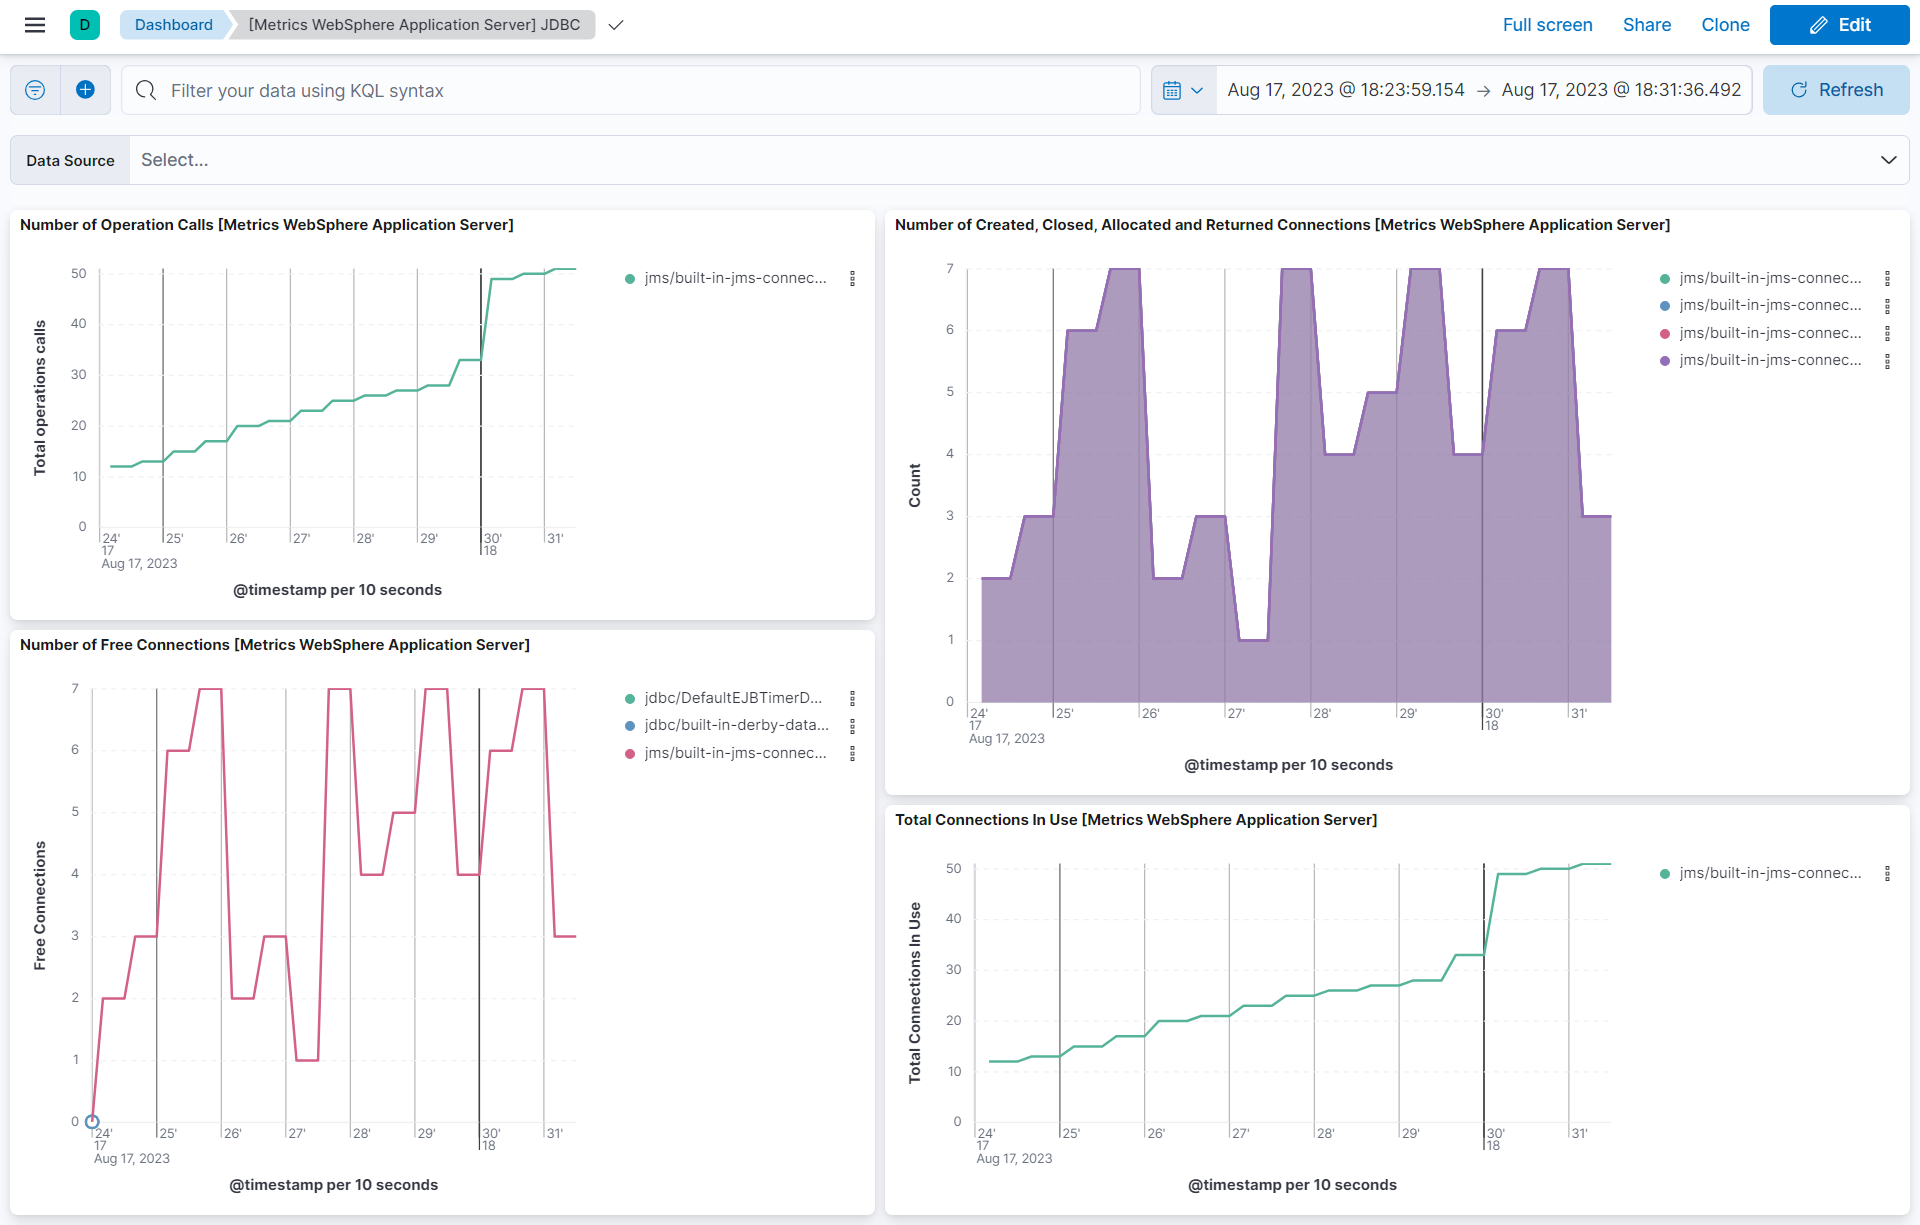
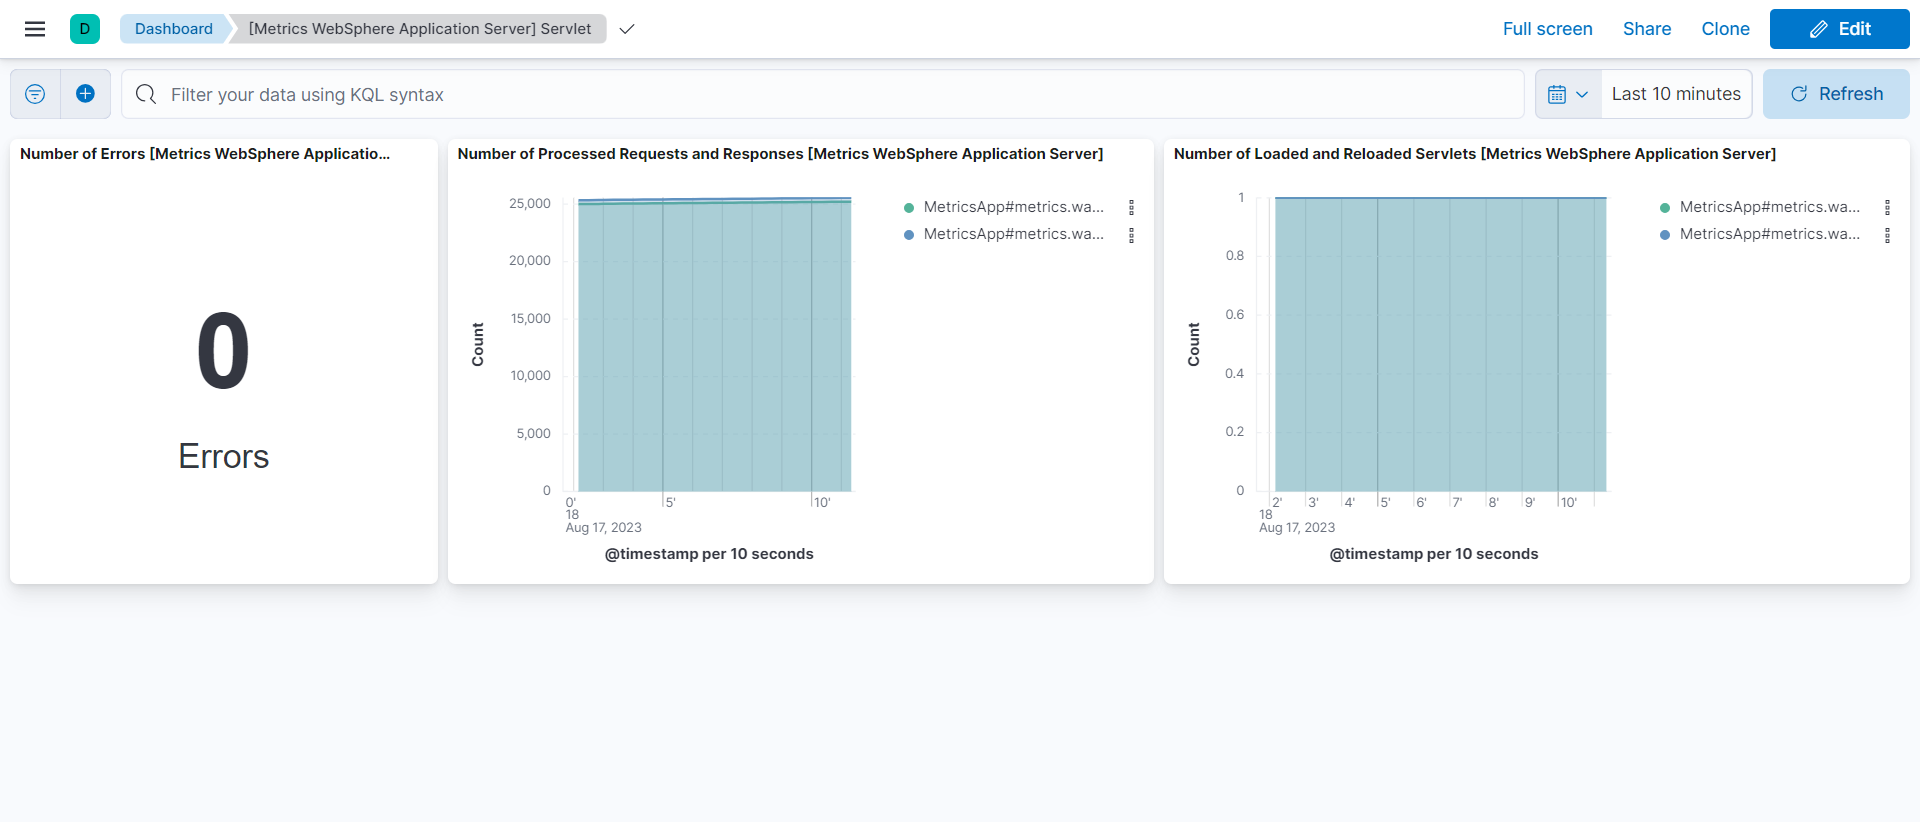
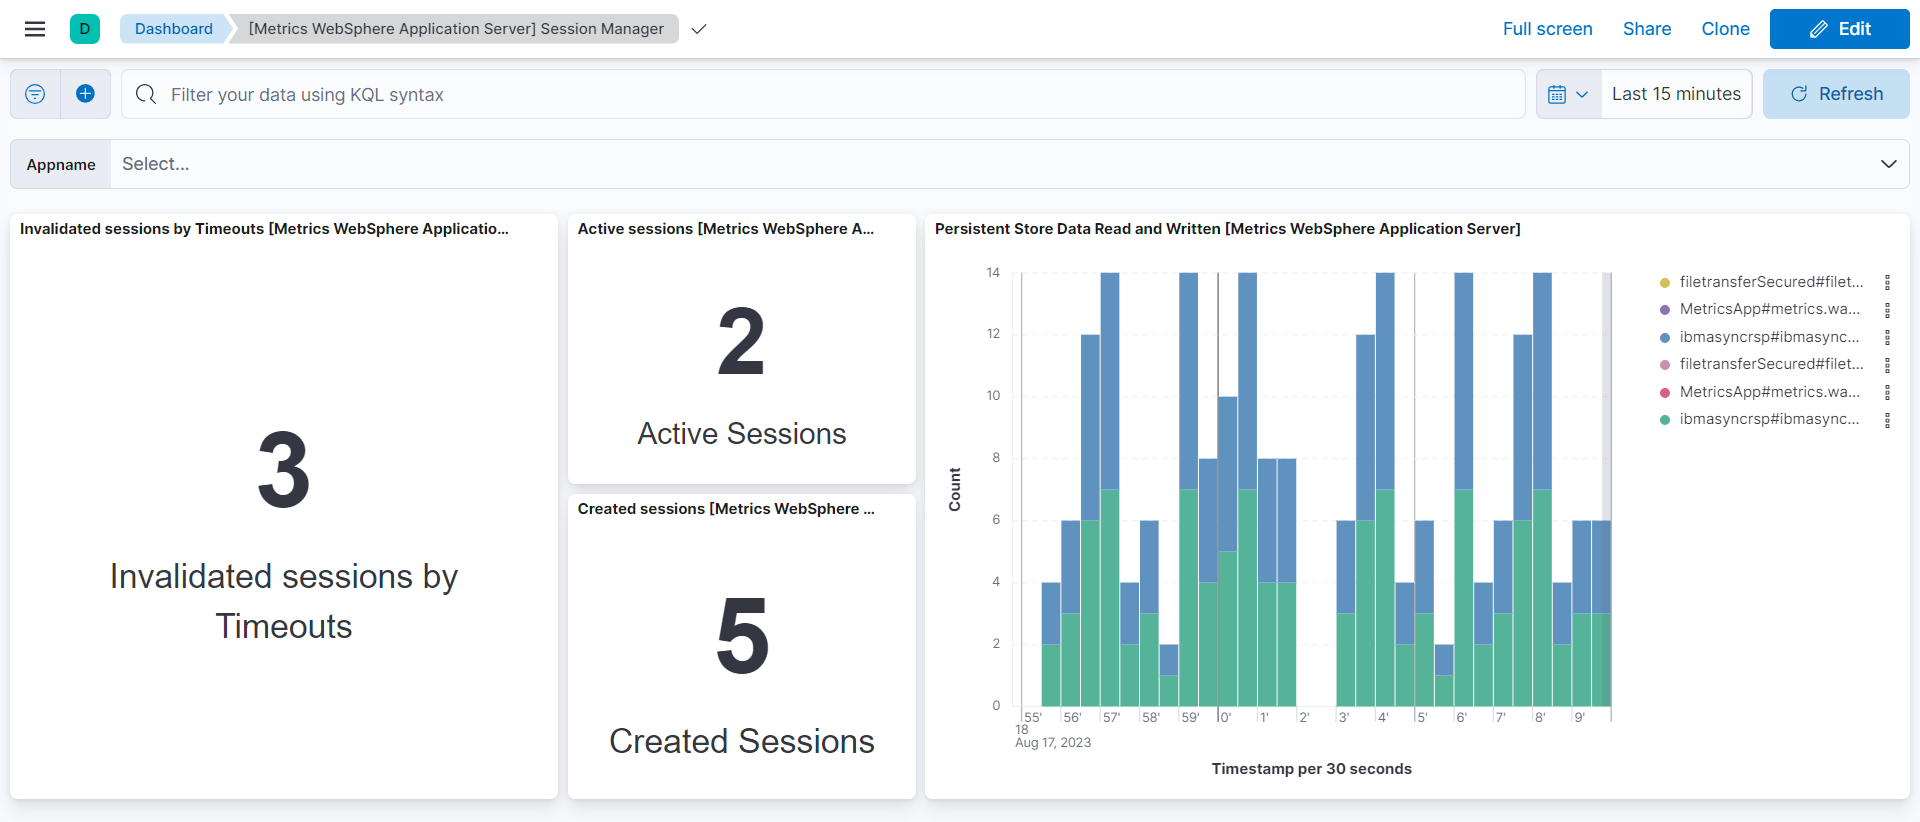
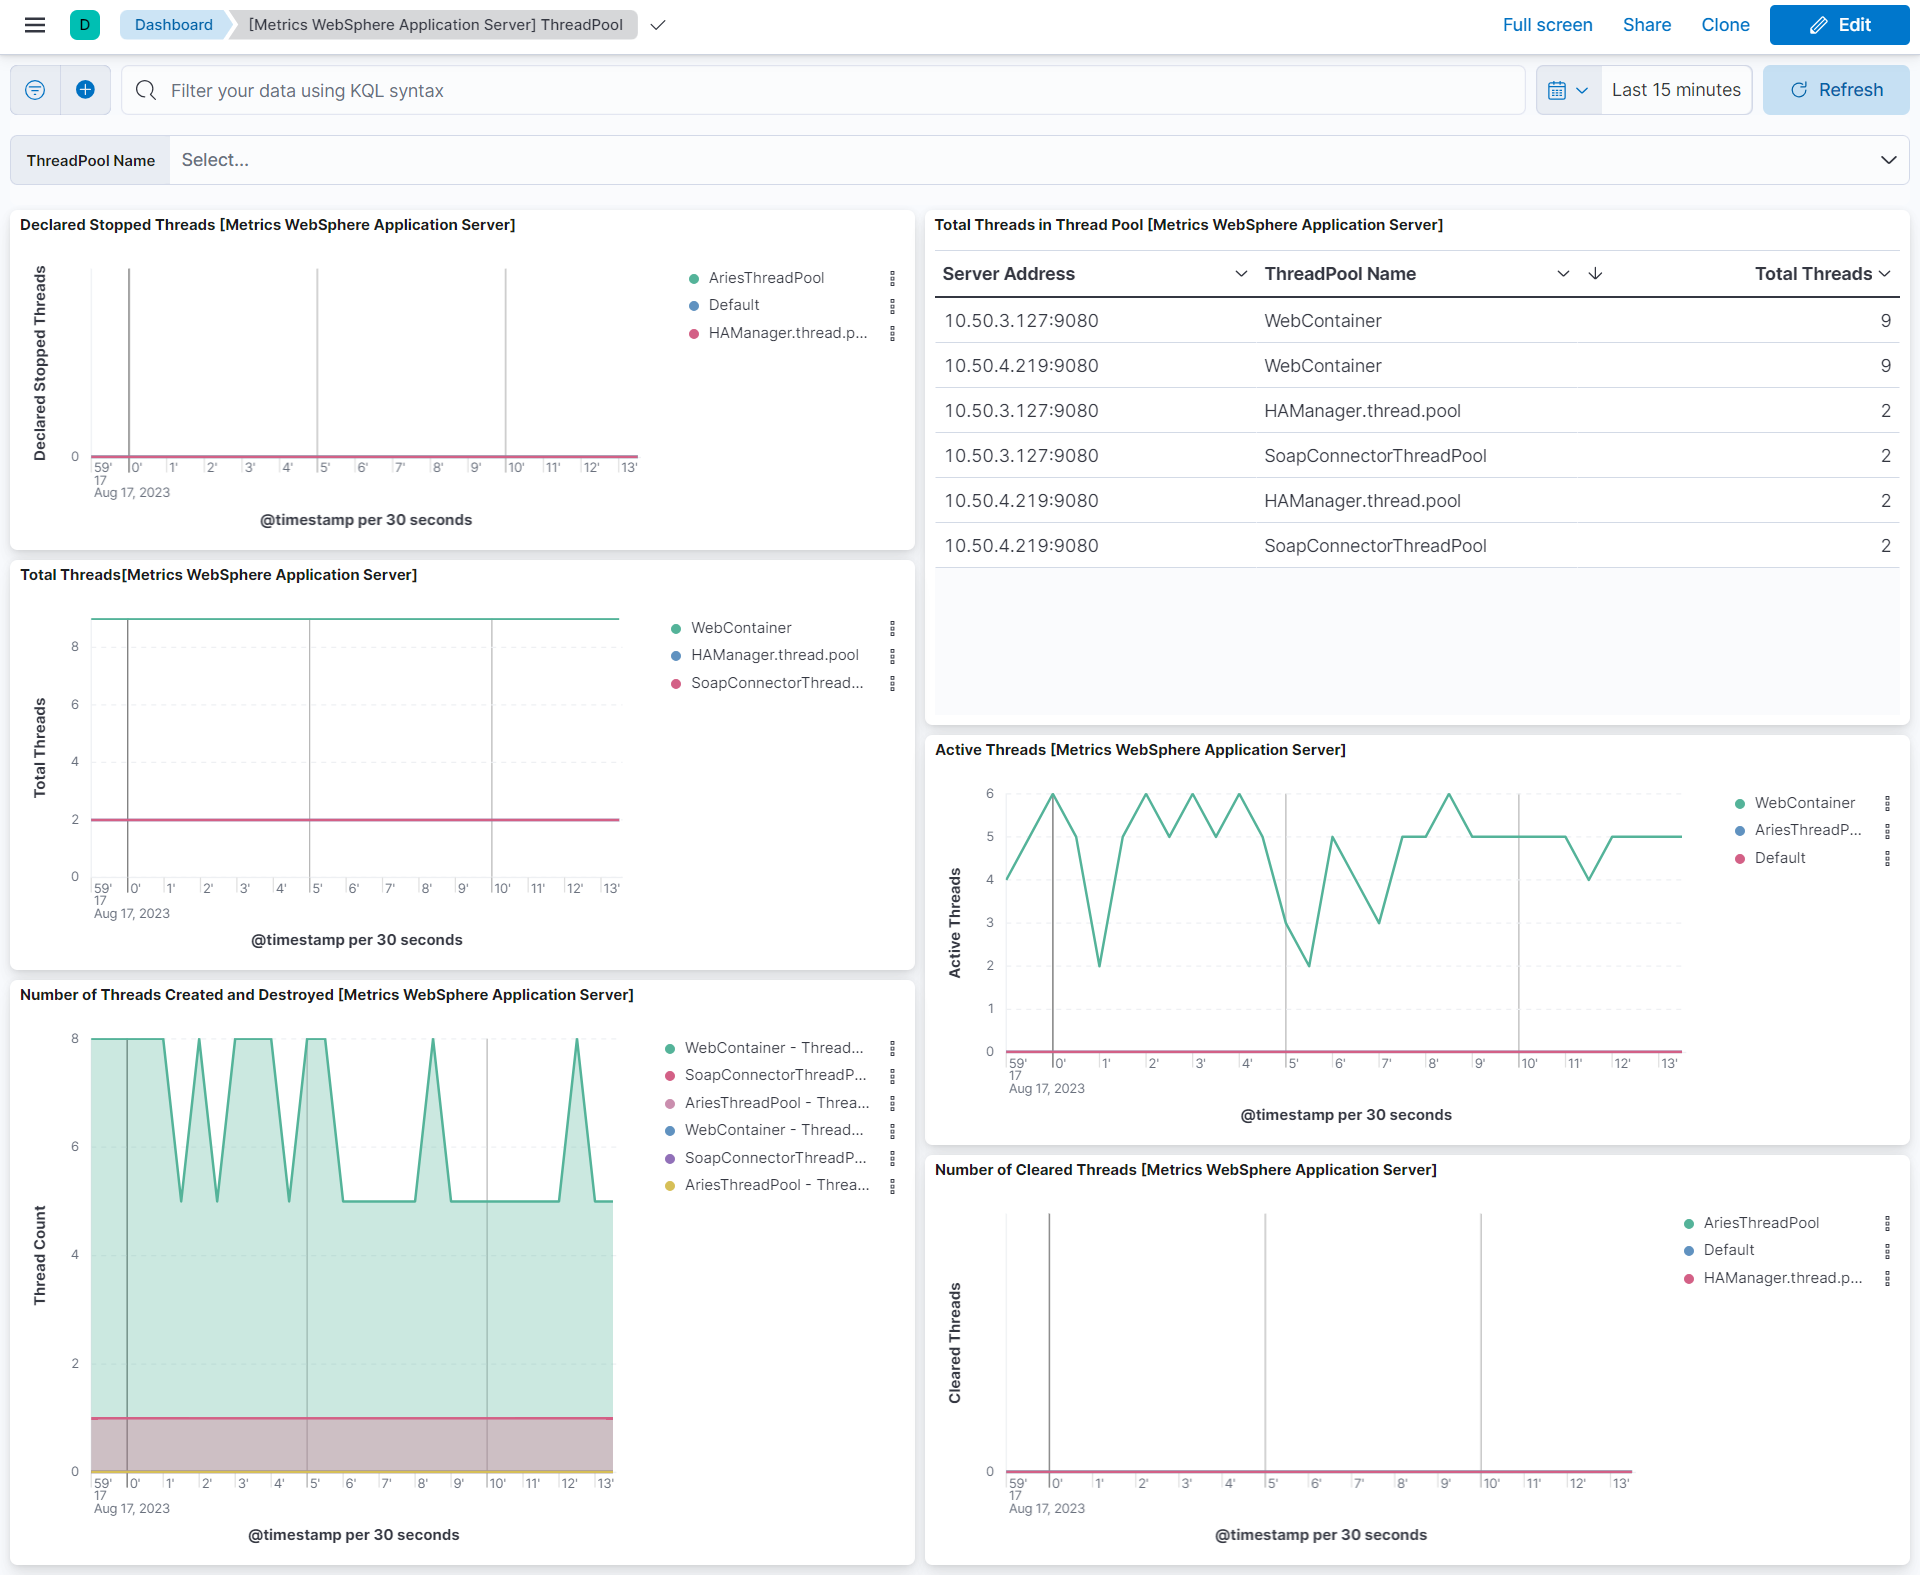
This integration includes one or more Kibana dashboards that visualizes the data collected by the integration. The screenshots below illustrate how the ingested data is displayed.
Changelog
| Version | Details | Minimum Kibana version |
|---|---|---|
| 1.6.1 | Bug fix (View pull request) Added description to ssl nodes in package level manifest.yml file to including links to documentation. |
9.0.0 8.13.0 |
| 1.6.0 | Enhancement (View pull request) Add support for Kibana 9.0.0. |
9.0.0 8.13.0 |
| 1.5.0 | Enhancement (View pull request) ECS version updated to 8.11.0. Update the kibana constraint to ^8.13.0. Modified the field definitions to remove ECS fields made redundant by the ecs@mappings component template. |
8.13.0 |
| 1.4.0 | Enhancement (View pull request) Add global filter on data_stream.dataset to improve performance. |
8.12.0 |
| 1.3.0 | Enhancement (View pull request) Enable secrets for sensitive fields. For more details, refer https://www.elastic.co/guide/en/fleet/current/agent-policy.html#agent-policy-secret-values |
8.12.0 |
| 1.2.1 | Bug fix (View pull request) Disable secrets for older stack versions due to errors. |
8.3.0 |
| 1.2.0 | Enhancement (View pull request) Enable 'secret' for the sensitive fields, supported from 8.12. |
8.3.0 |
| 1.1.1 | Enhancement (View pull request) Inline "by reference" visualizations |
8.3.0 |
| 1.1.0 | Enhancement (View pull request) Update the package format_version to 3.0.0. |
8.3.0 |
| 1.0.1 | Bug fix (View pull request) Remove forwarded tag from metrics data streams. |
8.3.0 |
| 1.0.0 | Enhancement (View pull request) Make WebSphere Application Server GA. |
8.3.0 |
| 0.9.1 | Bug fix (View pull request) Fix test failure by upgrading the docker image version to the latest. |
— |
| 0.9.0 | Enhancement (View pull request) Update dashboards, visualizations and screenshots. |
— |
| 0.8.1 | Bug fix (View pull request) Resolve the conflict in host.ip field. |
— |
| 0.8.0 | Enhancement (View pull request) Add compatibility section and update the title. |
— |
| 0.7.0 | Enhancement (View pull request) Rename ownership from obs-service-integrations to obs-infraobs-integrations |
— |
| 0.6.0 | Enhancement (View pull request) Migrate 'Session Manager' and 'Servlet' data-streams visualizations to lens. |
— |
| 0.5.0 | Enhancement (View pull request) Migrate threadpool data-stream visualizations to lens. |
— |
| 0.4.0 | Enhancement (View pull request) Migrate jdbc data-stream visualizations to lens. |
— |
| 0.3.1 | Enhancement (View pull request) Added categories and/or subcategories. |
— |
| 0.3.0 | Enhancement (View pull request) Update ECS version to 8.5.1 |
— |
| 0.2.0 | Enhancement (View pull request) Added infrastructure category. |
— |
| 0.1.1 | Enhancement (View pull request) WebSphere Application Server integration package with session_manager data stream. Enhancement (View pull request) WebSphere Application Server integration package with threadpool data stream. Enhancement (View pull request) WebSphere Application Server integration package with servlet data stream. |
— |
| 0.1.0 | Enhancement (View pull request) WebSphere Application Server integration package with jdbc data stream. |
— |


