Using OpenTelemetry
You can use OpenTelemetry to monitor the performance and behavior of your Elasticsearch requests through the Ruby Client. The Ruby Client comes with built-in OpenTelemetry instrumentation that emits distributed tracing spans by default. With that, applications instrumented with OpenTelemetry or using the OpenTelemetry Ruby SDK are inherently enriched with additional spans that contain insightful information about the execution of the Elasticsearch requests.
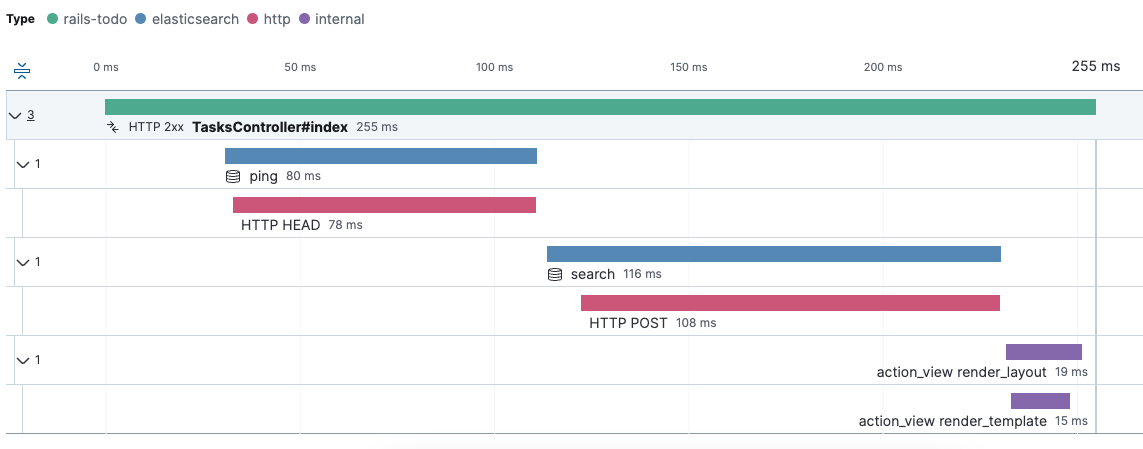
The native instrumentation in the Ruby Client follows the OpenTelemetry Semantic Conventions for Elasticsearch. In particular, the instrumentation in the client covers the logical layer of Elasticsearch requests. A single span per request is created that is processed by the service through the Ruby Client. The following image shows a trace that records the handling of two different Elasticsearch requests: a ping request and a search request.

Usually, OpenTelemetry auto-instrumentation modules come with instrumentation support for HTTP-level communication. In this case, in addition to the logical Elasticsearch client requests, spans will be captured for the physical HTTP requests emitted by the client. The following image shows a trace with both, Elasticsearch spans (in blue) and the corresponding HTTP-level spans (in red):

Advanced Ruby Client behavior such as nodes round-robin and request retries are revealed through the combination of logical Elasticsearch spans and the physical HTTP spans. The following example shows a search request in a scenario with two nodes:

The first node is unavailable and results in an HTTP error, while the retry to the second node succeeds. Both HTTP requests are subsumed by the logical Elasticsearch request span (in blue).
When using the OpenTelemetry Ruby SDK manually or using the OpenTelemetry Ruby Auto-Instrumentations, the Ruby Client’s OpenTelemetry instrumentation is enabled by default and uses the global OpenTelemetry SDK with the global tracer provider. You can provide a tracer provider via the Ruby Client configuration option opentelemetry_tracer_provider when instantiating the client. This is sometimes useful for testing or other specific use cases.
client = Elasticsearch::Client.new(
  cloud_id: '<CloudID>',
  api_key: '<ApiKey>',
  opentelemetry_tracer_provider: tracer_provider
)
You can configure the OpenTelemetry instrumentation through Environment Variables. The following configuration options are available.
With this configuration option you can enable (default) or disable the built-in OpenTelemetry instrumentation.
Default: true
| Environment Variable | OTEL_RUBY_INSTRUMENTATION_ELASTICSEARCH_ENABLED |
Per default, the built-in OpenTelemetry instrumentation does not capture request bodies due to data privacy considerations. You can use this option to enable capturing of search queries from the request bodies of Elasticsearch search requests in case you wish to gather this information regardless. The options are to capture the raw search query, sanitize the query with a default list of sensitive keys, or not capture it at all.
Default: omit
Valid Options: omit, sanitize, raw
| Environment Variable | OTEL_RUBY_INSTRUMENTATION_ELASTICSEARCH_CAPTURE_SEARCH_QUERY |
You can configure the list of keys whose values are redacted when the search query is captured. Values must be comma-separated. Note in v8.3.0 and v8.3.1, the environment variable OTEL_INSTRUMENTATION_ELASTICSEARCH_CAPTURE_SEARCH_QUERY was available but is now deprecated in favor of the environment variable including RUBY.
Default: nil
| Environment Variable | OTEL_RUBY_INSTRUMENTATION_ELASTICSEARCH_SEARCH_QUERY_SANITIZE_KEYS |
Example:
OTEL_RUBY_INSTRUMENTATION_ELASTICSEARCH_SEARCH_QUERY_SANITIZE_KEYS='sensitive-key,other-sensitive-key'
The OpenTelemetry instrumentation (as any other monitoring approach) may come with a slight overhead on CPU, memory, and/or latency. The overhead may only occur when the instrumentation is enabled (default) and an OpenTelemetry SDK is active in the target application. When the instrumentation is disabled or no OpenTelemetry SDK is active within the target application, monitoring overhead is not expected when using the client.
Even in cases where the instrumentation is enabled and is actively used (by an OpenTelemetry SDK), the overhead is minimal and negligible in the vast majority of cases. In edge cases where there is a noticeable overhead, the instrumentation can be explicitly disabled to eliminate any potential impact on performance.