Elastic Observability Labs
22 July 2026
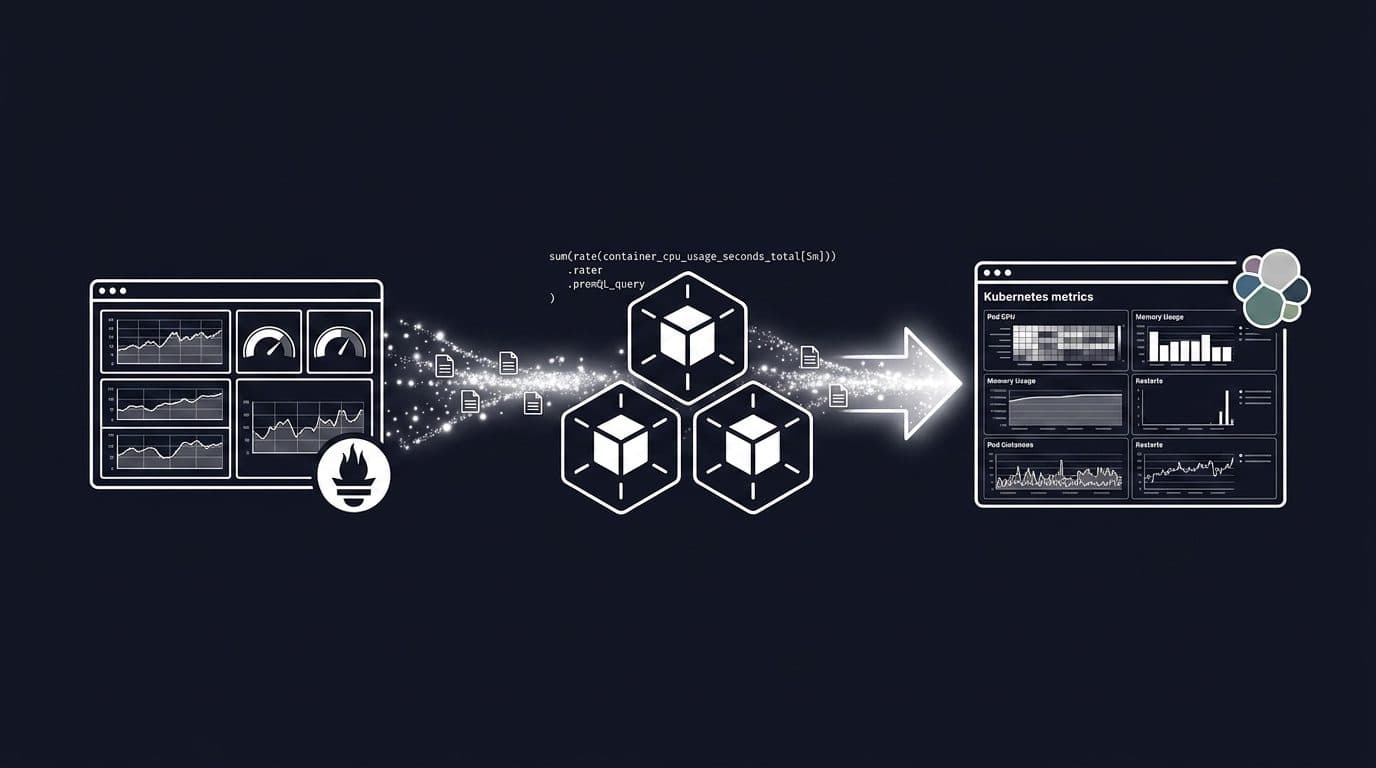
Migrate your Grafana Kubernetes dashboard to Elastic Observability: same PromQL, 30x faster queries
Take a real Grafana Kubernetes dashboard covering pod CPU, memory, node pressure, and restart counts, then migrate it into Elastic Observability with native PromQL in under an hour.
Featured


Elastic now alerts at 80% OpenAI rate limit usage, before your app gets throttled
OpenAI rate limit monitoring in Elastic maps headroom across every project and model. Compare configured RPM, TPM and IPM limits against real usage and plan capacity before a throttling alert fires.
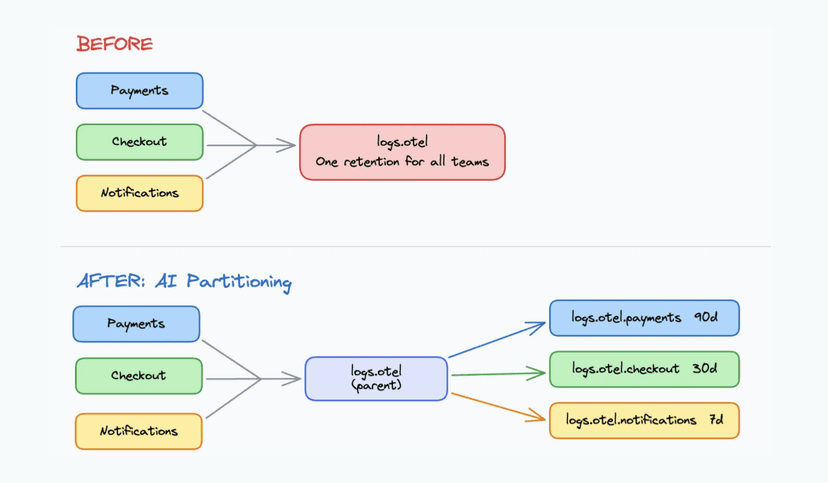
One OTLP endpoint, three teams, zero routing rules: Elasticsearch Streams AI Partitioning
Stop writing log routing rules upfront. See how Streams AI Partitioning reads your data, proposes child streams, and lets you set per-team retention in minutes.
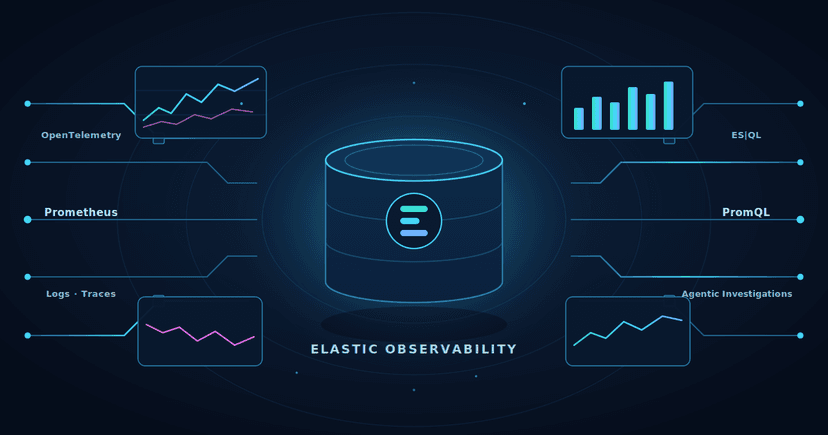
Elasticsearch: best-in-class for logs, now best-in-class for metrics
Elasticsearch is now best-in-class for metrics: 30× faster than Prometheus, up to 2.5× more storage-efficient, 50% less than Datadog. Learn about all the capabilities we’ve added.

Stop finding out about your Claude bill on invoice day: Anthropic API monitoring is now in Elastic
Track Anthropic API spend and rate limit headroom across every workspace, model, and service tier, so cost surprises and throttling stop being production-time discoveries.

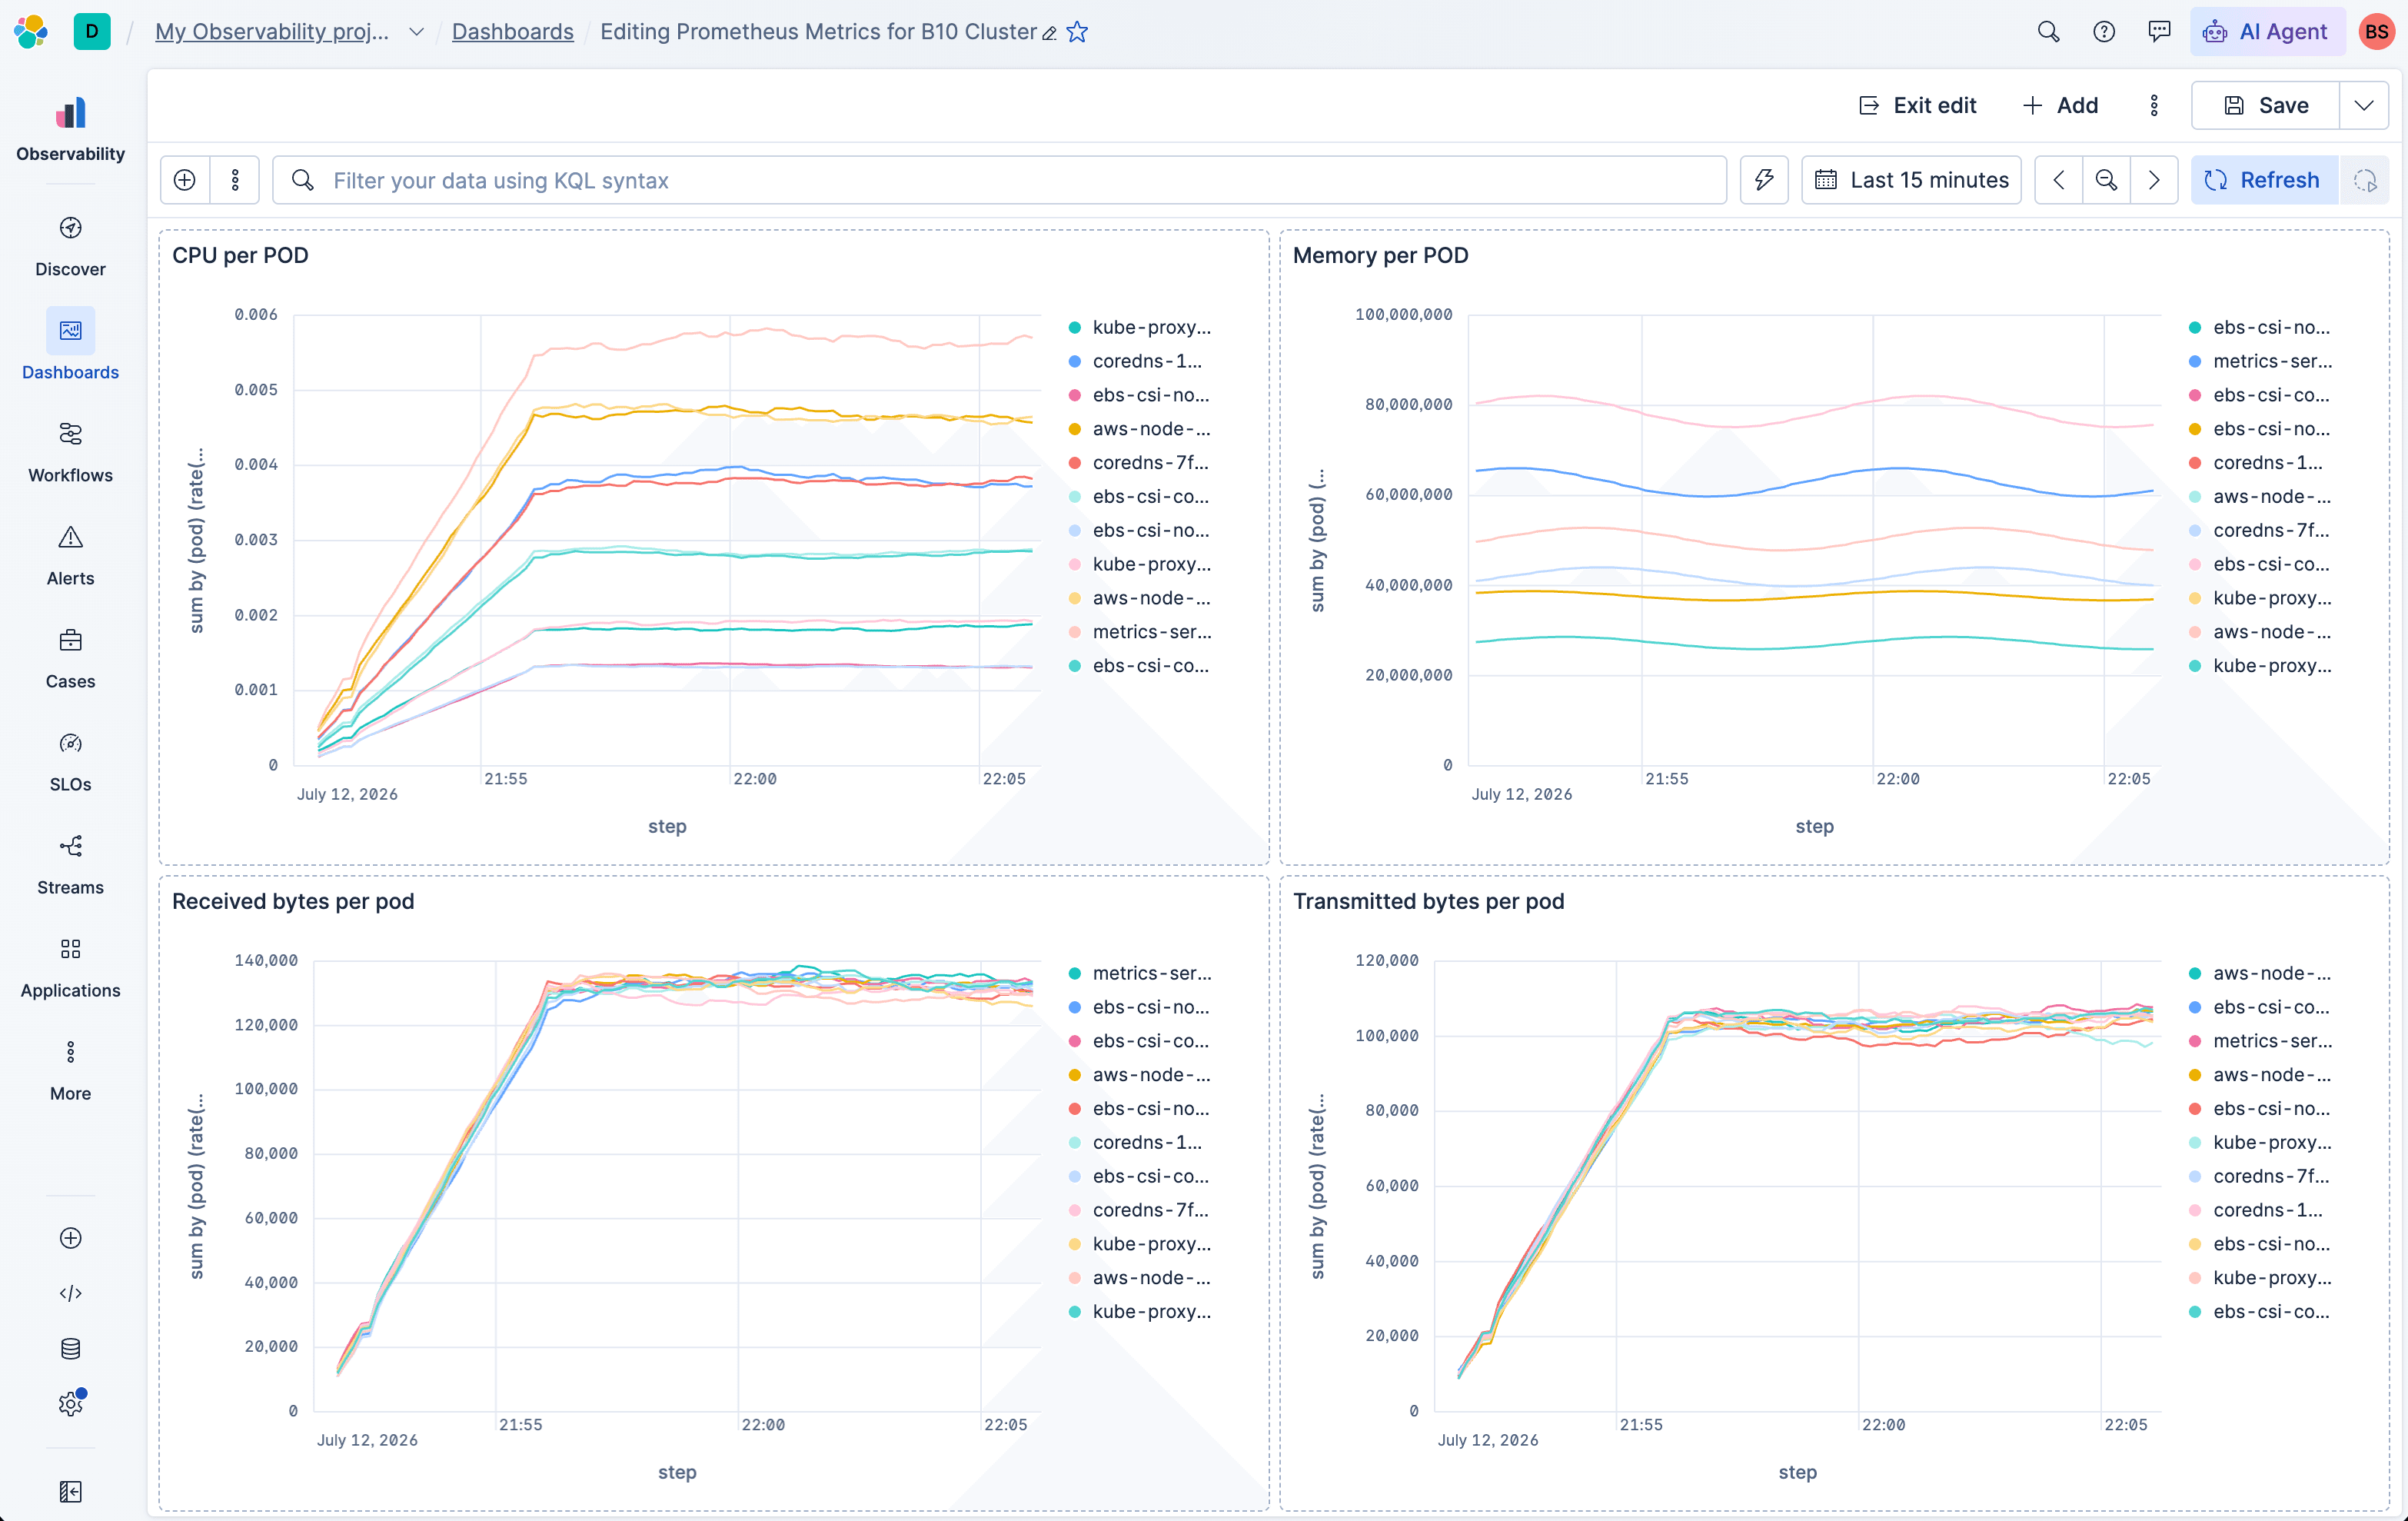
Use Elasticsearch as a Drop-In Prometheus Backend for Grafana
Use Elasticsearch as a Prometheus backend for Grafana dashboards, autocomplete, Metrics Drilldown, and alerting without changing PromQL workflows.
From alert to root cause in seconds: AI-powered observability with Elastic Agent Builder and Workflows
Elastic Agent Builder and Workflows replace dashboard hunting: one question surfaces the root cause, correlates metrics across weeks, and calculates business impact; then the workflow files the ticket.
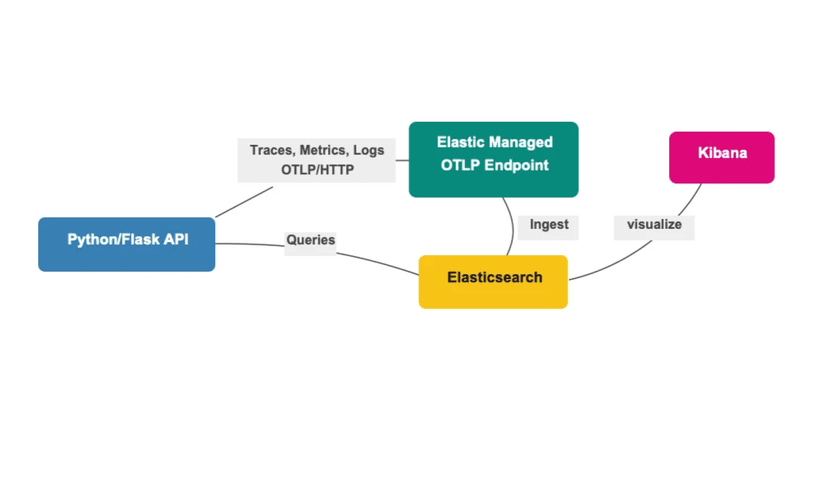
3 signals, 2 env vars, 0 collectors: OpenTelemetry with Python and Elastic's Managed OTLP Endpoint
Instrument a Flask API with OpenTelemetry and ship traces, metrics, and logs to Elastic Cloud using just 2 environment variables, no collector needed.
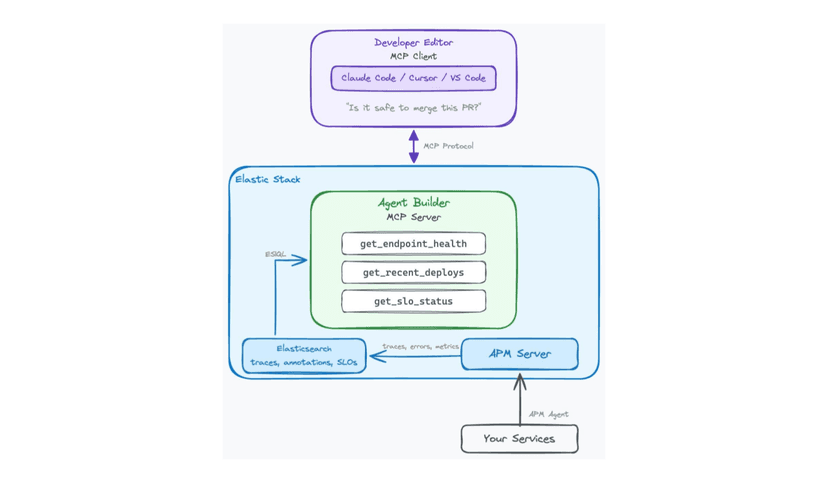
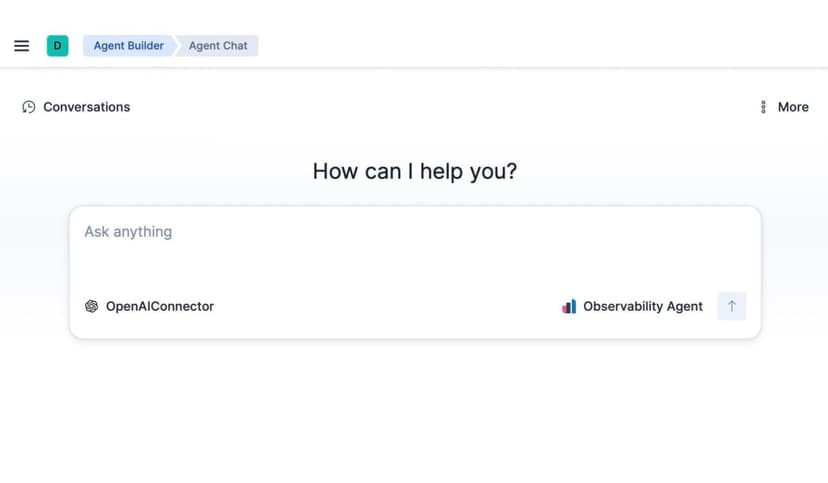
Contextual AI: Stop pinging the SRE: three MCP tools that turn Elastic Agent Builder into your team's runbook
Build three MCP tools in Elastic Agent Builder that read endpoint health, recent deploys and SLO burn rate directly in your editor. Encode your platform team's runbook once; every developer gets self-serve production context without pinging an SRE.

SNMP Topology Data in Kibana: Collection to Canvas
The Network Topology plugin for Kibana provides a ready-to-deploy Logstash pipeline, a structured schema, and a topology view that shows what's connected to what.

Configure downsampling directly in Elastic Streams, no more JSON editing needed
Configure downsampling in Elastic Streams alongside retention and tiers, with a live preview and validation. No more editing ILM or lifecycle JSON.
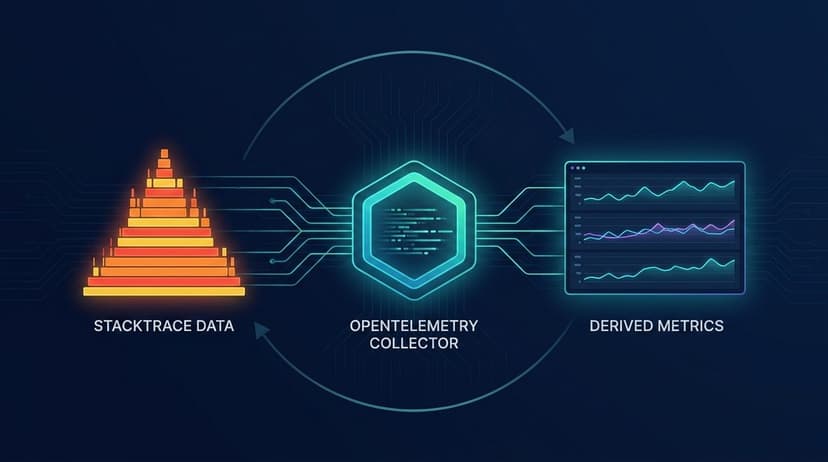
Self-Driving Observability: From Stacktraces to Profiling-Derived Metrics
Profiling-derived metrics turn raw stacktraces into time-series KPIs, unlock continuous profiling for every user and lay the foundation for an observability system that detects, investigates, and acts on its own.

Don't leave metrics on the table: query them with the ES|QL TS command
Recalibrate your mental model for time series queries: learn why FROM can produce inaccurate results for metrics, how TS fixes that, and when to use each command.