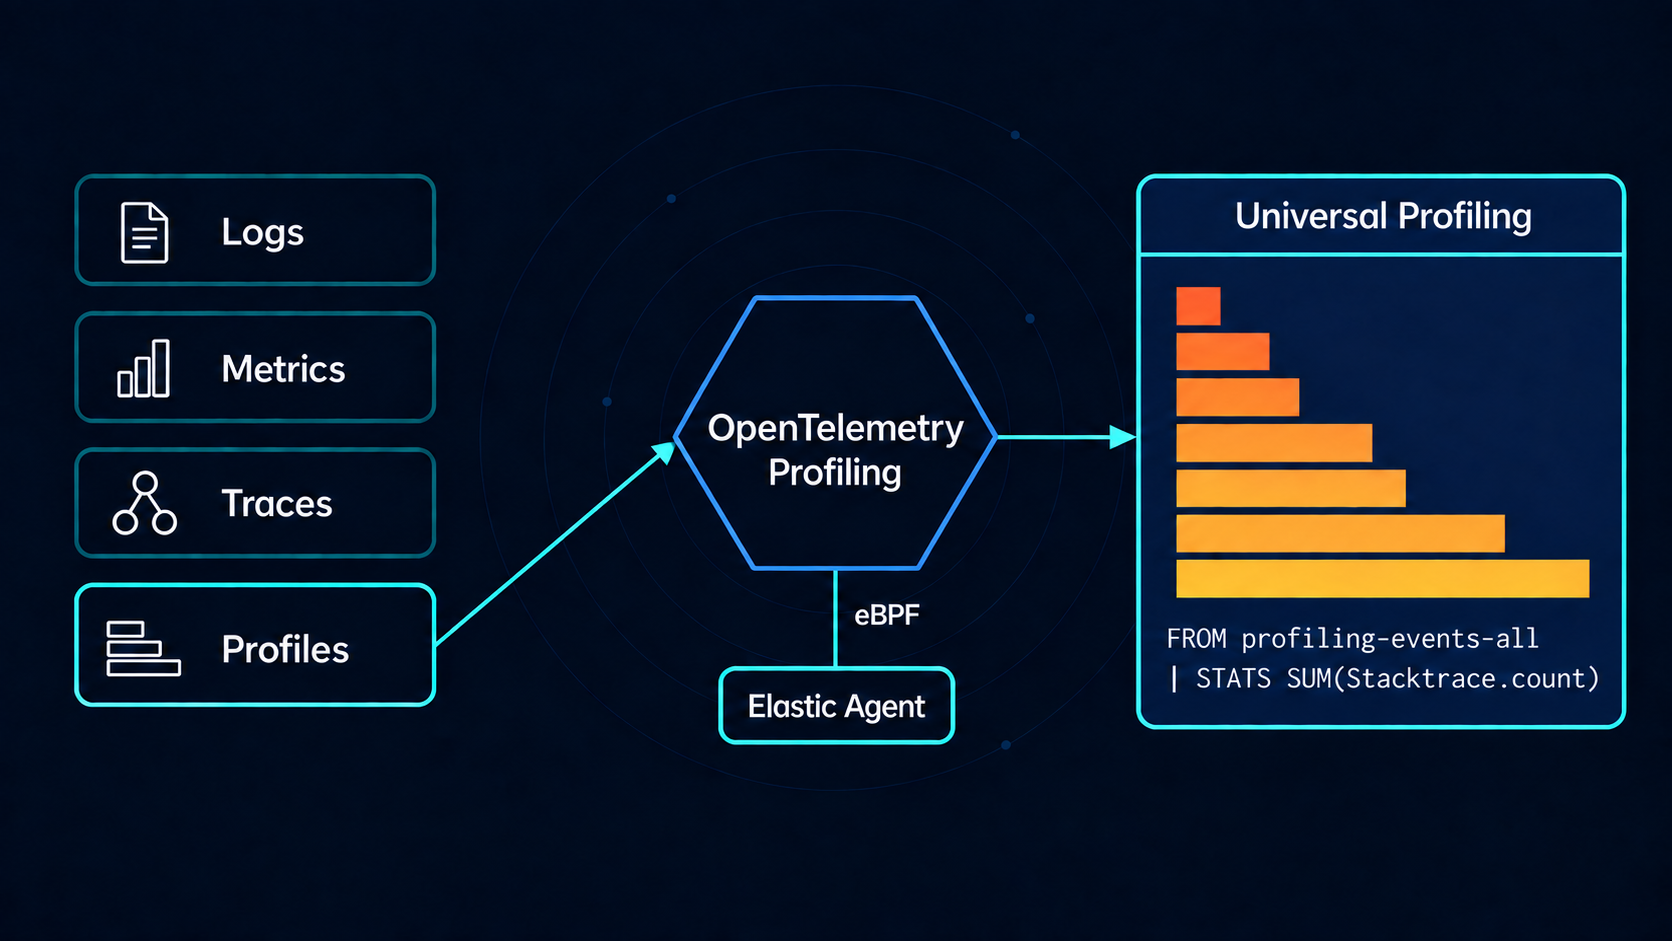
Your trace stops at the span; continuous profiling with OpenTelemetry doesn’t
Continuous profiling sampled an unmodified Java app serving 30,150 requests on a little over half a CPU core, with no code change and no restart.

One ES|QL query, 365 days of audit logs: Same search on hot data and searchable snapshots
Collect audit logs with the EDOT Collector, then confirm the 365-day retention policy actually applied before an auditor asks you to.

Kubernetes node pressure: Catching the memory drop 7 minutes before the first pod eviction
The pod you lose is rarely the pod that grew. This walkthrough follows a per-node anomaly detection alert all the way to the pod whose working set moved.

Kubernetes noisy neighbor in a multi-tenant cluster: Find it with ES|QL
Every pod was Running, and storefront requests under 500 ms still fell from 99.6% to 59%. ES|QL on kubelet metrics found a batch job taking 1.7 of the node's 2 cores, and a 500m cap brought the storefront back above 99%.

Automated root cause analysis for AWS: From a CloudWatch alert to a diagnosed incident in 36 seconds
We broke a live RDS instance with a connection leak, and the workflow came back with the Postgres refusals, the downstream 5xx and a root cause nobody had to write by hand.
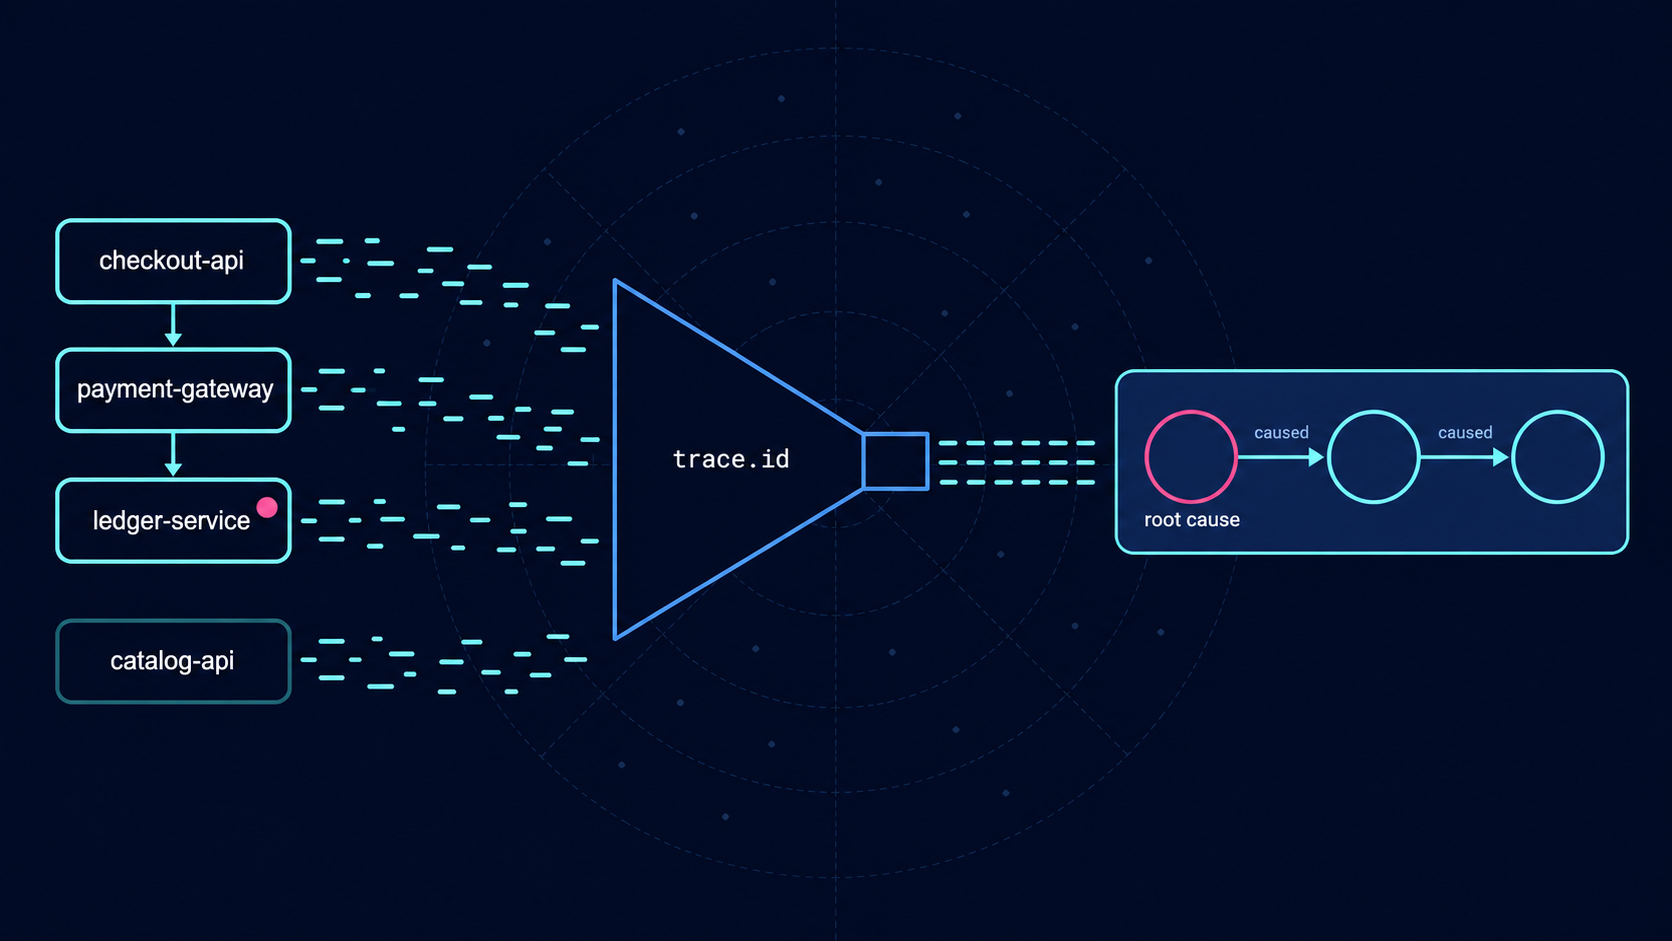
The service with the most errors was healthy: root cause analysis from logs with ES|QL
Metrics ranked three services identically at 19.1%. Four ES|QL queries over the same 4,688 OpenTelemetry log records traced 955 of 956 failure chains back to one of them, and needed no service dependency model to do it.
.jpg)
Kubernetes attributes processor v1: What it means for EDOT Collector
Default EDOT Collector setups are fine. Anything custom that queries labels, annotations or container.image.tag quietly stops returning data after EDOT 9.6.
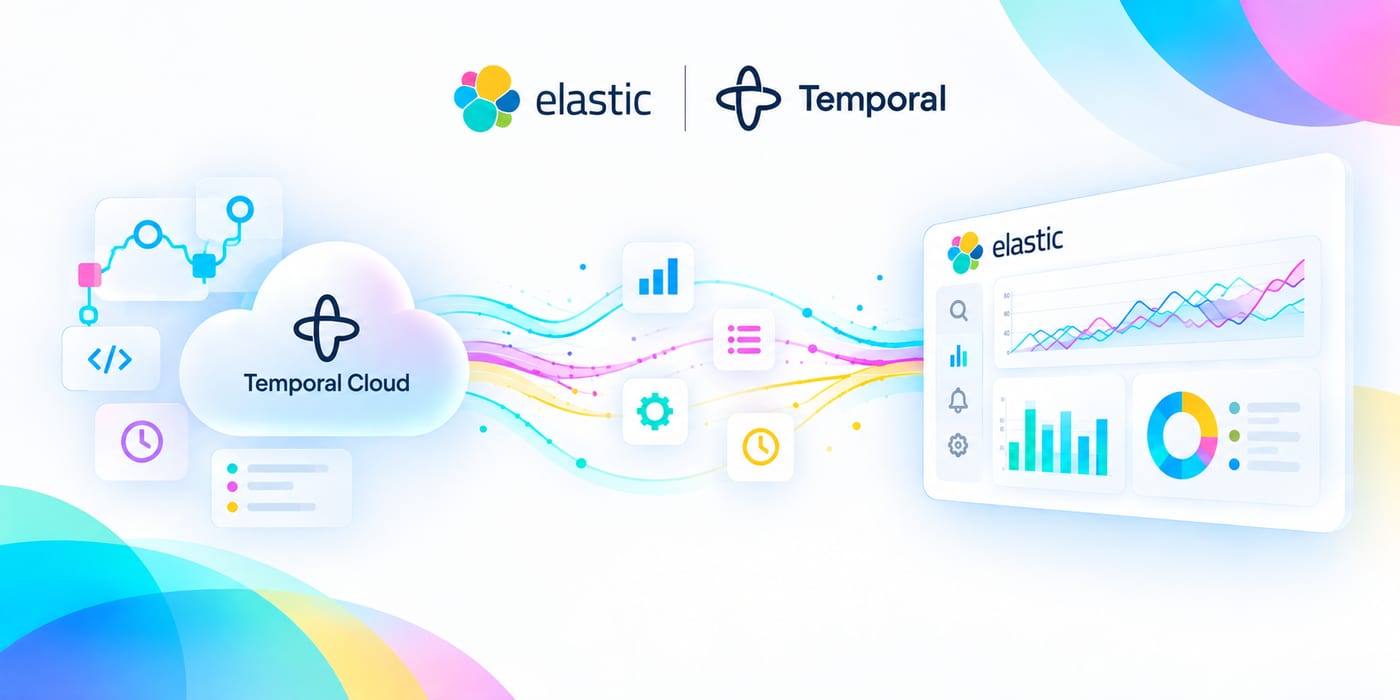
Temporal Cloud observability in Elastic: 50+ metrics, zero collectors
Elastic scrapes metrics.temporal.io, so the workflow that has been stuck in Running for an hour turns out to be a task queue nobody is polling, and you find that out before you open a single worker log.

Telemetry Policy: change OpenTelemetry sampling and log levels at runtime, no restart
Telemetry Policy says what you want to happen and leaves each component to work out how. Change an OpenTelemetry Java agent's trace sampling to 1% and the JVM keeps serving traffic.

Monitor Supabase in Elastic: dashboards, alert templates, SLO templates, and zero agents
When your Supabase API goes slow, it could be the node, Postgres, the pooler or PostgREST. Elastic tells you which one and shows you the logs from whichever it was.

Native OTLP metrics ingestion on Elastic Cloud Hosted
Send an exponential OpenTelemetry histogram and Elasticsearch keeps the scale and buckets you sent. All four type and temporality combinations work now, and your SDK and Collector config stay exactly as they are.
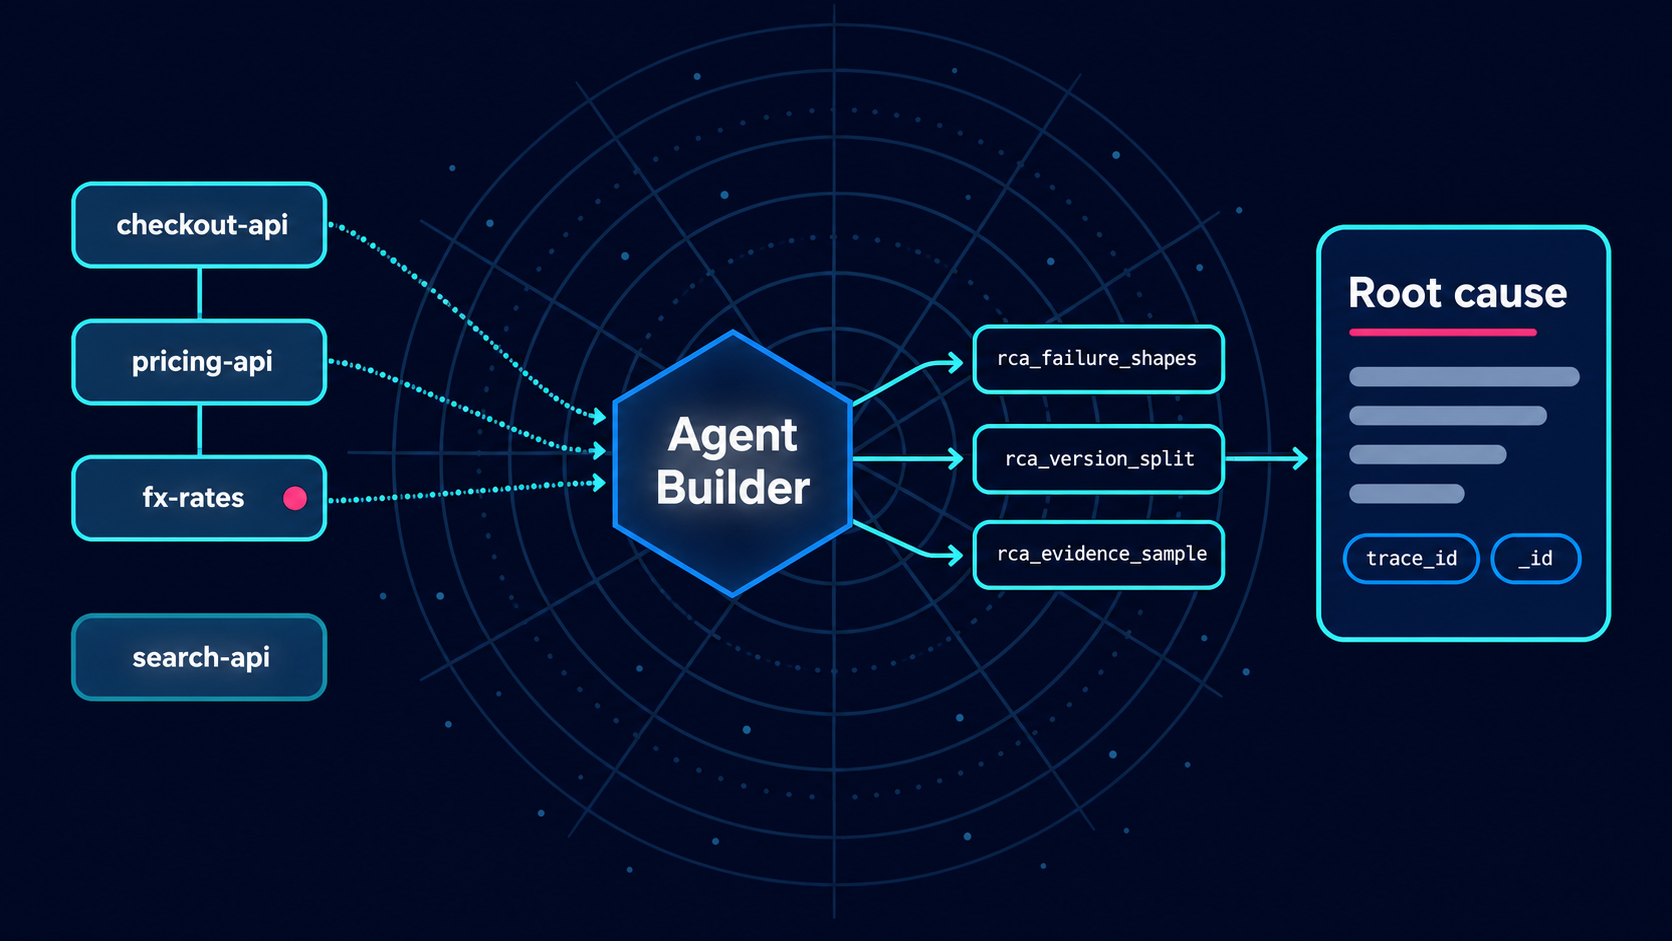
AI root cause analysis in Elastic Agent Builder that cites its evidence
The new release failed at 27.2%, the old one at 28.2%, so the deploy was never the cause; the agent worked that out in 72 seconds and handed back a trace ID for the failure that was.