Log Analytics Articles

Elastic z/OS ingest: five architectures for mainframe data
This field guide walks through the ingest architectures I've seen work in production, the data quality checks that decide whether your dashboards actually work, and the ECS mapping that makes mainframe data usable to the platform.
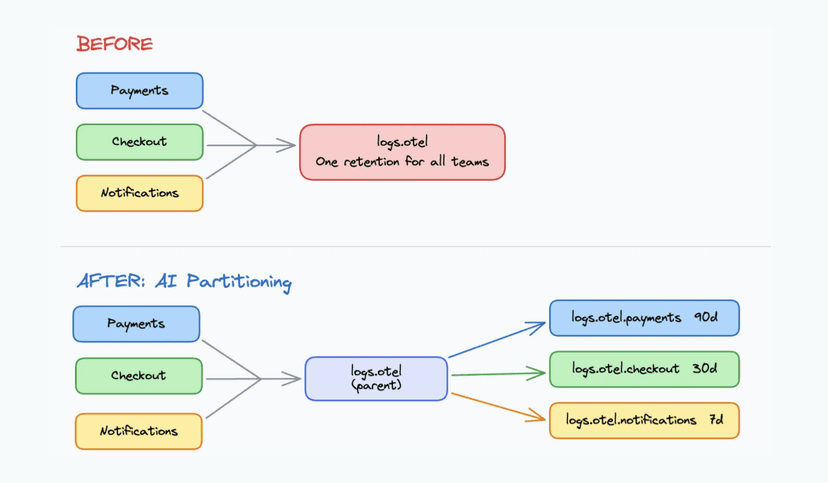
One OTLP endpoint, three teams, zero routing rules: Elasticsearch Streams AI Partitioning
Stop writing log routing rules upfront. See how Streams AI Partitioning reads your data, proposes child streams, and lets you set per-team retention in minutes.

SNMP Topology Data in Kibana: Collection to Canvas
The Network Topology plugin for Kibana provides a ready-to-deploy Logstash pipeline, a structured schema, and a topology view that shows what's connected to what.

Configure downsampling directly in Elastic Streams, no more JSON editing needed
Configure downsampling in Elastic Streams alongside retention and tiers, with a live preview and validation. No more editing ILM or lifecycle JSON.

From raw logs to system knowledge: the AI context layer observability is missing
A self-updating knowledge base built from your logs: services, dependencies, and failure modes, so your AI agents always know what they are looking at.
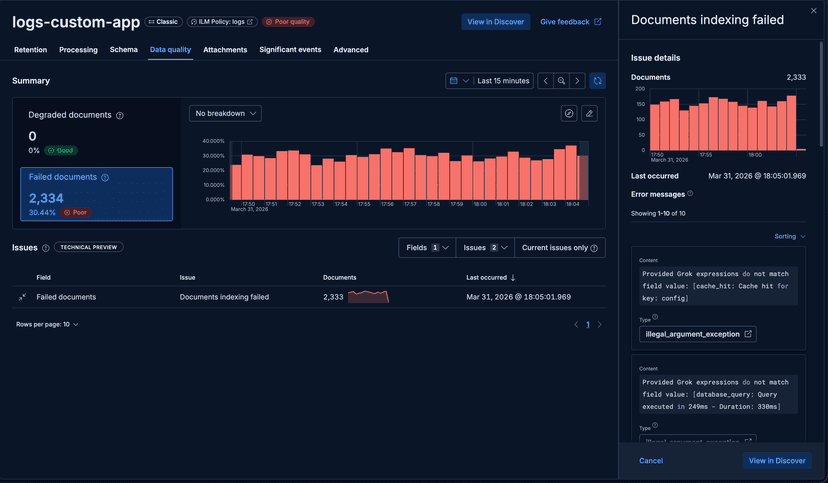
Fixing Elastic Streams processing failures without dropping data
When your Streams ingest pipeline breaks, failed documents land in the failure store, not the floor. Here's how to use those exact failures to fix your pipeline without re-ingesting from the source.

Connecting Cursor to Production Logs via the Elastic MCP Server
Learn how to connect Cursor to your Elastic APM data using the Elastic Agent Builder MCP server, so you can debug production errors and make UI decisions backed by real usage data without leaving your editor.

How Streams Generates a Log Pipeline in Seconds
Streams generates a complete, tested log processing pipeline from a single click. Here's the two-stage mechanism behind it: deterministic fingerprinting, a reasoning agent that iterates against real data, and hard validation thresholds that enforce quality before you see the result.

How to cut Elasticsearch log storage costs with LogsDB
Learn how to enable LogsDB index mode in Elasticsearch and measure real storage savings. We compare a standard index against a LogsDB index using Apache logs and show how much storage you can reclaim.
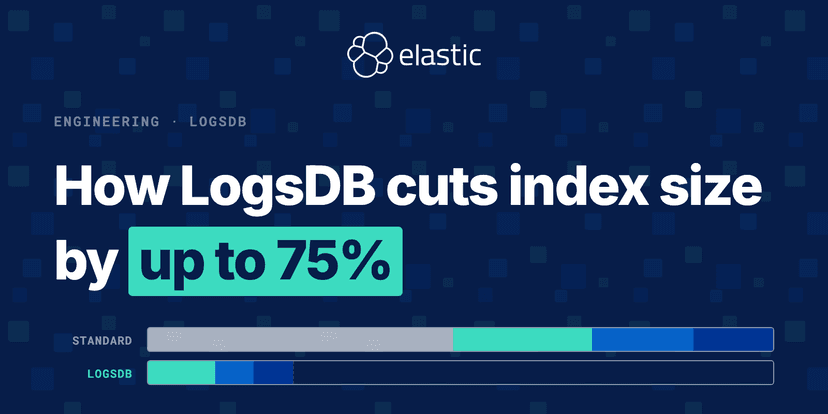
Elasticsearch over the years — how LogsDB cuts index size by up to 75% at no throughput cost
By default, Elasticsearch is optimized for retrieval, not storage. LogsDB changes that. Here's the layered architecture behind a 77% index size reduction.

Automated Error Triage: From Reactive to Autonomous
Learn how to automate error triage by using Elasticsearch log clustering and AI agents, turning production logs into actionable root cause reports.

Agent Skills for Elastic Observability
Learn how Agent Skills for Elastic Observability help SREs and developers run observability workflows through natural language to instrument apps with OpenTelemetry, search logs, manage SLOs, understand service health, and help with LLM observability.