Full-signal observability at half the cost
Elastic Observability can handle petabyte-scale data at half the cost of Datadog, so agentic AI gets the complete picture across logs, metrics, and traces to spot and fix problems quickly.
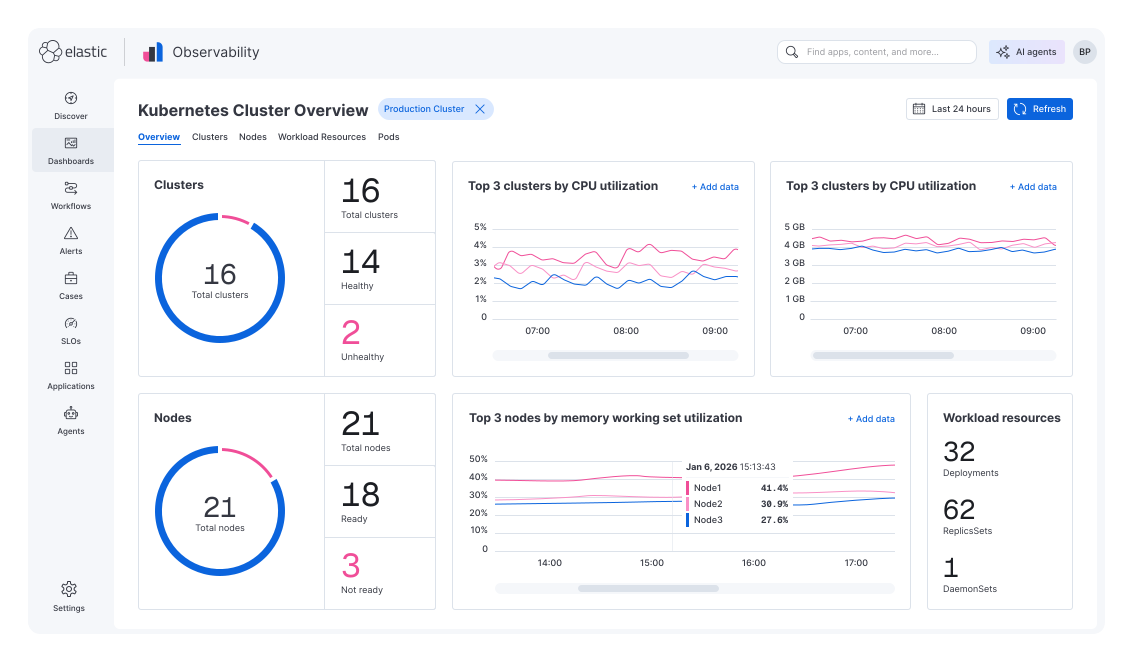







Observability at AI scale
AI and cloud-native workloads are generating more telemetry than teams can afford to keep. The result: blind spots that undermine incident management and root cause analysis.
Best-in-class efficiency for logs, metrics, and traces
Keep it all. Elasticsearch packs more telemetry into less storage, keeping costs low and performance high — even for high cardinality data.
Your logs have the answer. Elastic finds it.
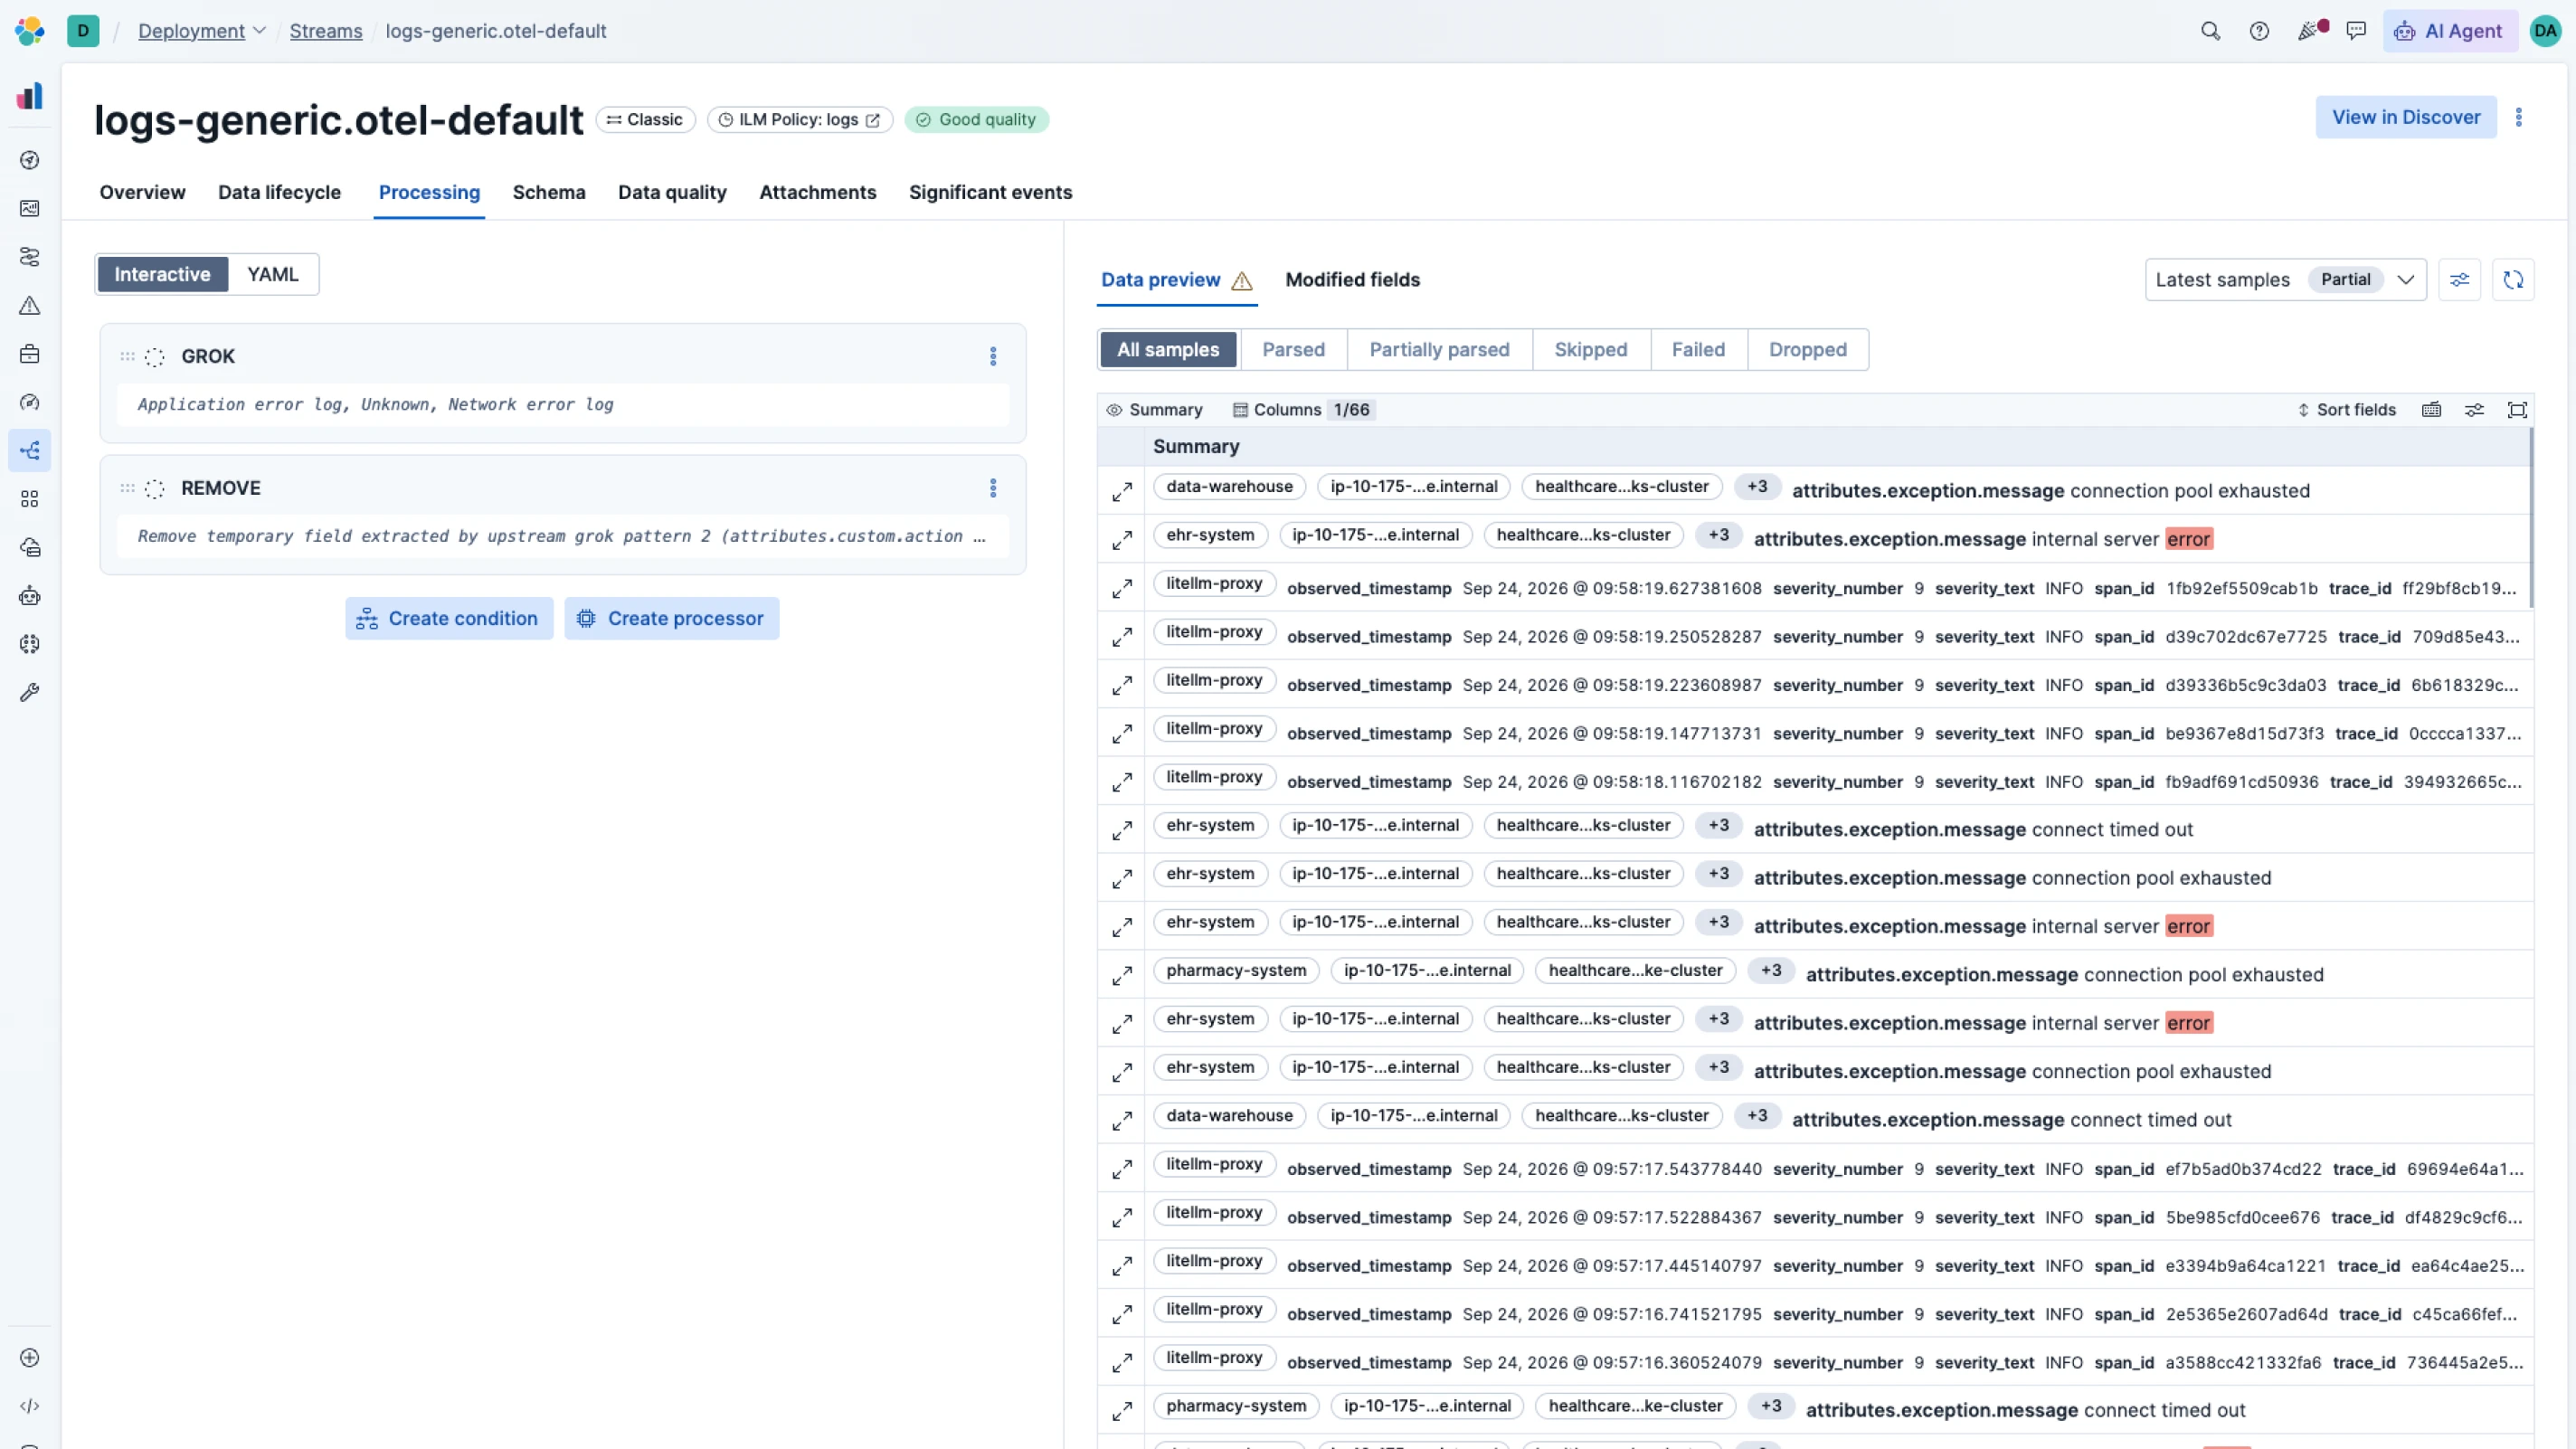
Elastic extracts structure, meaning, and operational context from raw telemetry, turning a reactive, expert-only signal into a proactive one.
AI-driven investigations with full context
Elastic gives AI SRE agents and ML the richest possible context to investigate, surface root cause, and automate remediation with transparency that keeps teams in control.
OpenTelemetry-first and Prometheus-native
Ingest any data from any source. Elastic is open by design, schema-agnostic, Prometheus-native, and built on OpenTelemetry (OTel) from the ground up.
One platform for everything
All signals, one source of truth. Connect your data with 550+ one-click integrations across clouds, CI/CD, databases, and more.
Best-in-class efficiency
AI is only as good as the data platform powering it. From storage architecture to query performance, each piece of Elasticsearch was built with purpose.
Learn how we rebuilt Elasticsearch as a leading columnar metrics datastore.
Logsdb index mode
A purpose-built index mode for logs and trace data. Smart sorting by host.name and @timestamp dramatically improves compression. Synthetic _source reconstructs fields on demand.

Metrics query performance
ES|QL delivers sub-second responses on millions of time series metrics — the speed AI investigations demand.

Metrics storage efficiency
Store more data for richer AI context at lower cost via doc value skippers, Synthetic ID, and seq_no trimming — 6.6x improvement since one year ago.

From data to answers — no digging required
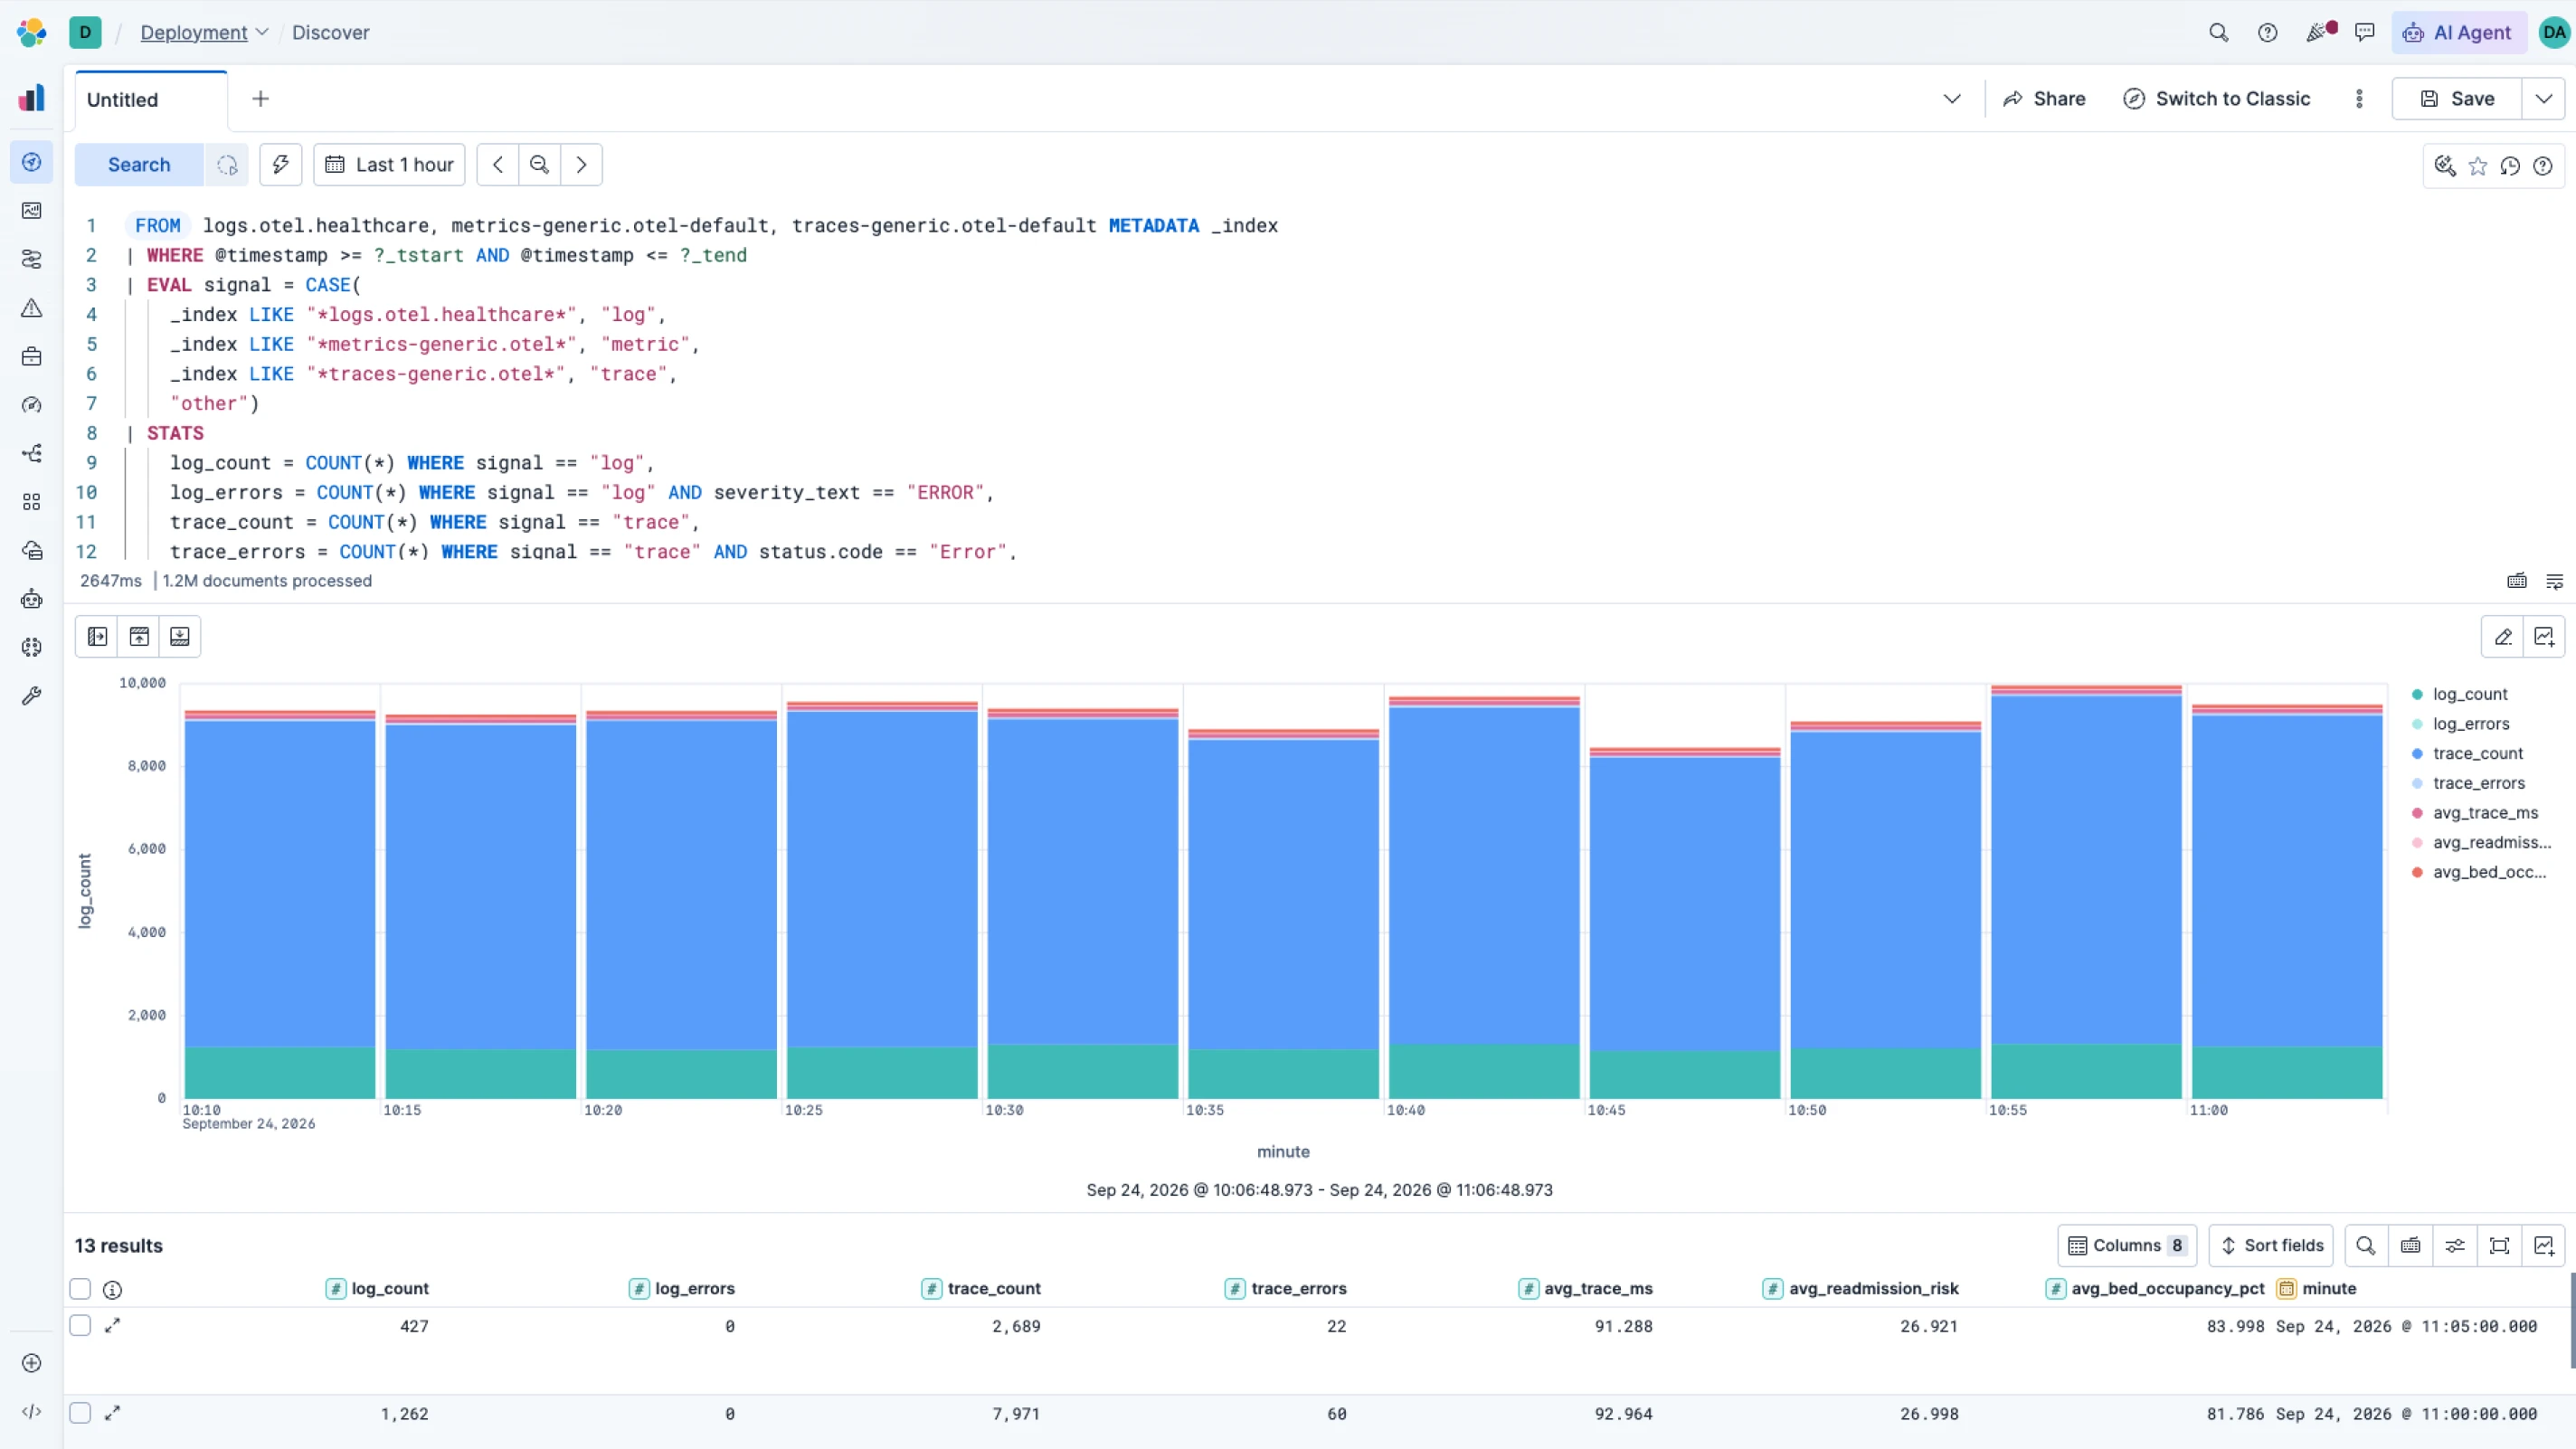
From log exploration to agentic investigations, Elastic Observability is built around how on-call SREs actually think and work.
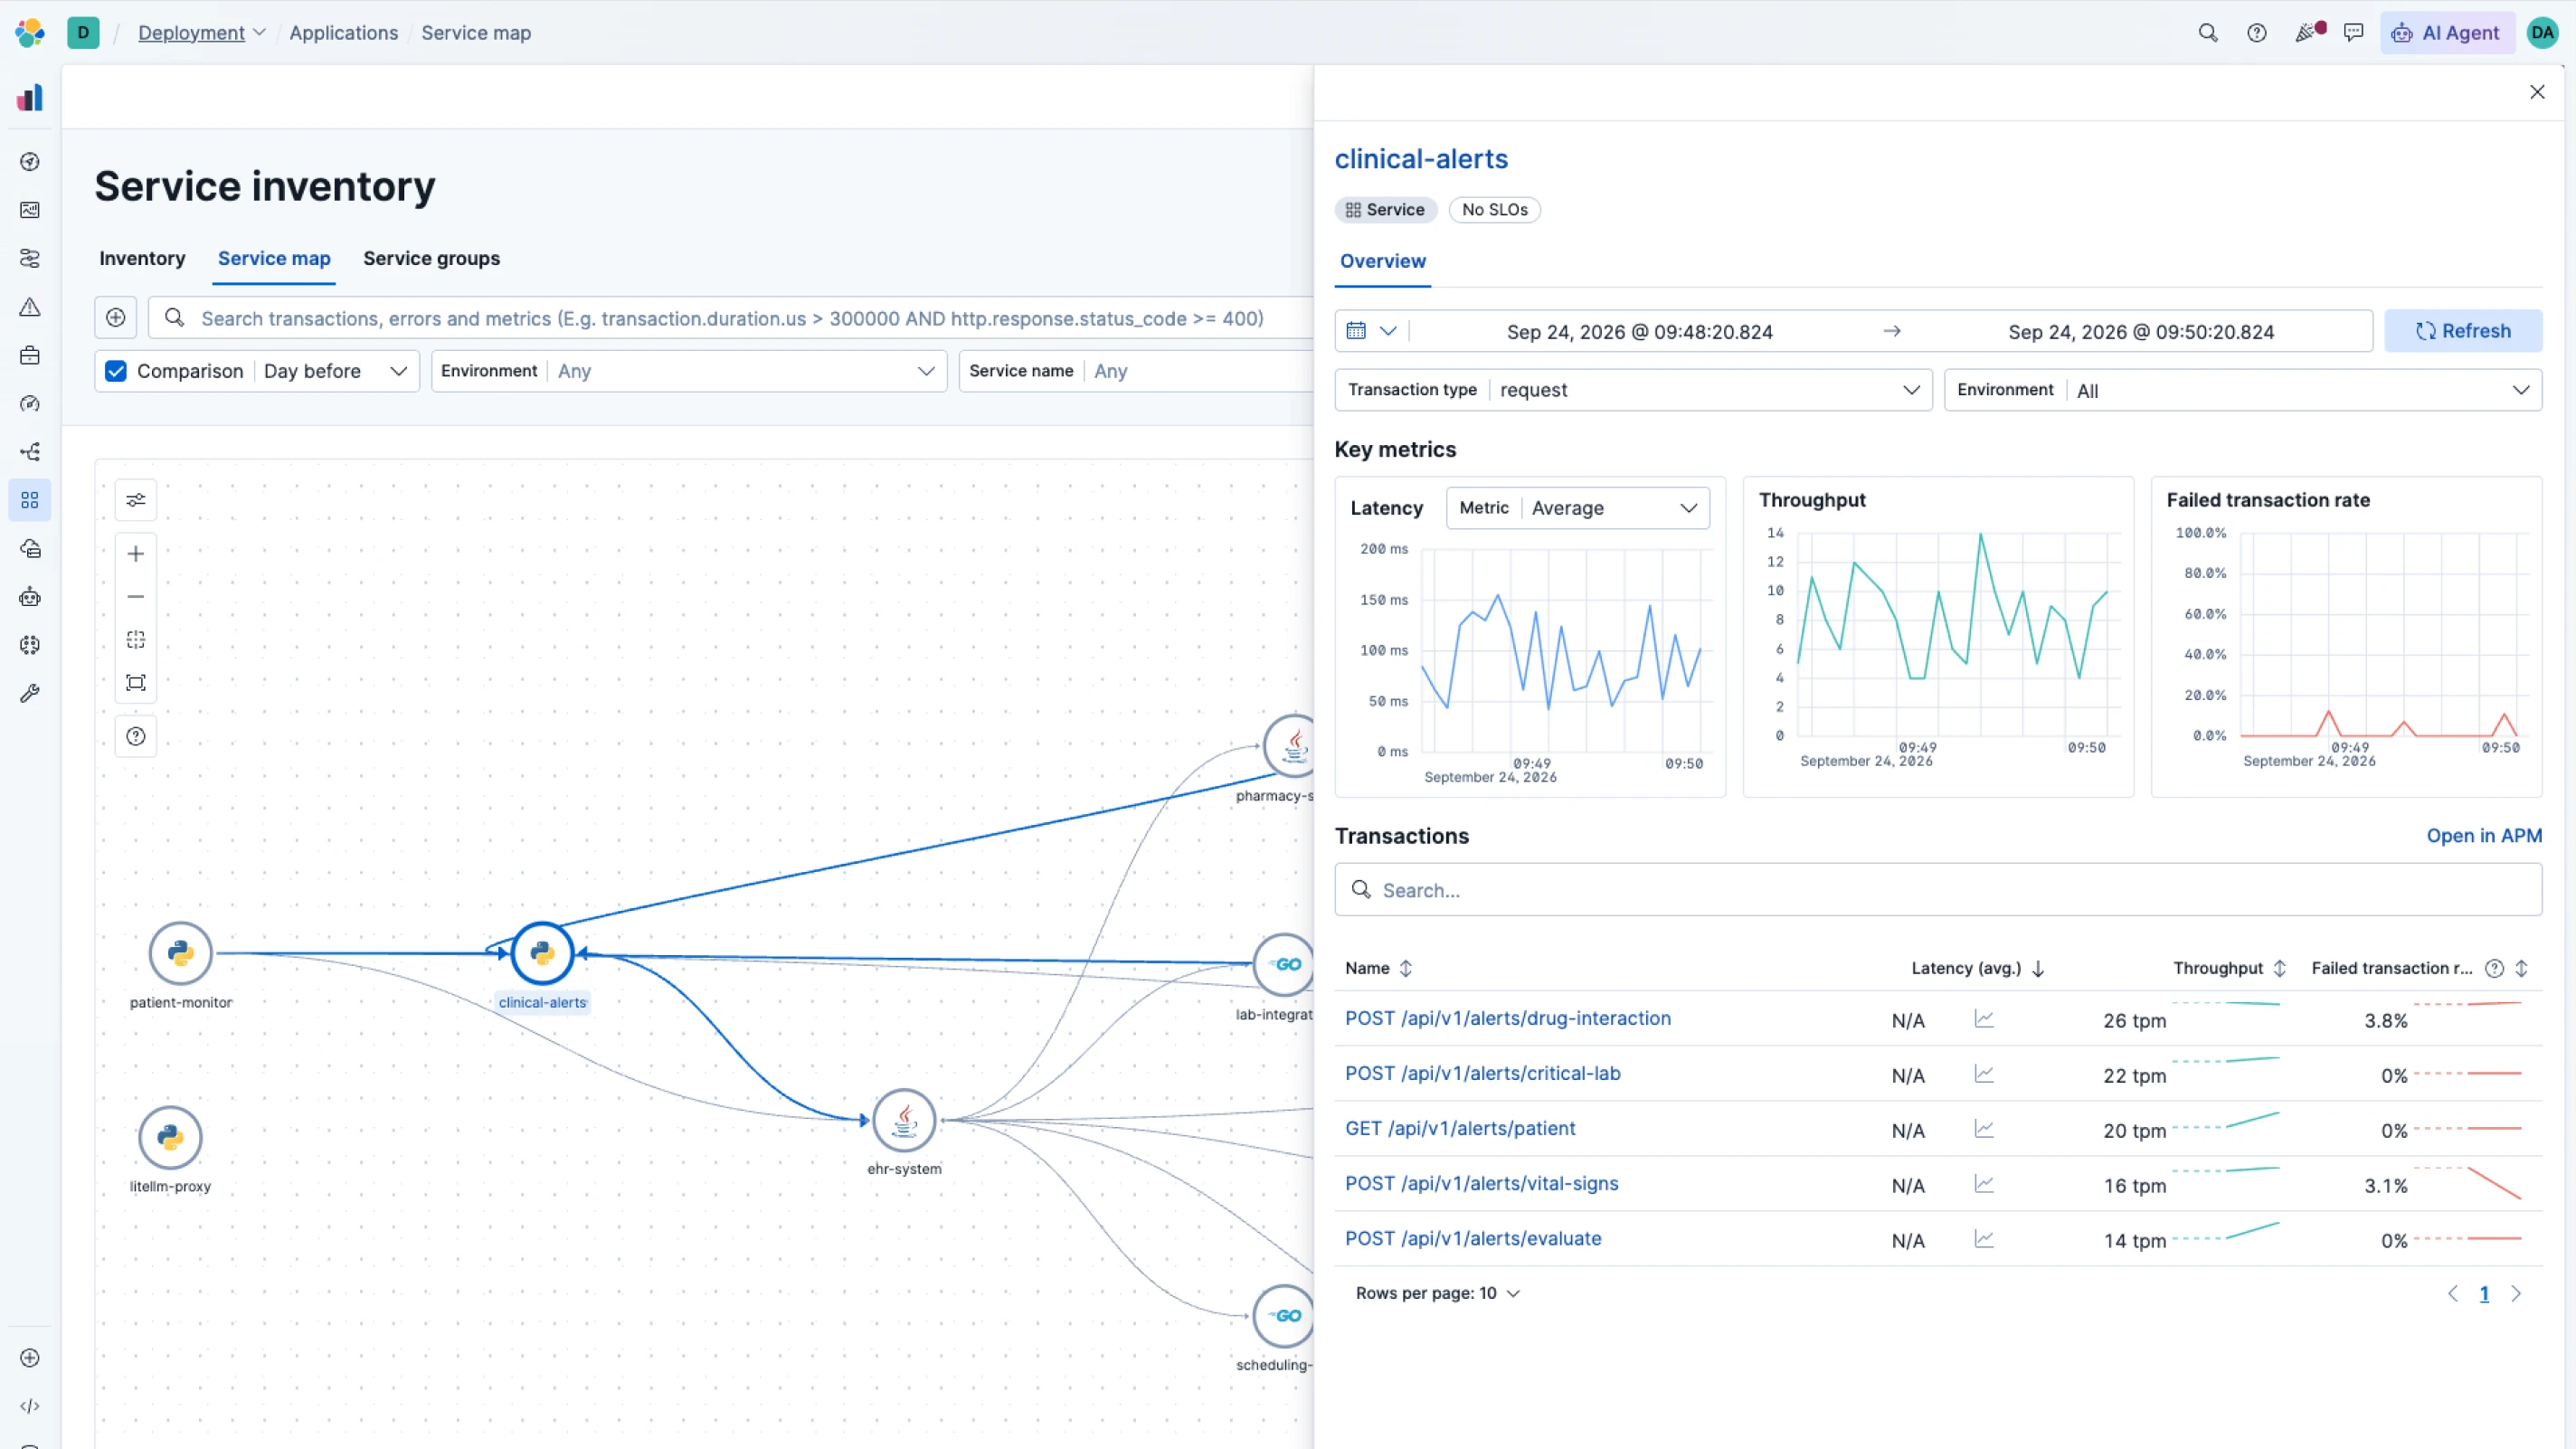
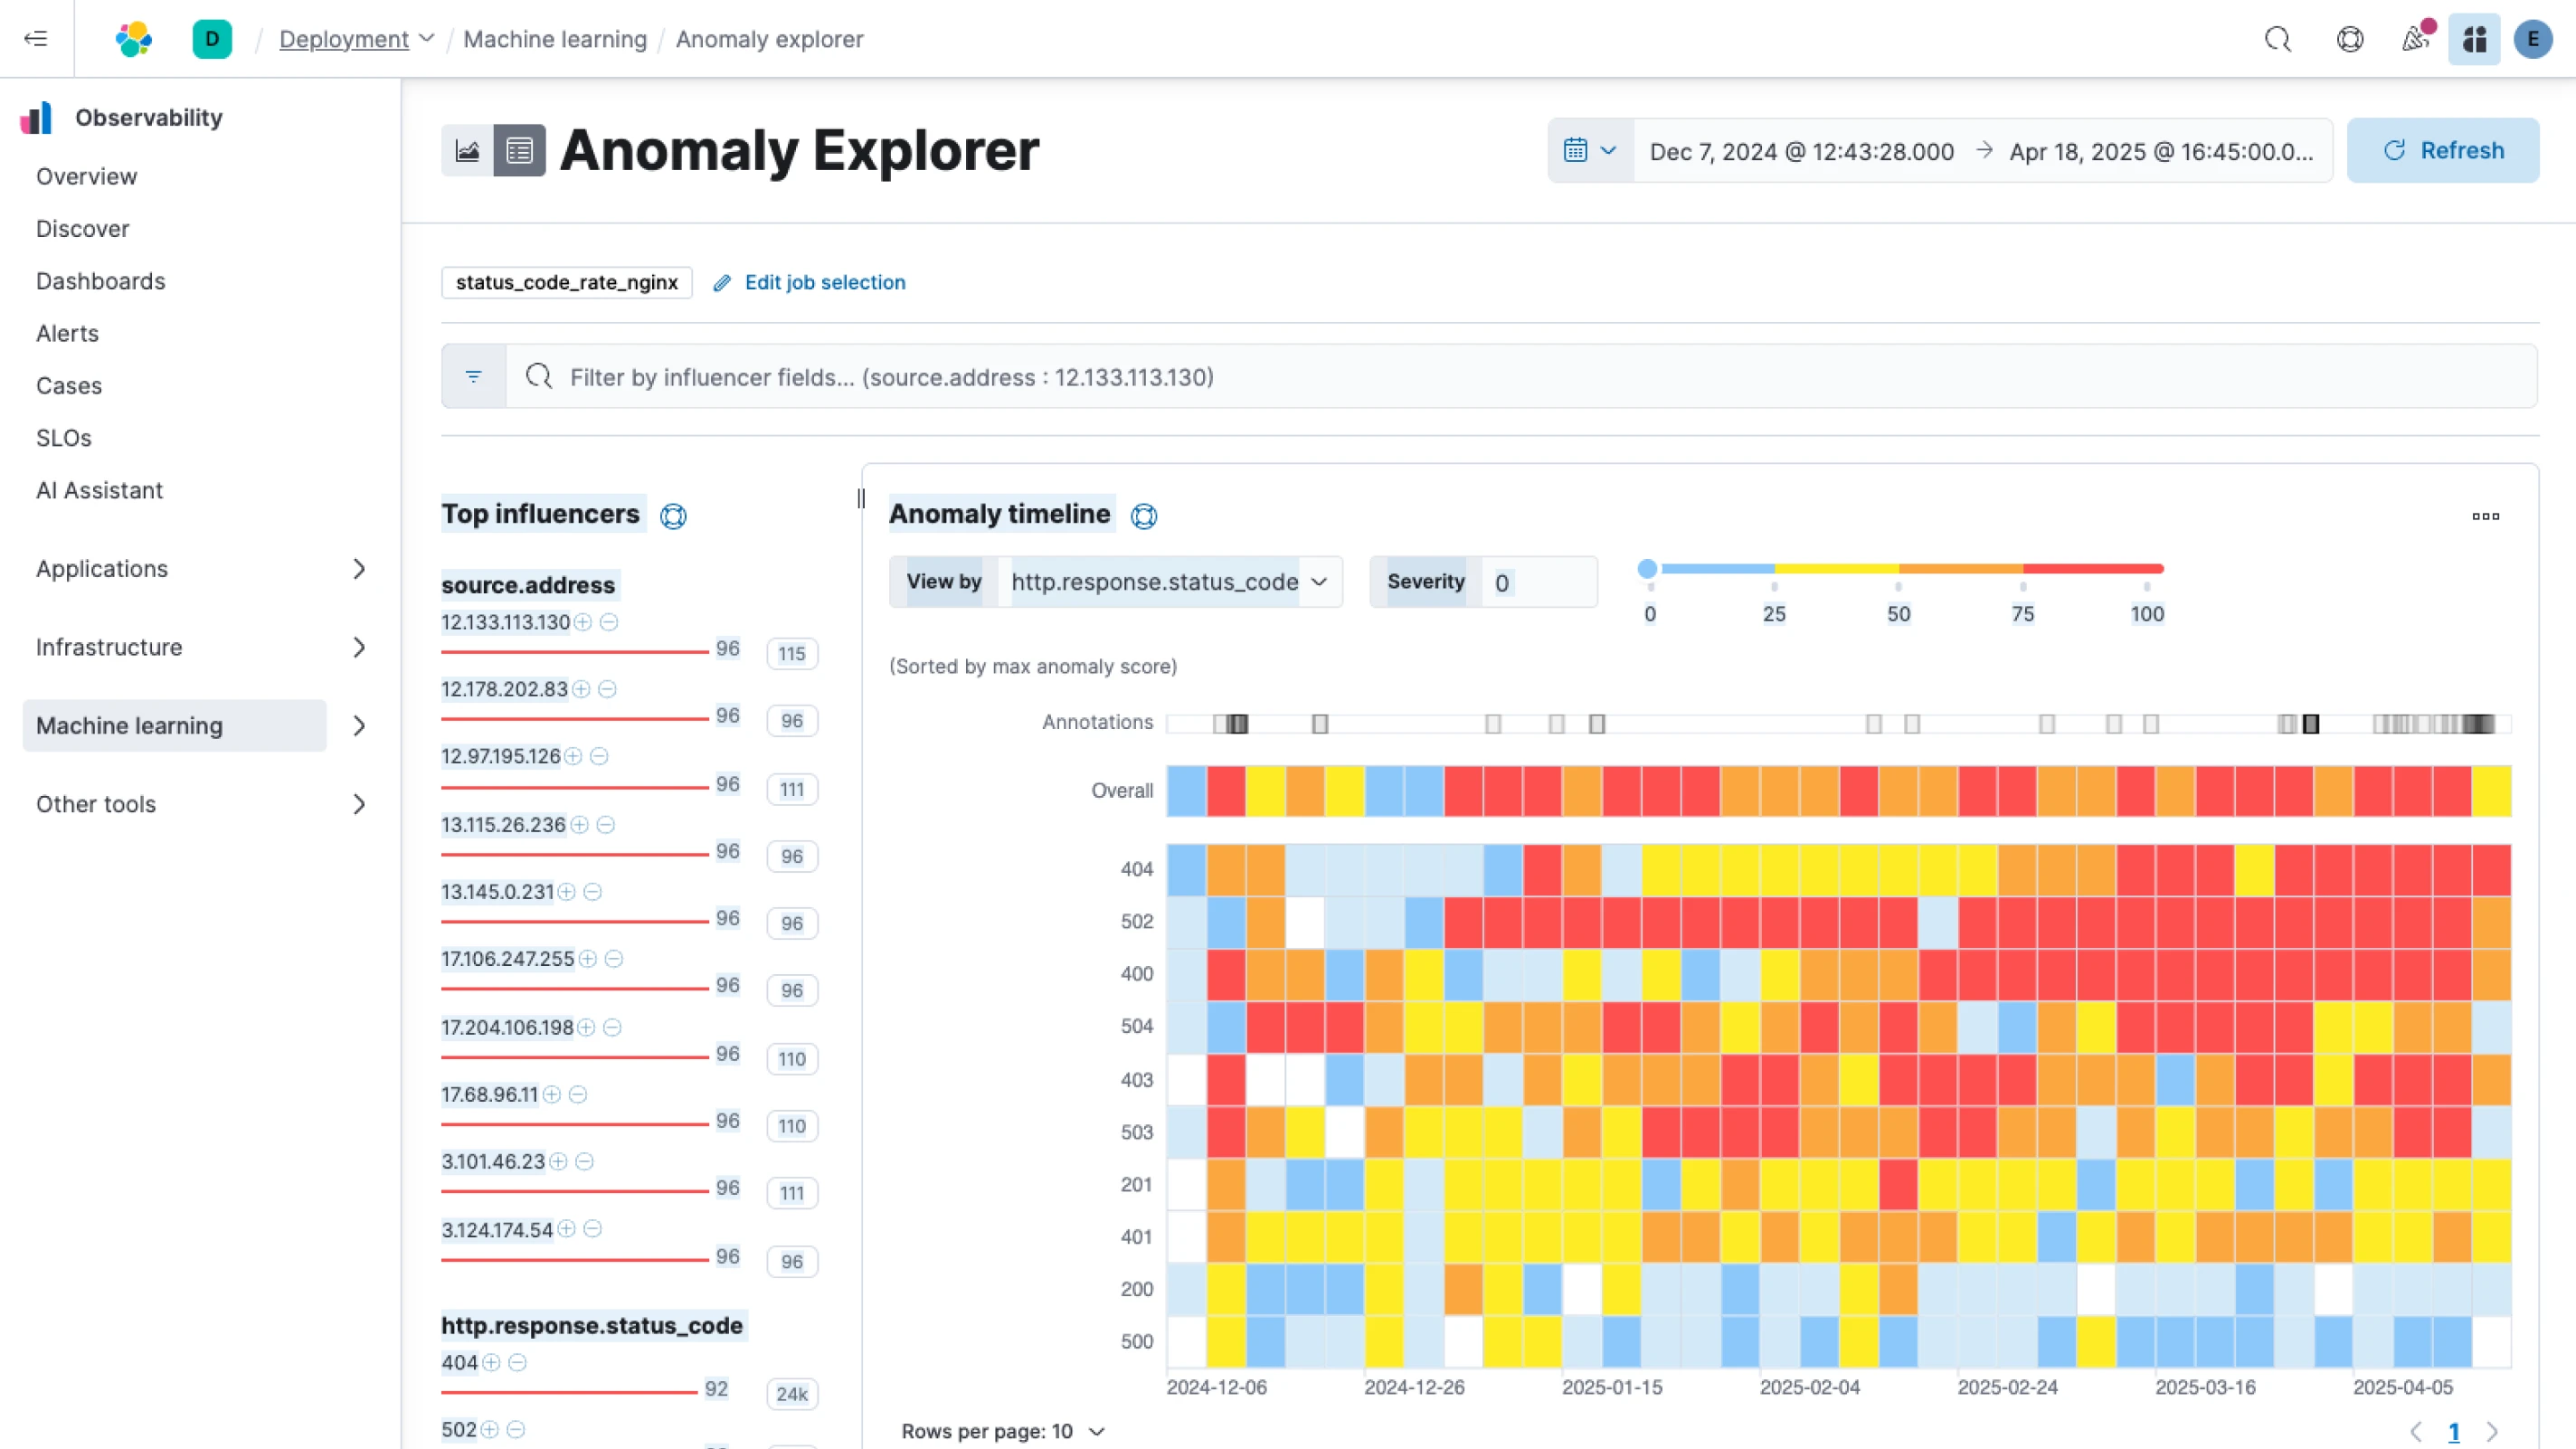
Spotlight anomalies and speed up troubleshooting across distributed microservices, serverless functions, AI models, third-party APIs, and more.
What analysts say about Elastic Observability


Trusted by 75% of the Fortune 100 to drive innovation

"With Elastic Observability we can reduce or prevent network outages, enable faster root cause analysis, and deliver insights into network behavior. This significantly reduces network issues and helps increase customer satisfaction."
"With Elastic Observability we can reduce or prevent network outages, enable faster root cause analysis, and deliver insights into network behavior. This significantly reduces network issues and helps increase customer satisfaction."
Erwin Halmans, Project Manager, Data Driven Network Operations and Assurance
Join the chat
Connect to Elastic's global community and participate in open conversations and collaboration.
Frequently asked questions
What is observability?
Observability refers to the collection and analysis of telemetry, such as logs, metrics, and traces, from a wide variety of sources, to provide detailed insight into the behavior of infrastructure and applications running in your environments.
What is the difference between observability and monitoring?
Observability can be thought of as the evolution of monitoring for modern applications. Fundamentally, it is the ability of applications and infrastructure to expose their internal state through actionable logs, published metrics, and distributed traces. As an approach, observability is better suited than traditional monitoring to manage the complexity and scale of cloud-native environments through the collection, transformation, correlation, analysis, and visualization of telemetry signals. Elastic Observability brings all these capabilities together under a single platform. Observability continues to evolve with new trends and technologies.
What is agentic observability?
Agentic observability is an approach where AI agents actively investigate and resolve incidents instead of waiting for engineers to interpret dashboards and alerts. AI agents perform root cause analysis by reasoning across telemetry to identify the underlying cause of an incident. They correlate signals across logs, metrics, traces, and other telemetry to build a complete picture of what is happening. Using workflow automation, agents can recommend or automate remediation based on their findings. MCP server support extends these capabilities beyond the observability platform, giving agents access to external tools and systems during investigations.
What are the benefits of AIOps and agentic observability?
By implementing AIOps, SRE teams can proactively detect and resolve issues faster with contextual root cause analysis and cross-signal correlation. Businesses can deliver on SLAs and improve time to market, operational efficiency, and customer satisfaction. PepsiCo boosted efficiency and reduced MTTR by 30% with Elastic Observability, resolving issues in minutes rather than days.
Why are businesses switching from Datadog to Elastic Observability?
The most common reason businesses switch from Datadog to Elastic Observability is cost. Datadog's per-host and per-metric pricing grows quickly as infrastructure scales, and many teams find themselves making painful tradeoffs about what data to keep and what to drop. Elasticsearch stores logs, metrics, and traces with best-in-class storage efficiency so that full-fidelity retention stops being a budget decision — high cardinality included. For metrics alone, Elastic can deliver savings of up to 4x over Datadog, giving teams more control over what they store, how long they keep it, and what they pay.
Does Elastic Observability support OpenTelemetry and Prometheus natively?
Yes. Elastic Observability is OpenTelemetry-first, with native support for OpenTelemetry data and workflows. Elastic Distributions of OpenTelemetry (EDOT) provides production-ready distributions for collecting and sending telemetry to Elastic. Elastic also provides native Prometheus monitoring, including Prometheus remote write and PromQL support directly in Kibana. Teams can use OpenTelemetry and Prometheus standards without proprietary agents, data conversions, or a separate observability stack.