Accelerate your DevOps transformation
DevOps is more than a term or role: it's a culture and a unique way of developing software. DevOps teams need to understand what is going on in the applications, the environments they run on, and the services those applications depend on during the entire application lifecycle — not only while in production, but during the build/deploy cycle as well.
DevOps teams that focus on observability are able to develop 70% faster.
Learn moreBreaking silos between DevOps and SecOps monitoring tools
Watch nowUsing the Elastic Stack to define service level indicators and objectives (SLIs/SLOs)
Watch nowGain complete visibility of your entire environment
Too often, DevOps teams are forced to learn and use multiple sets of tools, creating tool sprawl. In addition, teams often use different observability tools in dev, stage, and production, creating silos across the software development lifecycle, losing the ability to compare, contrast, and correlate their software efficiency. Elastic Observability enables teams to collaborate on a single, unified solution for the entire software lifecycle, from development to production, for applications, services, infrastructure, and all.

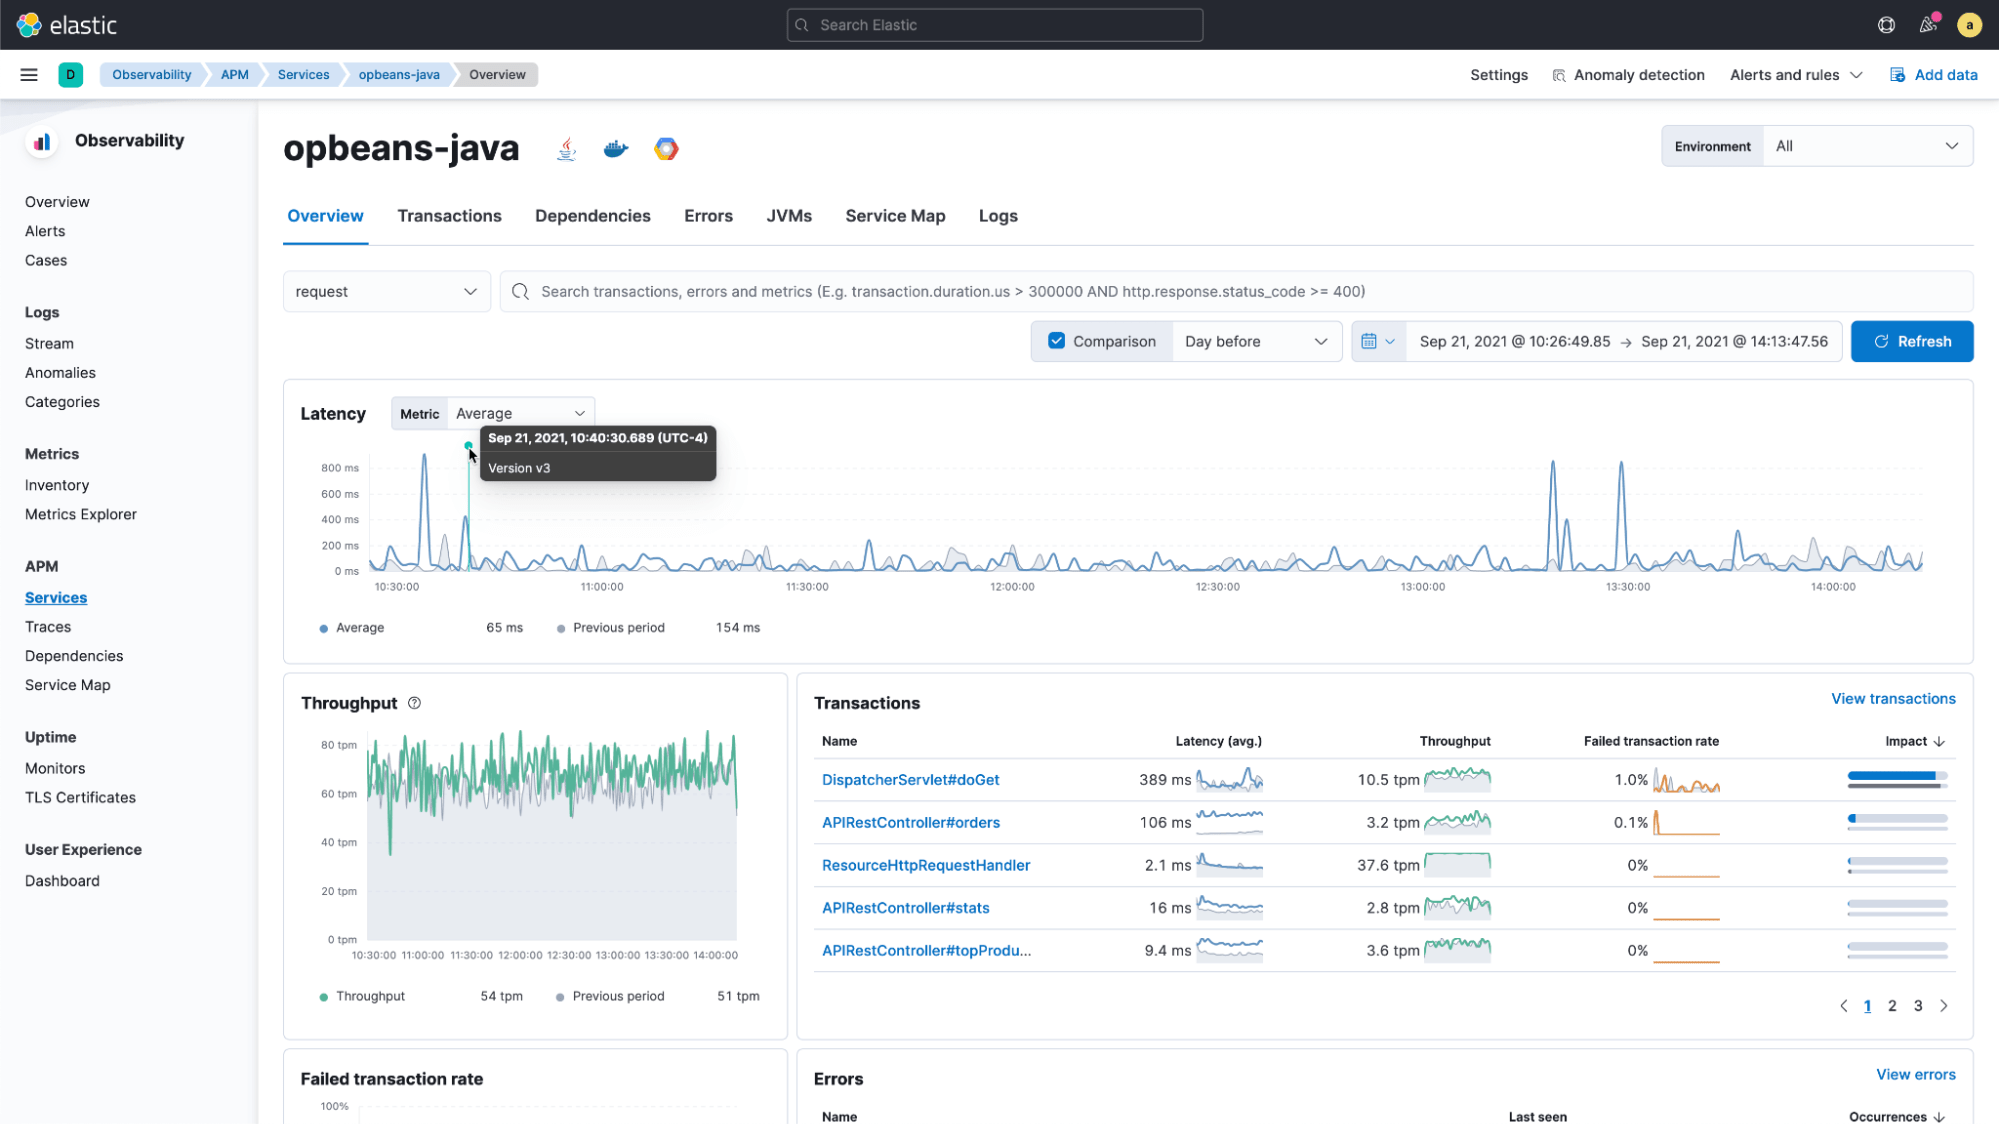
Compare performance over progressive deployments
Automatically detect, annotate, and display new software deployments with markers right in Elastic. This visual feedback allows you to quickly identify any deltas in performance, whether you're utilizing canary deployments, blue/green, or A/B testing. Plus, you can use the annotation API to add even more context with your own deployment markers.
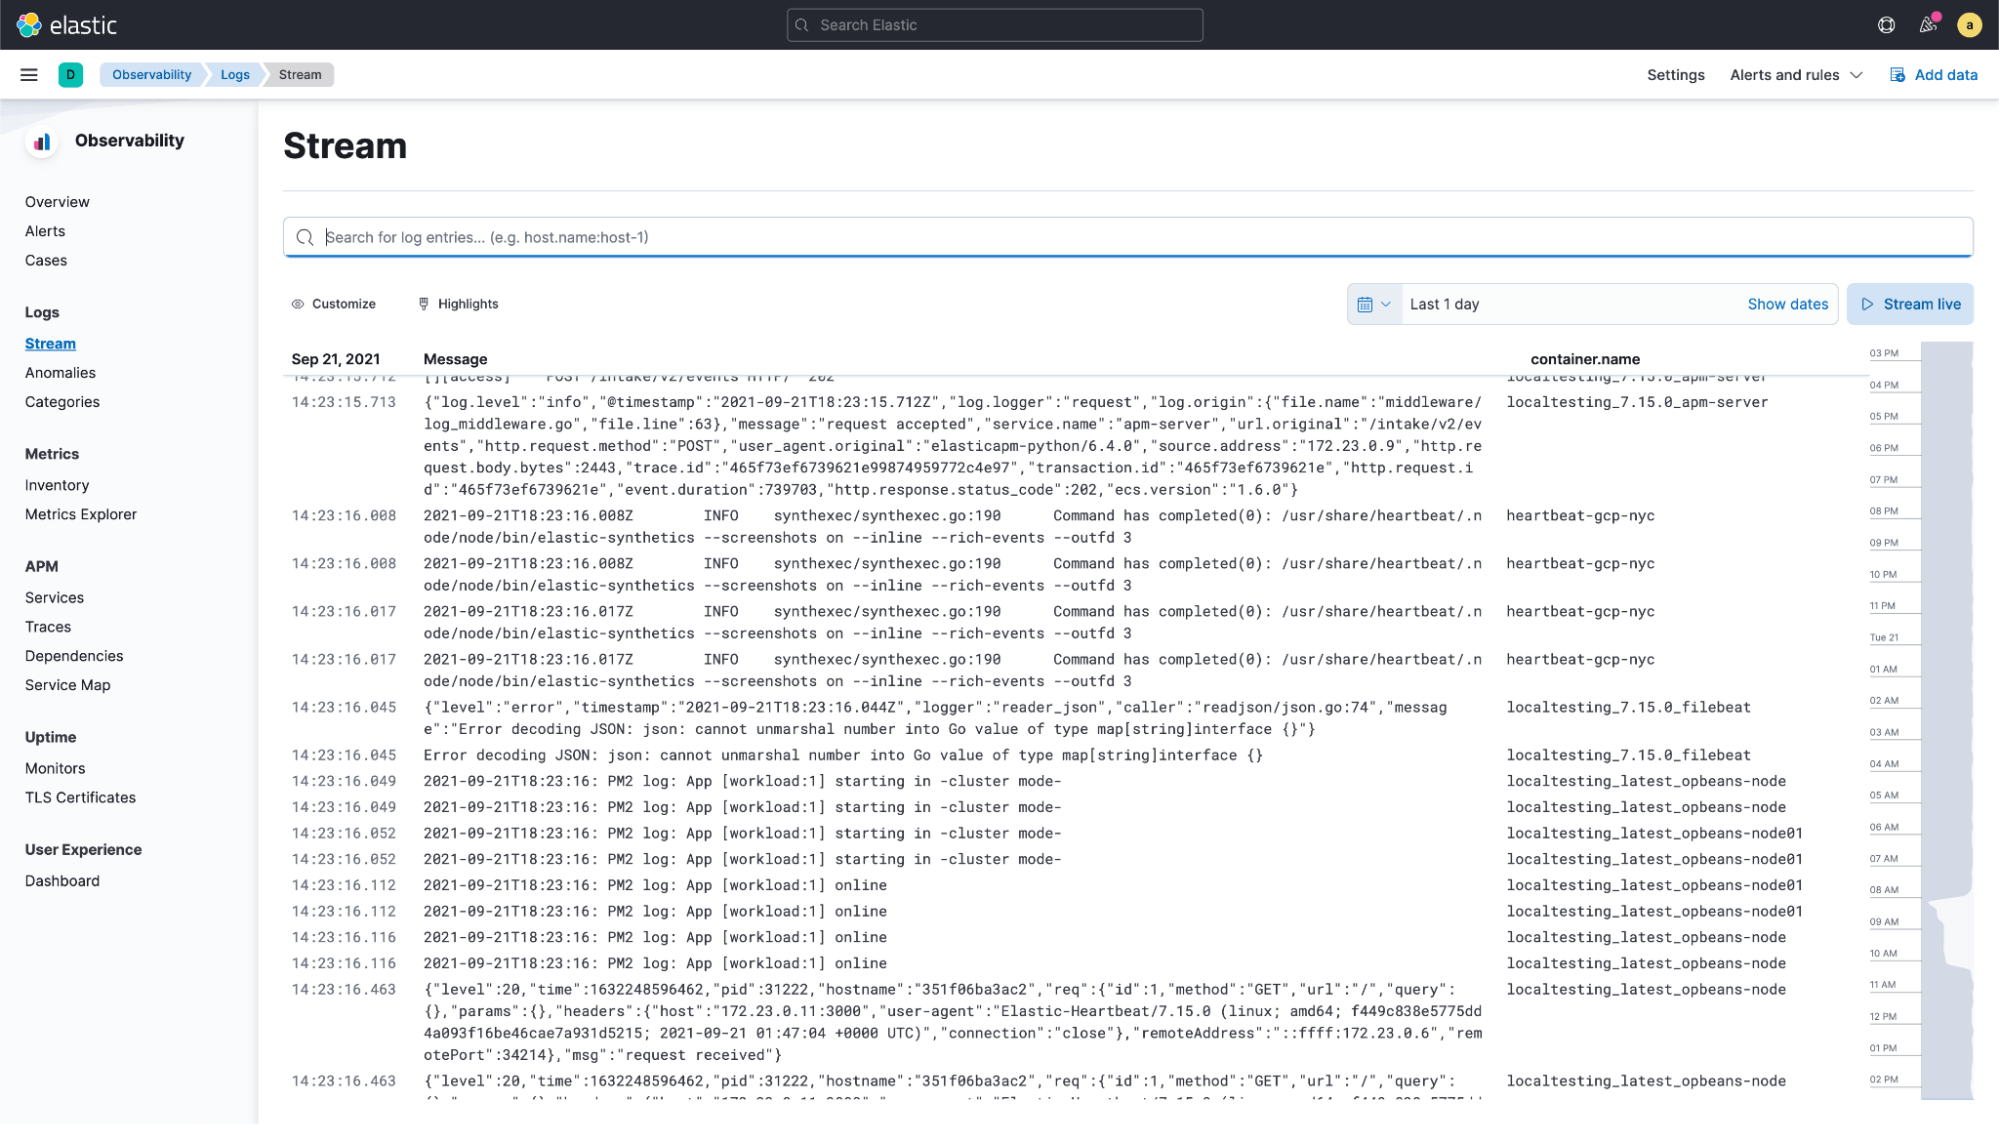
tail -f for your entire infrastructure
Centralized log monitoring is like tail -f across your entire application ecosystem, allowing you to analyze logs from your applications, services, and entire infrastructure, along with those from your CI/CD pipelines — all through a unified search experience.
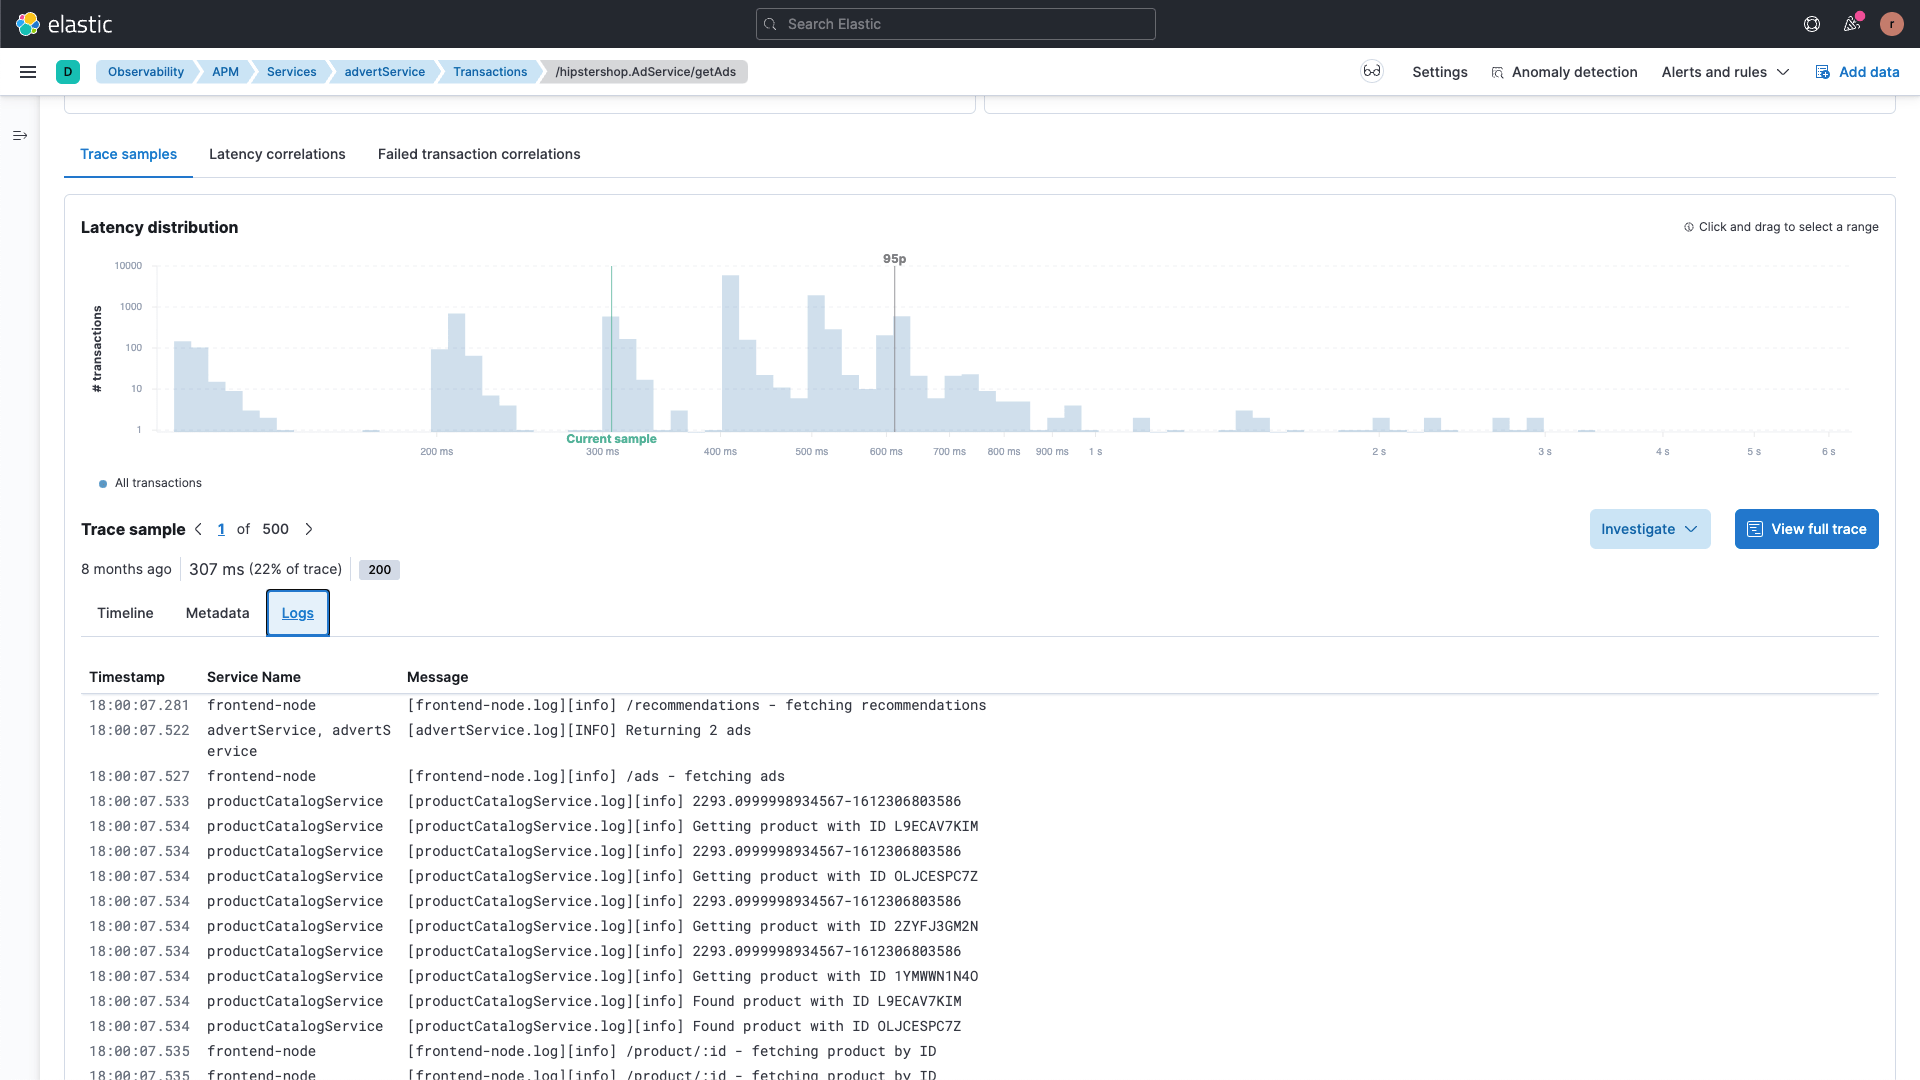
Accelerate troubleshooting with all data in context
With no silos, quickly determine if the issue uncovered in test is already in prod. Track log lines down to the exact invocation in your application or the other way around. Leverage the Elastic Common Schema (ECS) logging libraries to automatically link application traces to the corresponding logs, or augment your existing logging functions to easily enrich logs with the corresponding metadata.
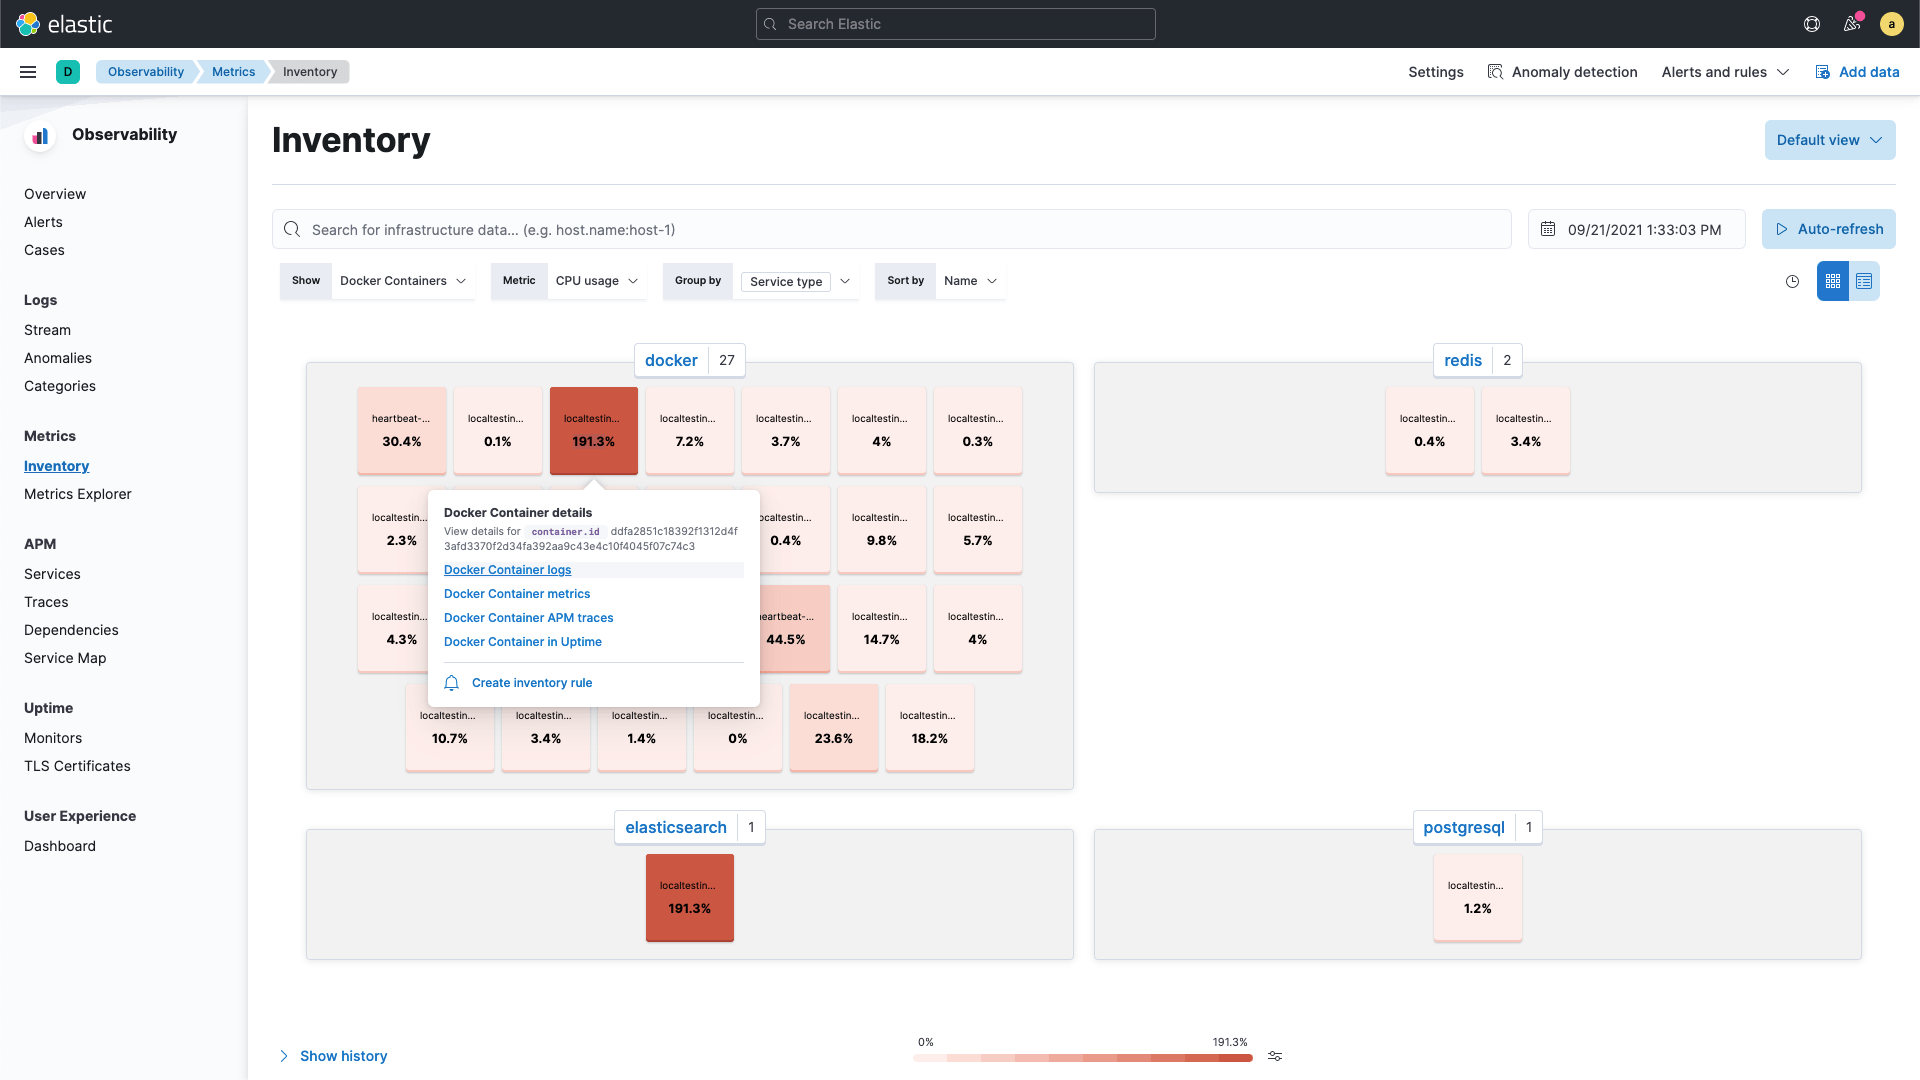
Curated infrastructure views for faster context
All of the telemetry from your infrastructure is available and you have full control of how you look at it. See which hosts are hot, or switch to Kubernetes pod or container perspectives for a logical representation of your deployment. Group by predefined or custom fields to further refine your view, then save it to revisit later. Jump directly to related logs, application traces, or availability data for the host, pod, container, or cloud instance that you're focused on.
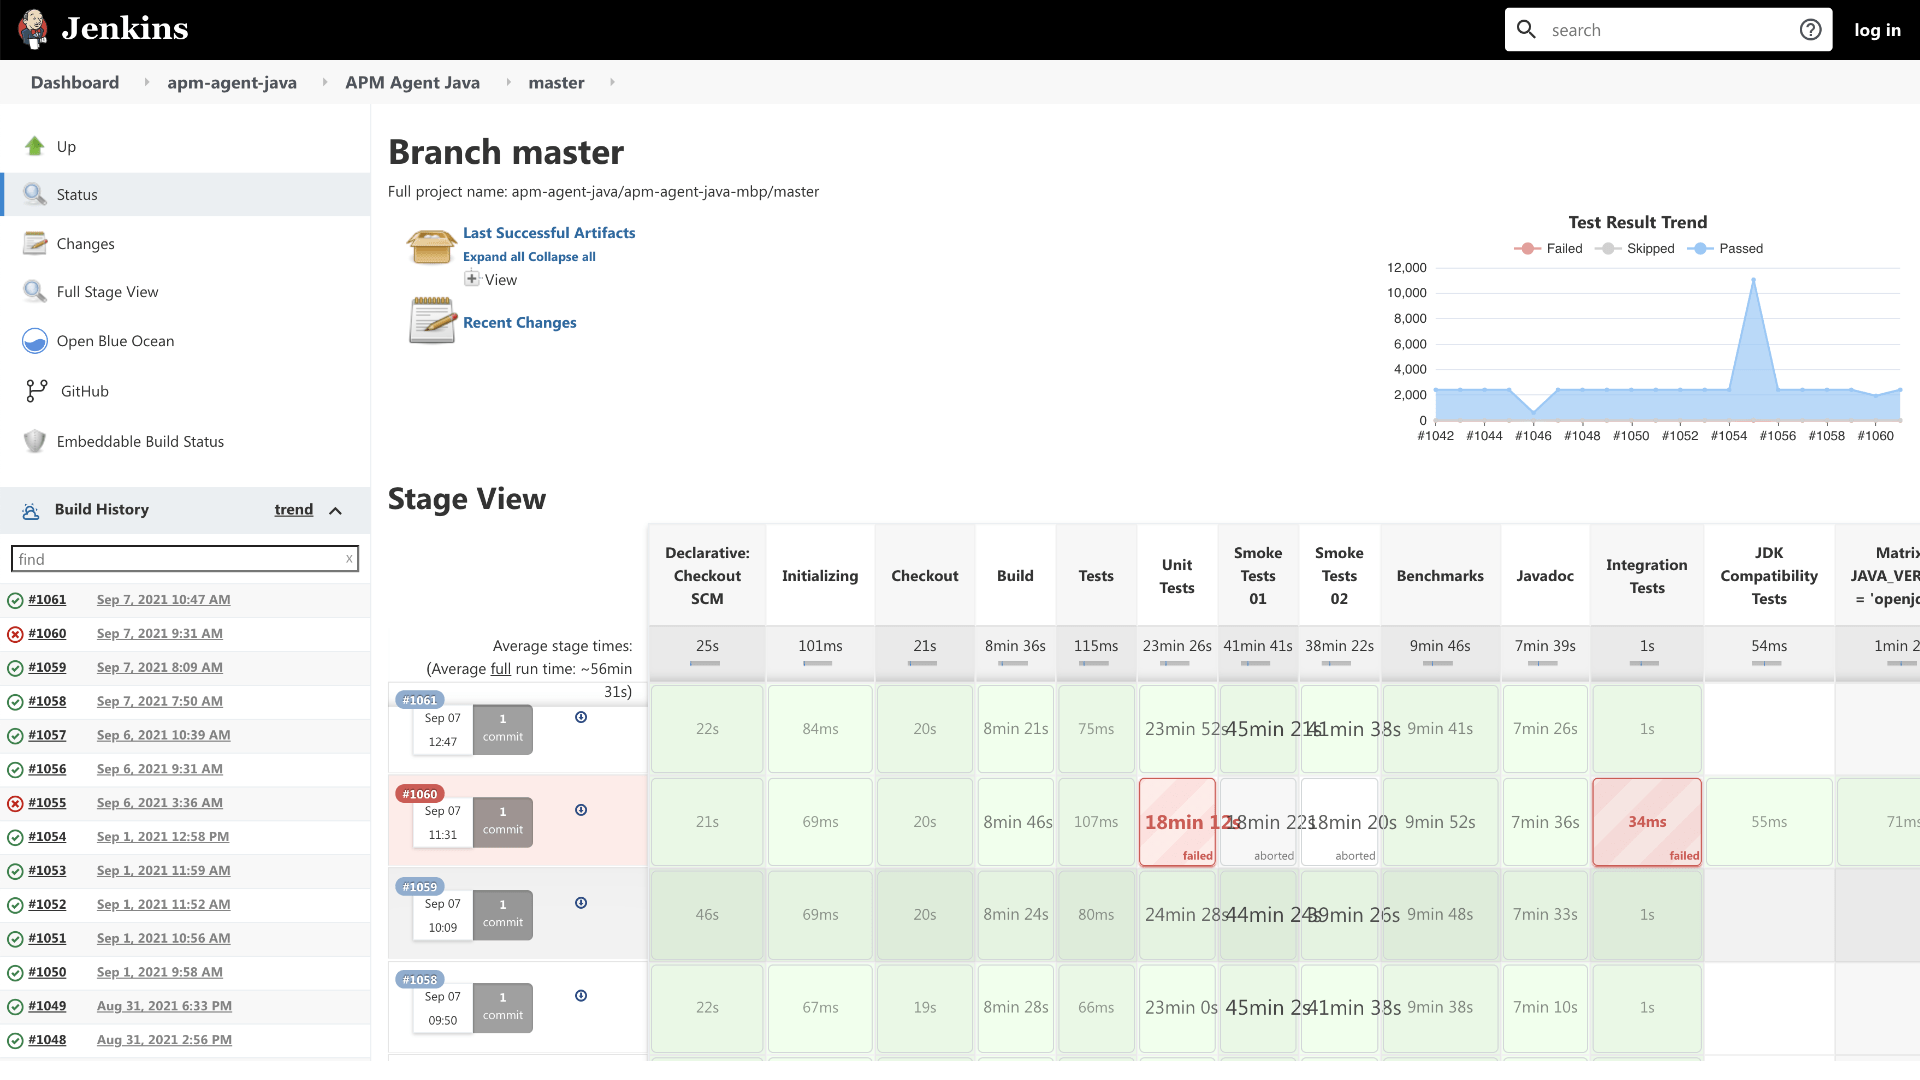
Get better visibility into your CI/CD pipelines
Continuous integration and continuous delivery (CI/CD) of software is critical to business, but the pipelines are hard to keep running and require constant optimization. Visibility is crucial for developer productivity and success. Elastic Observability is working with partners to develop plugins and extensions to enhance the end-to-end observability of the DevOps workflow, including build tools like Jenkins, ConcourseCI, Maven, and PyTest, along with automation tools such as Ansible.
"Shift left" to achieve faster innovation with less effort
Leverage Elastic Observability across your application lifecycle to bring new applications to market reliably.