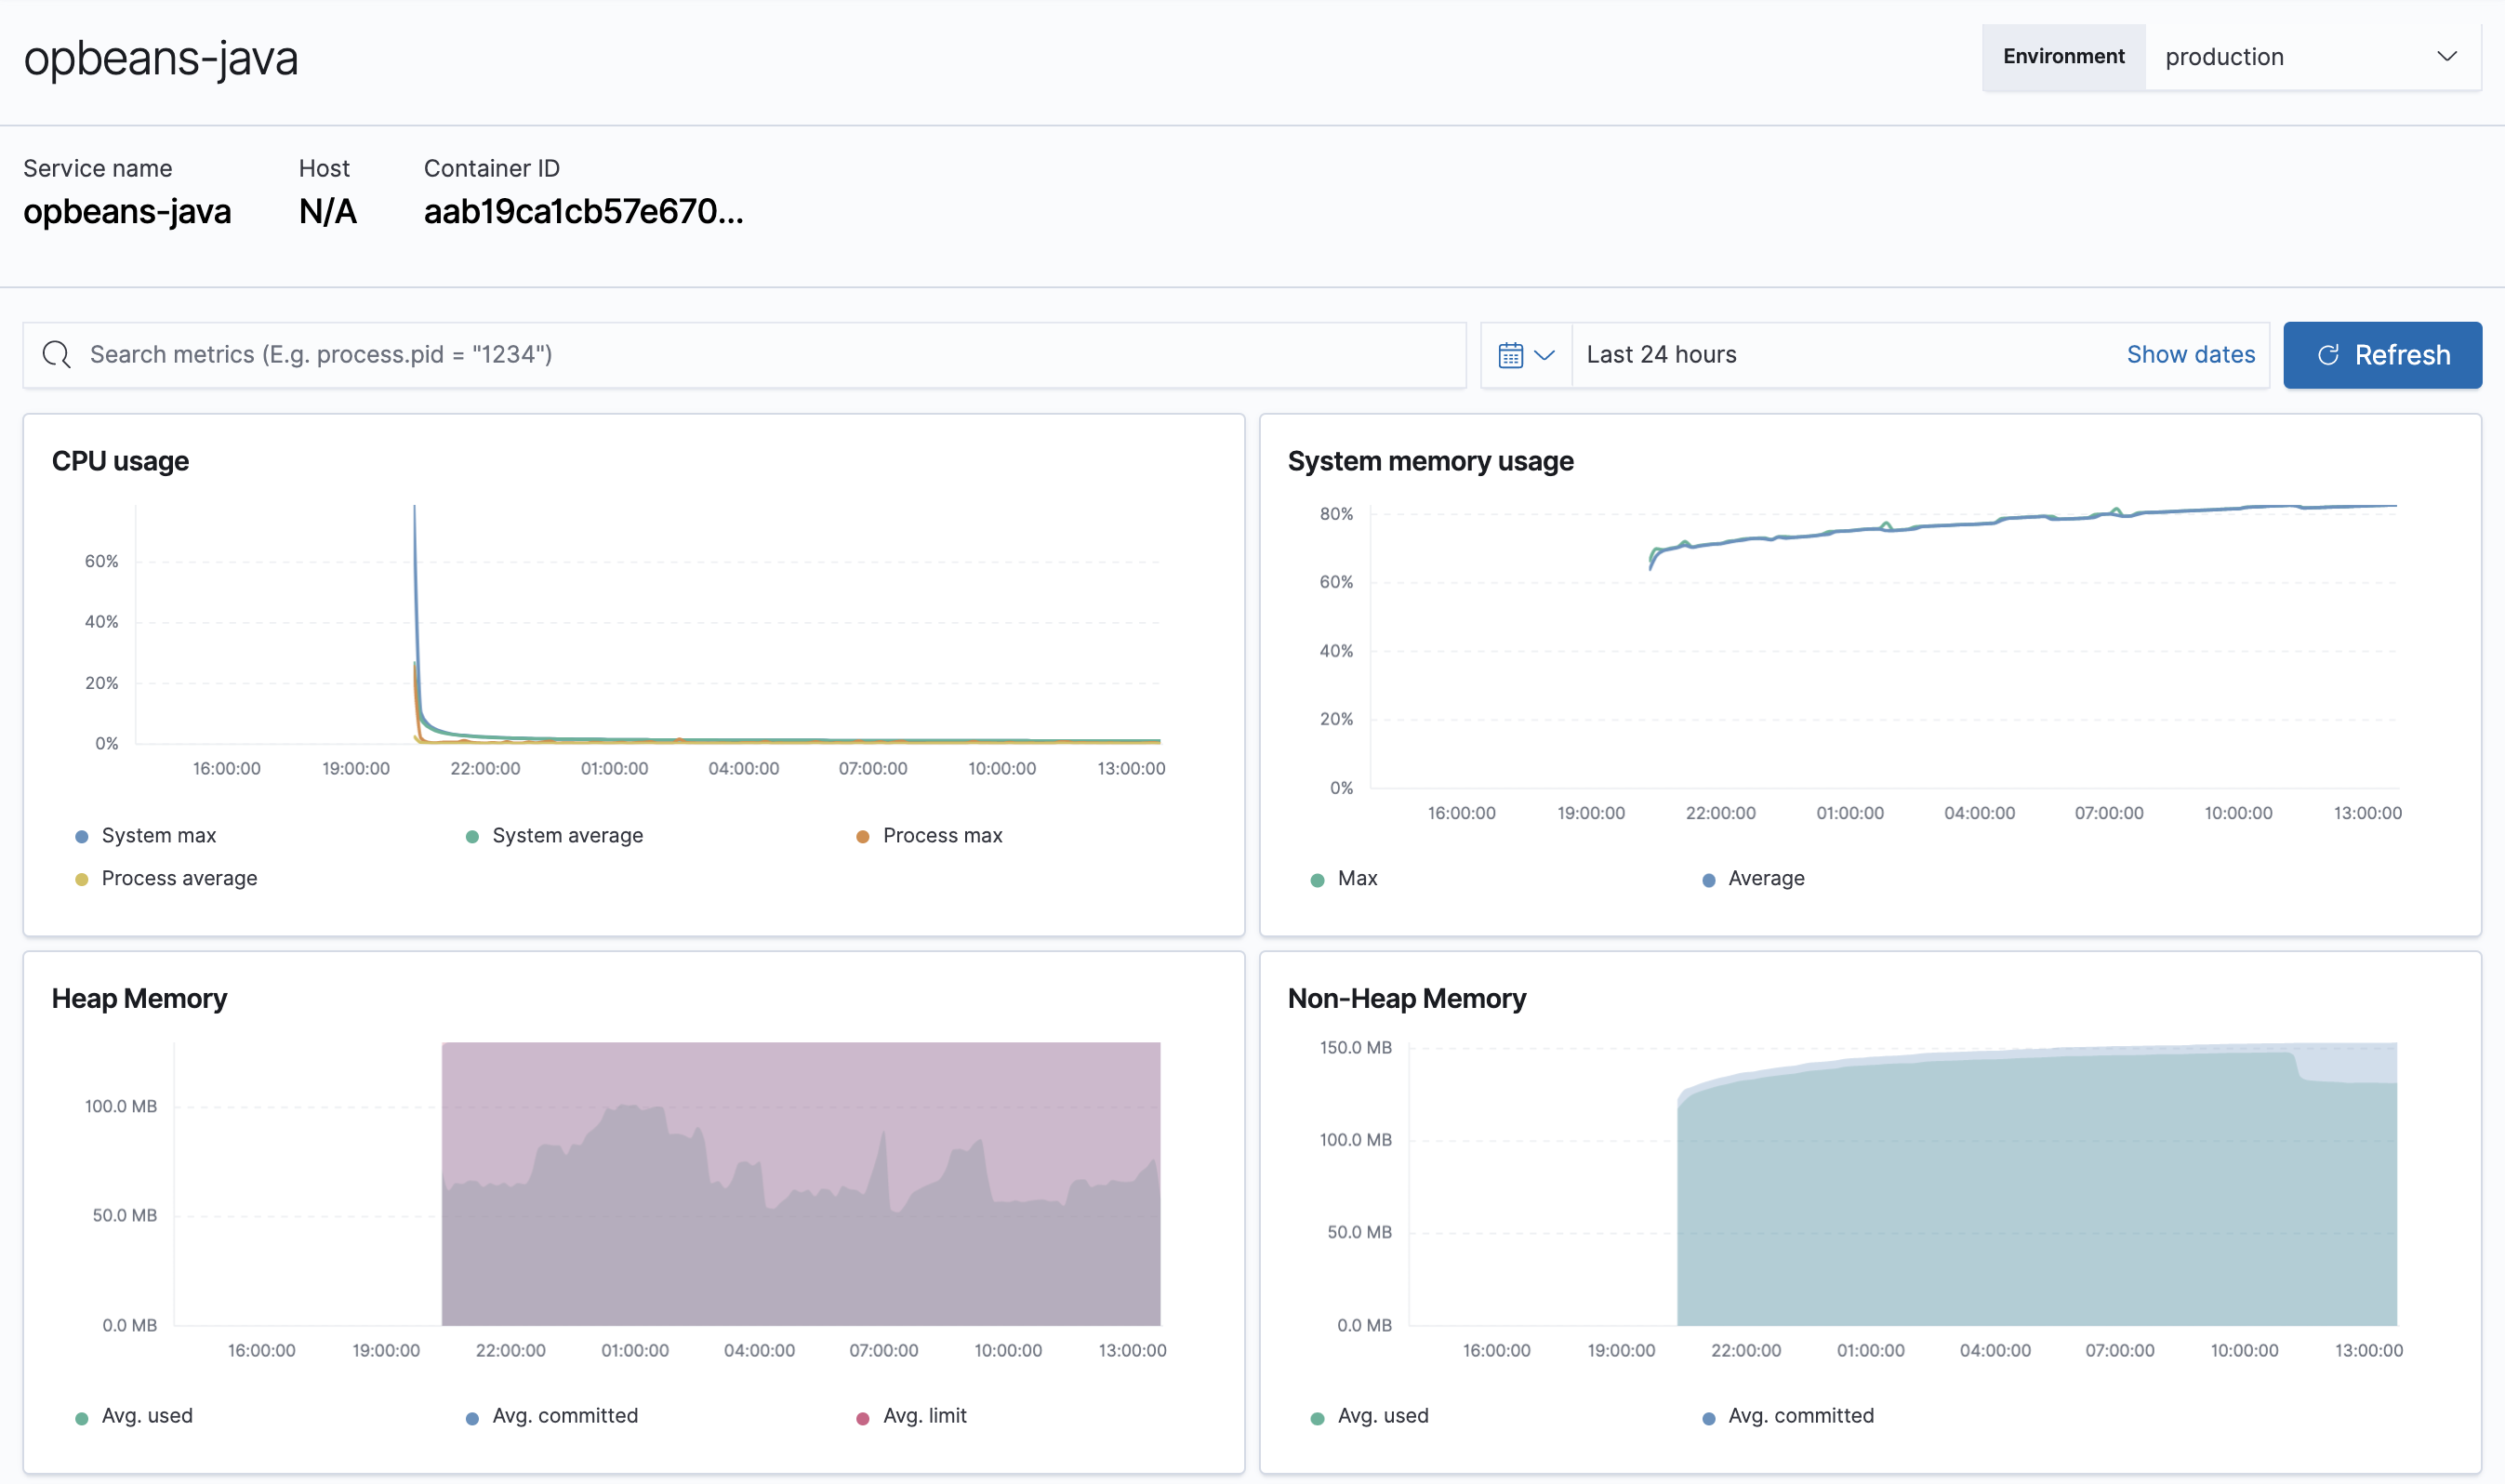
Metrics UI in Elastic APM
The Metrics overview provides APM agent-specific metrics, which lets you perform more in-depth root cause analysis investigations within the Applications UI.
If you’re experiencing a problem with your service, you can use this page to attempt to find the underlying cause. For example, you might be able to correlate a high number of errors with a long transaction duration, high CPU usage, or a memory leak.
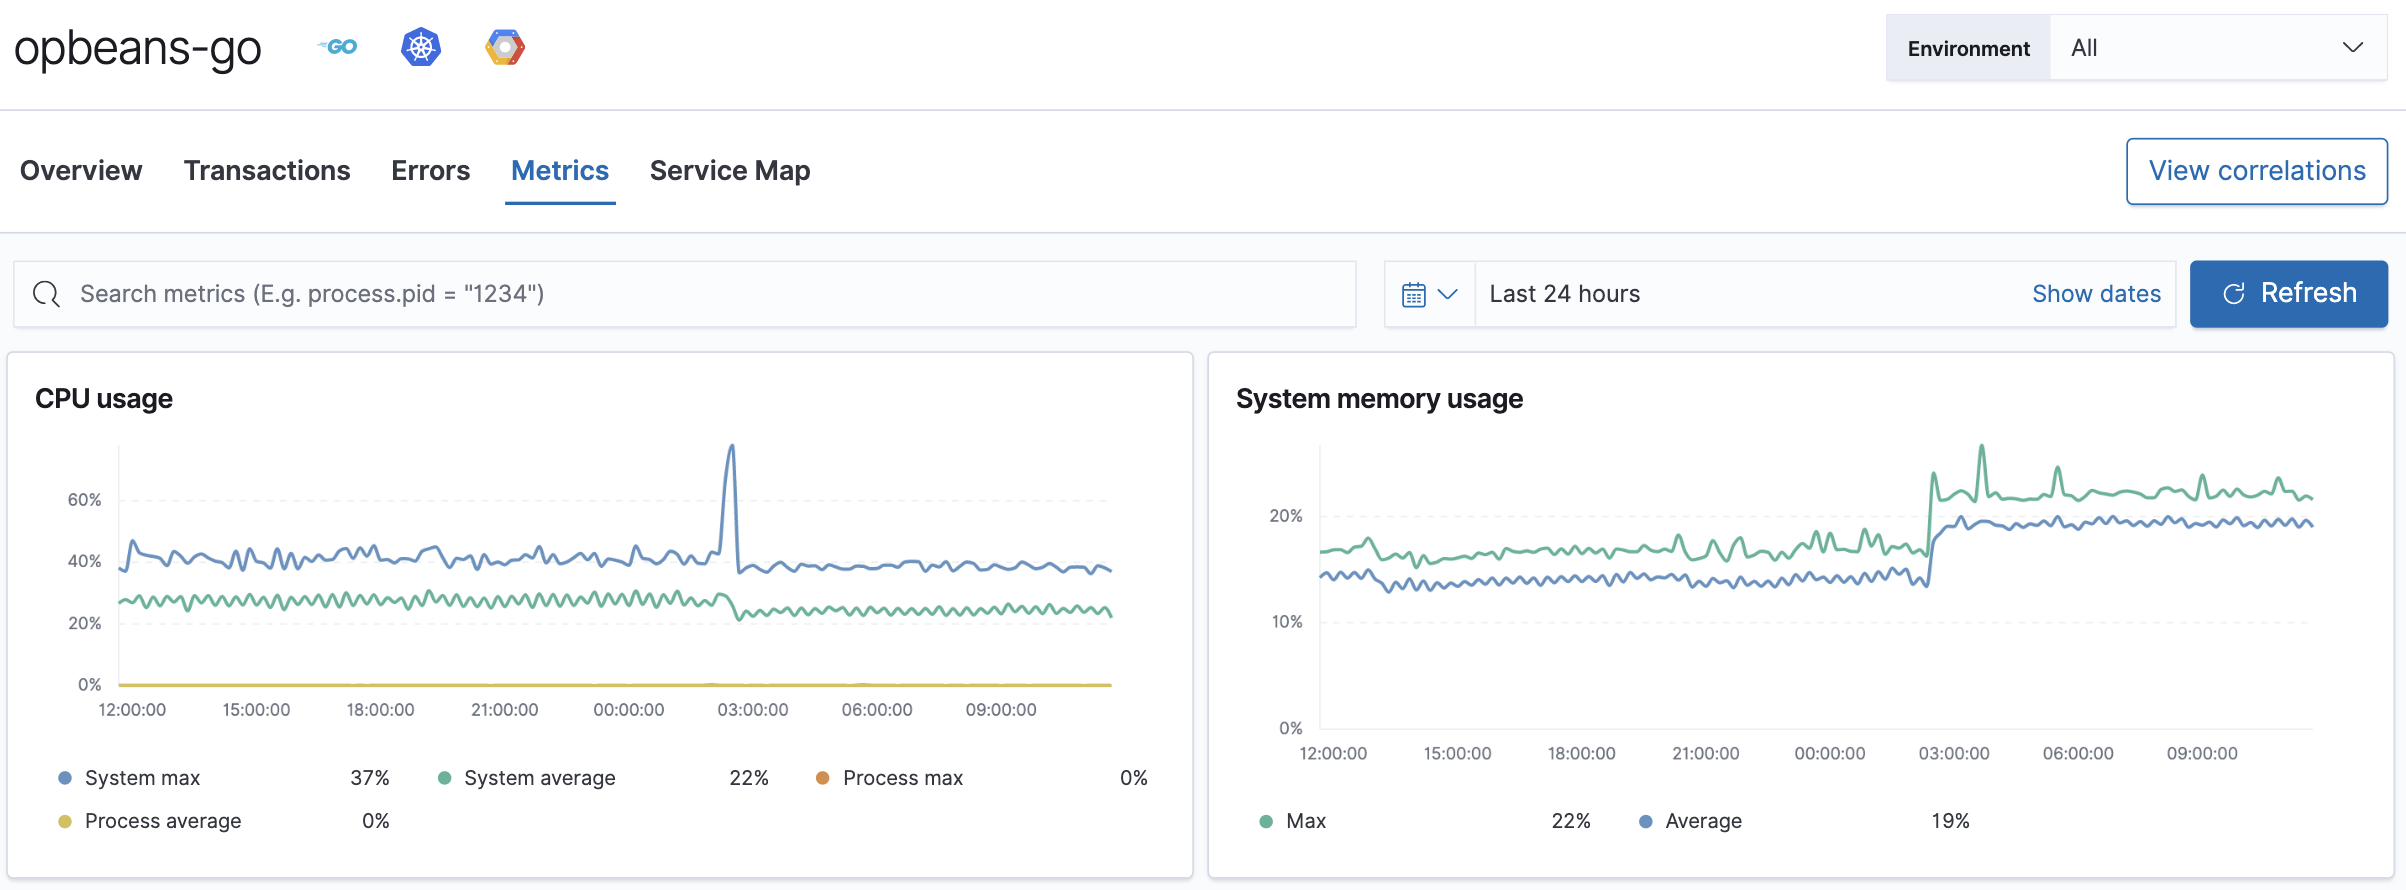
Dashboard resolution is version-aware: the Metrics tab uses the service’s runtime version — alongside data format, SDK name, and language — to load the correct dashboard. For example, .NET 9 and later services use a built-in runtime metrics dashboard, while .NET 8 and earlier services use a legacy contrib metrics dashboard. This ensures you always see the metrics that match your service’s runtime version.
When migrating a service to OpenTelemetry instrumentation, you may have date ranges that contain both classic APM and OpenTelemetry data. The Metrics tab shows callouts to help you navigate this transition period.
- Instrumentation change detected
- When the Metrics tab detects a change in instrumentation, it shows: "We have detected a change on
<timestamp>in the instrumentation of your service." It also shows the current instrumentation type and time period, and provides the date range for the previous instrumentation period so you can switch to it. - Overlapping instrumentation types
- If classic APM and OpenTelemetry data overlap in the selected time range, the Metrics tab shows: "This service has overlapping data from multiple instrumentation types." It provides date ranges for each instrumentation type so you can click to switch to a specific period.
If you’re using the Java APM agent, you can view metrics for each JVM.
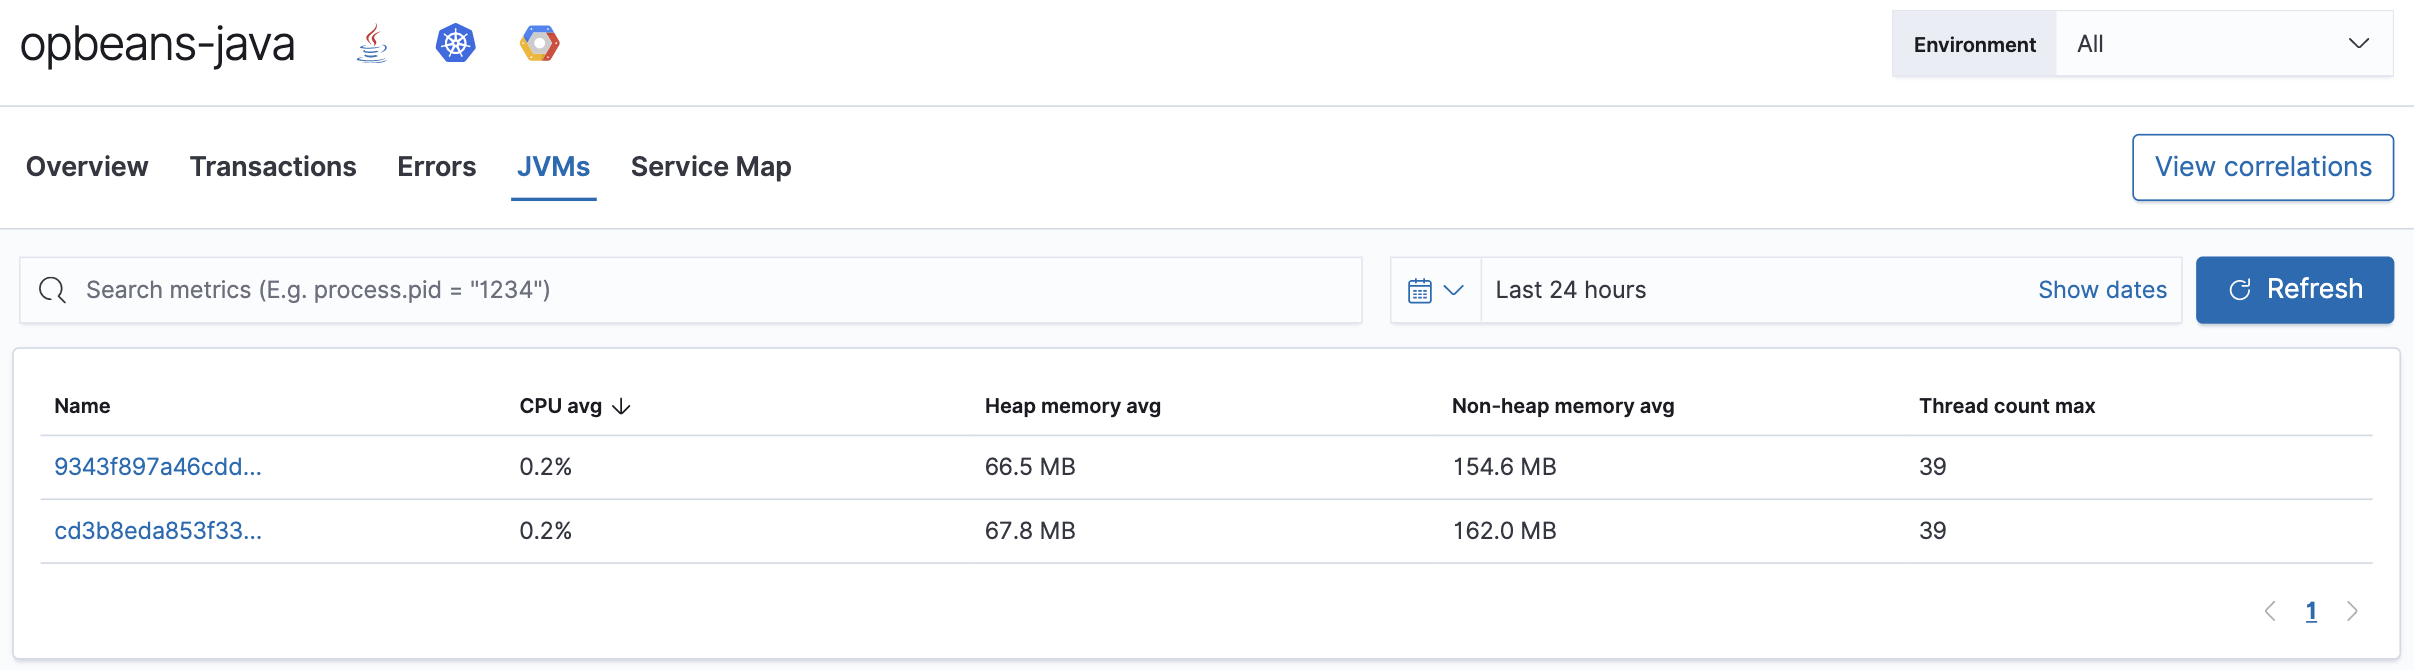
Breaking down metrics by JVM makes it much easier to analyze the provided metrics: CPU usage, memory usage, heap or non-heap memory, thread count, garbage collection rate, and garbage collection time spent per minute.