Configure Synthetics settings
There are several Synthetics settings you can adjust in Observability.
Alerting enables you to detect complex conditions using rules across Observability and send a notification using connectors.
When you create a new synthetic monitor, Synthetics applies default rules to the monitor. To edit the default rules:
Click Alerts in the application menu.
Select a rule to open a panel where you can edit the rule’s configuration:
- Monitor status rule for receiving notifications for errors and outages
- TLS certificate rule for receiving notifications when one or more of your HTTP or TCP lightweight monitors has a TLS certificate expiring within a specified threshold or when it exceeds an age limit
However, the automatically created Synthetics internal alert is intentionally preconfigured, and some configuration options can’t be changed. For example, you can’t change how often it checks the rule.
If you need specific alerting behavior, set up a different rule. To view all existing rules or create a new rule:
- Click Alerts in the application menu.
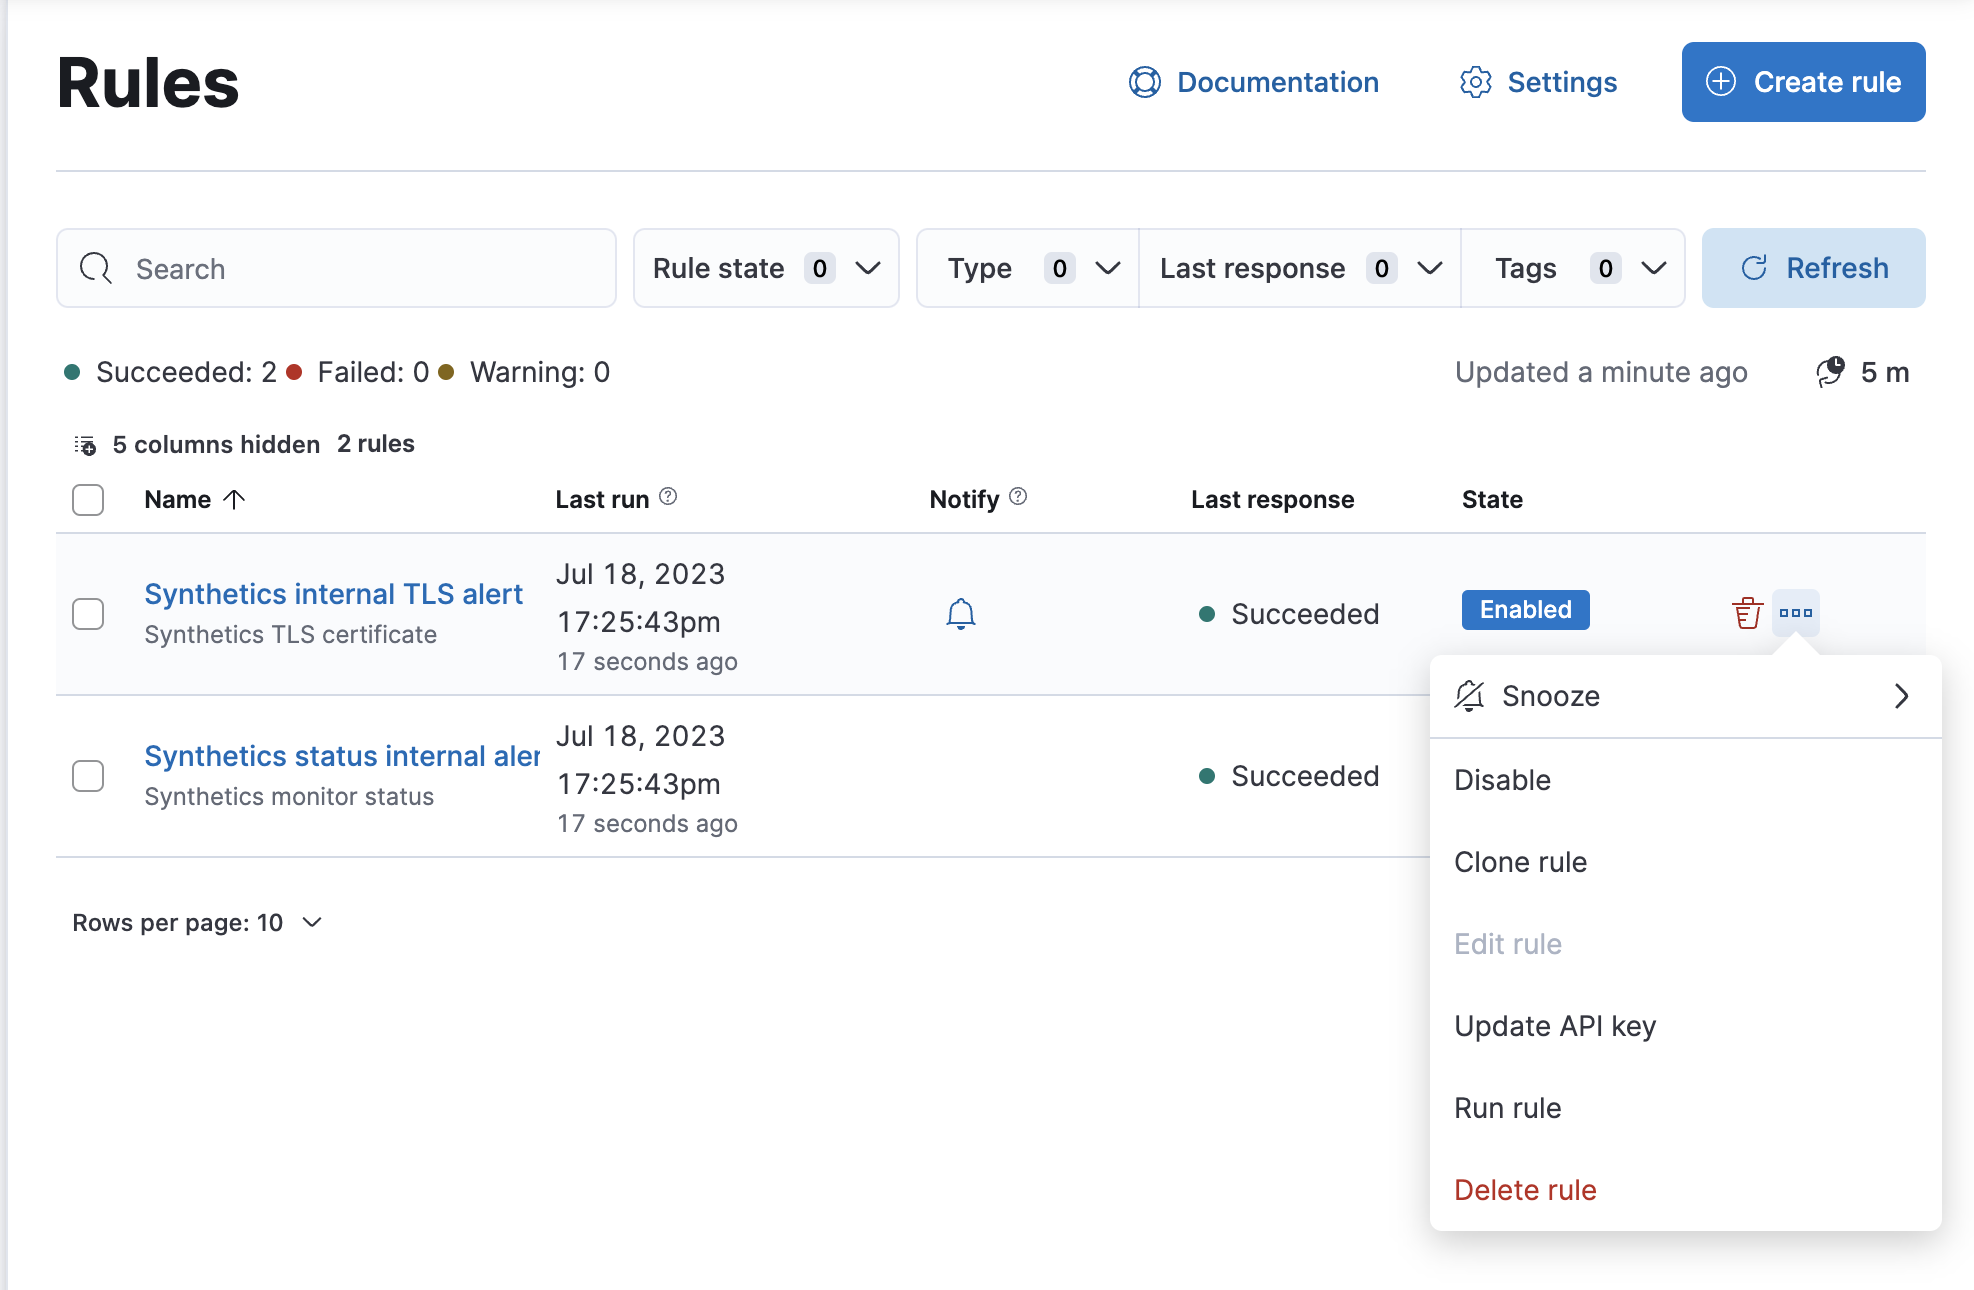
- Click Manage rules to go to the Rules page.
On the Rules page, you can manage the default synthetics rules including snoozing rules, disabling rules, deleting rules, and more.
You can turn on and turn off default alerts for individual monitors in a few ways:
- In the Synthetics UI when you create a monitor.
- In the Synthetics UI after a monitor is already created, on the Monitors page or on the Edit monitor page for the monitor.
- In Synthetics projects when configuring a lightweight monitor.
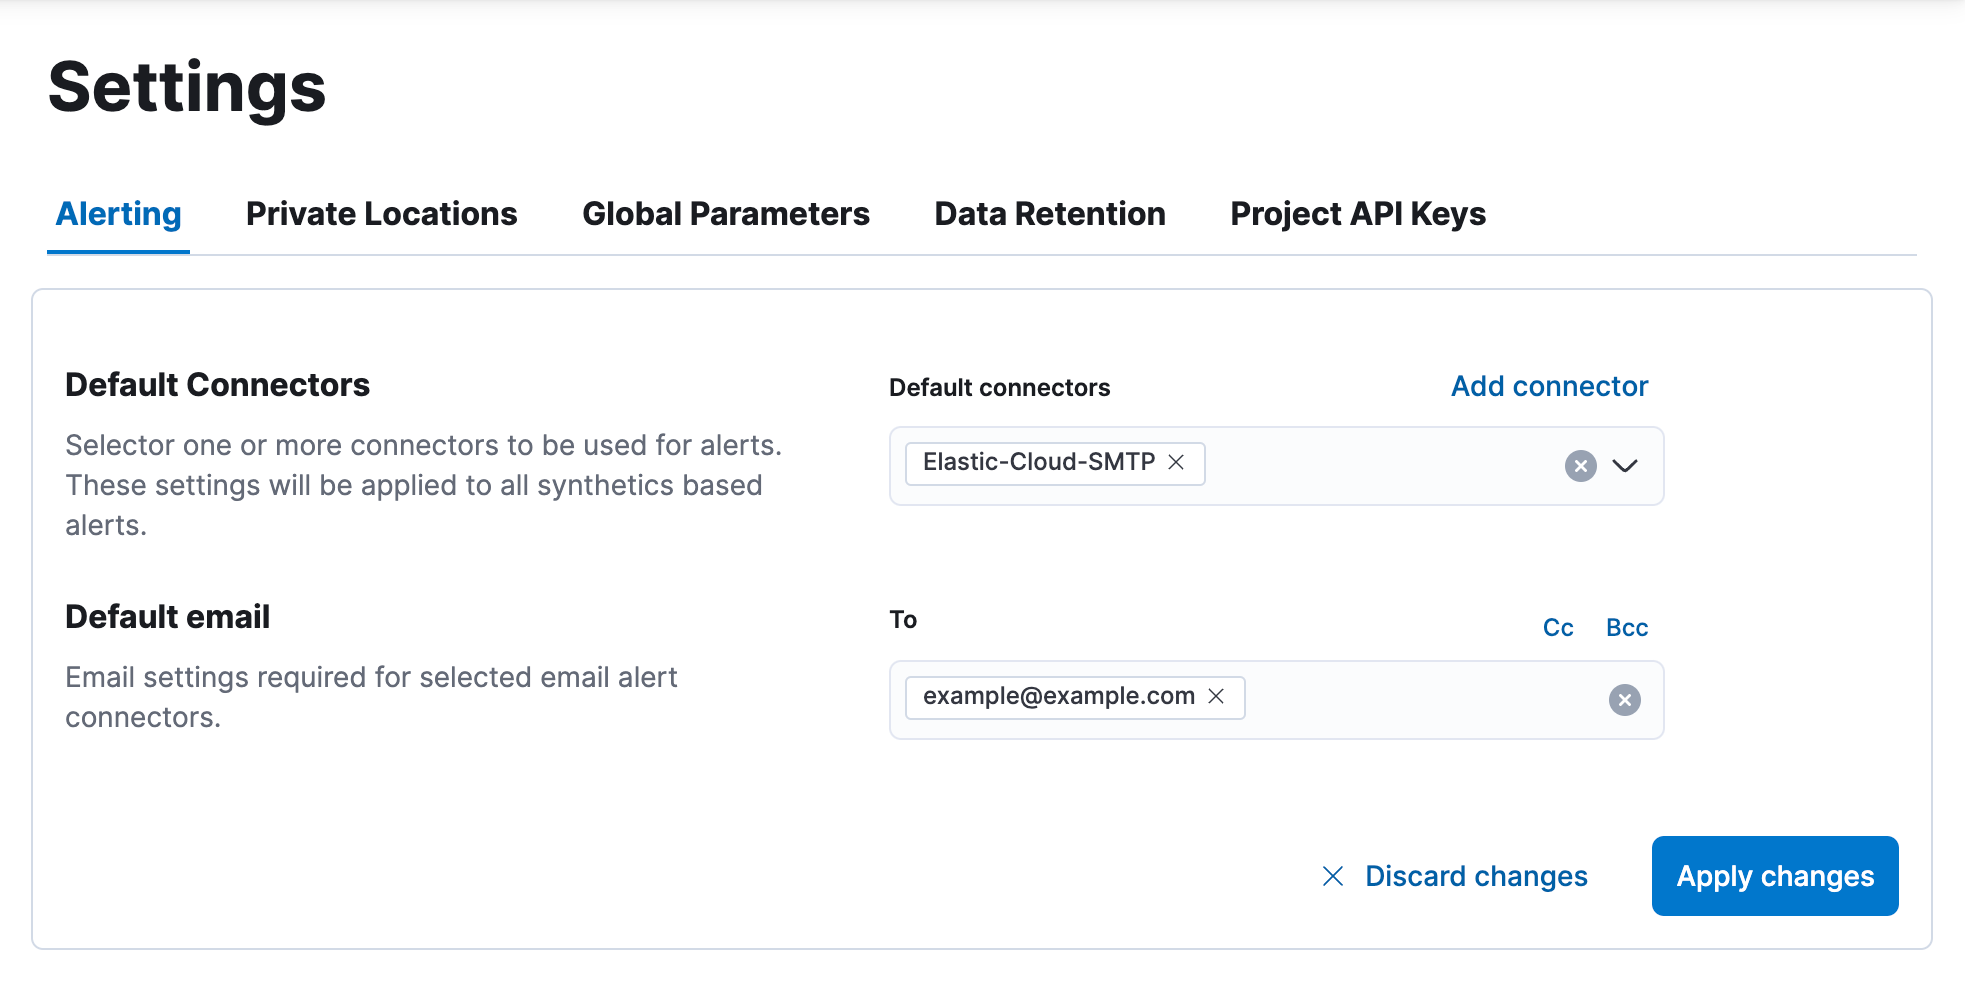
In the Alerting tab on the Monitor Settings page, you can:
- Turn on or turn off default rules.
- Add and configure connectors. For available connectors, refer to Action types.
- Set up email alerts, if you are running in Elastic Cloud. An SMTP connector is automatically configured.
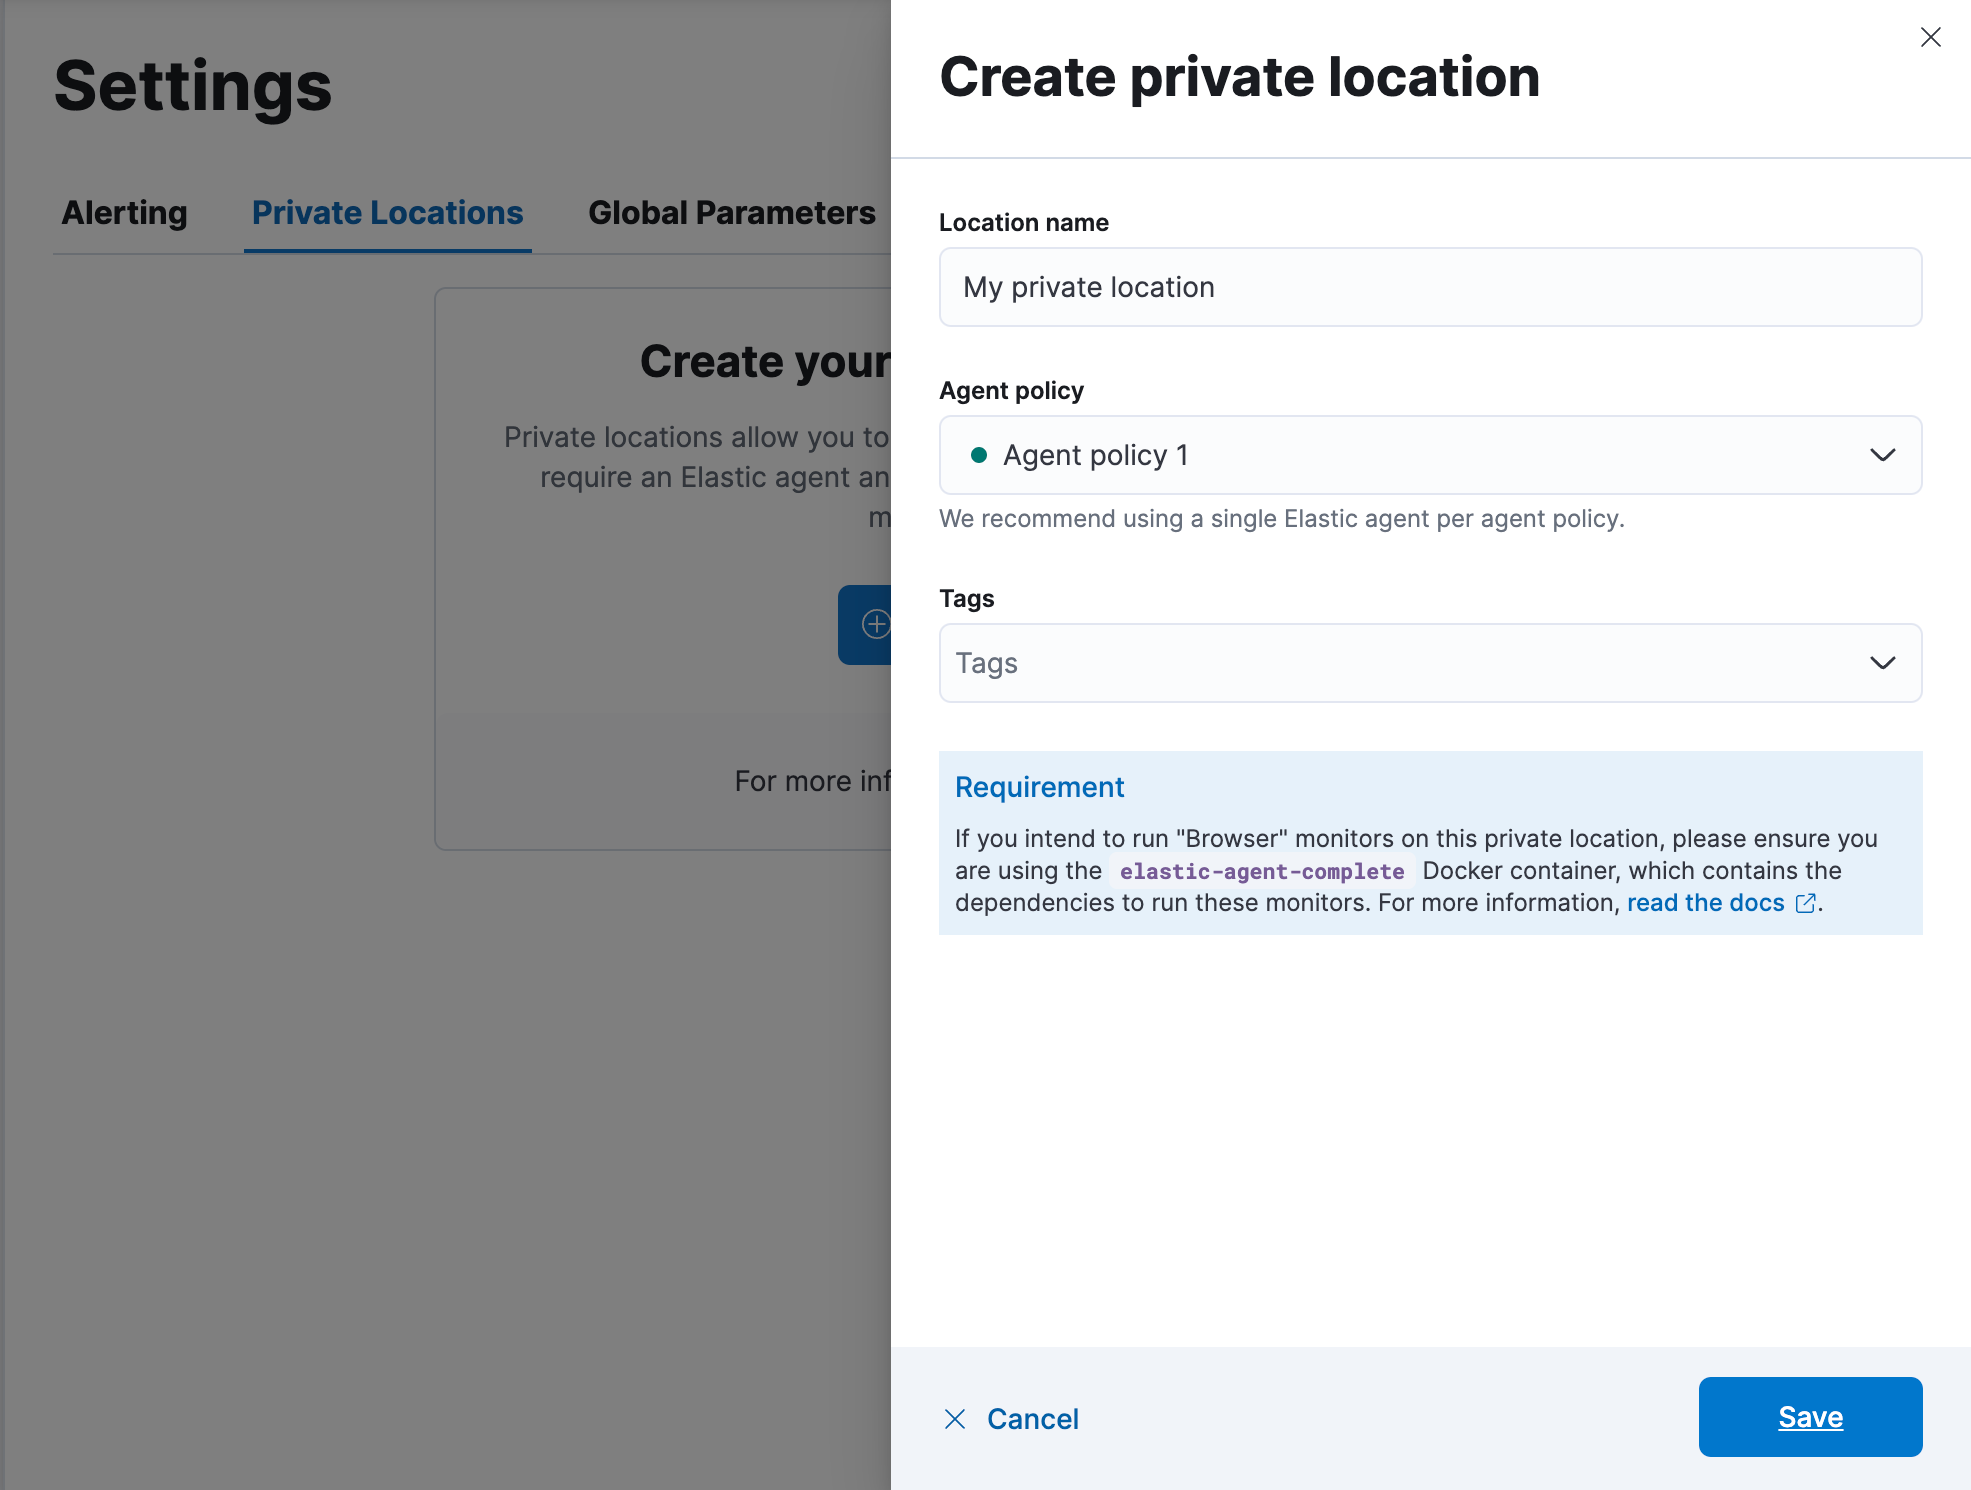
Private Locations allow you to run monitors from your own premises.
In the Private Locations tab, you can add and manage Private Locations. After you Set up Fleet Server and Elastic Agent and Connect to the Elastic Stack or your serverless Observability project, this is where you add the Private Location so you can specify it as the location for a monitor created using the Synthetics UI or a Synthetics project.
missing_package_policy status. Monitors with other failure types are excluded and must be resolved manually. Refer to Monitor integration health for details on failure types and remediation steps.
The Private Locations table shows the state of the Elastic Agents that run each location's monitors:
- Agent Policy: Displays the name of the location's agent policy. A scalable Private Location shows a Scalable badge with the number of enrolled agents, whereas a classic location shows the number of agents on its policy. Click the policy name to view its status, enrolled agents, and healthy agents. To open it in Fleet, click View policy in Fleet.
- Health: Shows how many of the location's agents are healthy, for example
2/3 healthy. An agent is healthy when Fleet reports it as online.
To view details for each agent, expand the location's row. The Agents overview panel shows:
- The number of Monitors, Agents, and Healthy agents in the location, and the Total memory used and available across its agents.
- Monitors per agent. Each row is one agent, with its Monitors, Monitors run, Memory (used / total), CPU, Status, and Last agent check-in. Monitors run is the share of the location's monitors that the agent runs. In a scalable location, each monitor runs on one agent. In a classic location, every agent runs all of the location's monitors.
- A Needs attention callout when agents aren't reporting as online, or when an agent uses 85% or more of its memory.
Click an agent's name to view its health, capacity, and Fleet details. To open it in Fleet, click View policy in Fleet. Use View agent policy and Manage agents in Fleet to open the agent policy and its agents in Fleet.
Memory and CPU show N/A for agents that don't report host metrics. To report them, add the System integration to the agent policy.
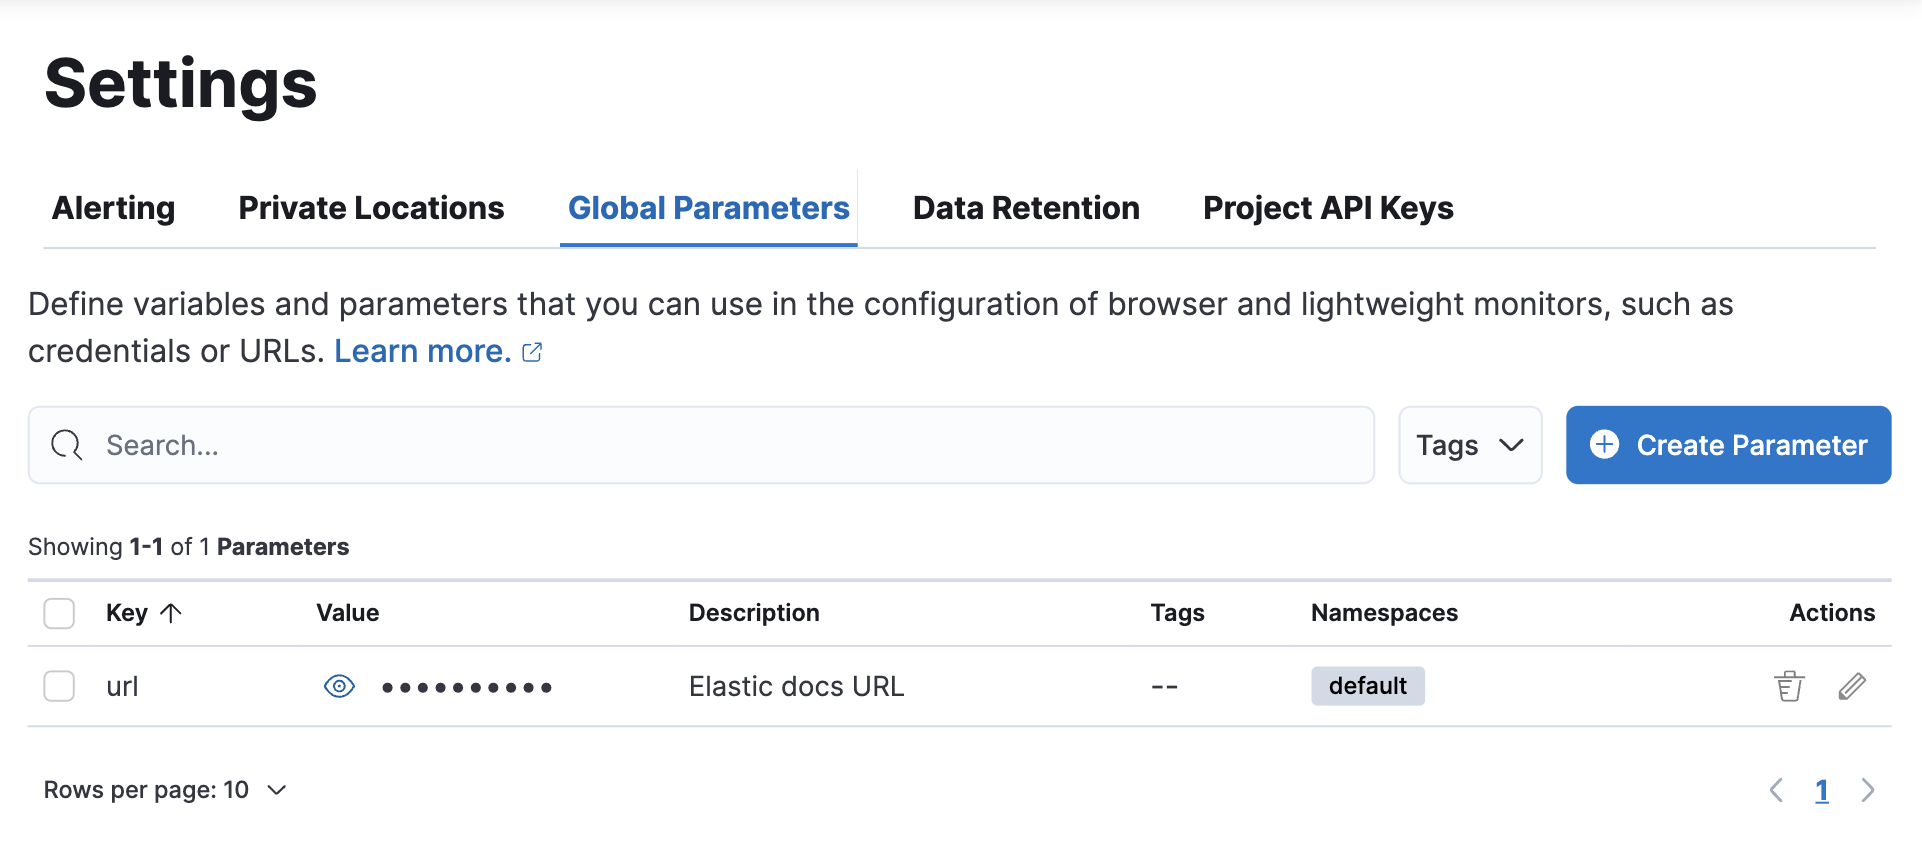
Global parameters can be defined once and used across the configuration of lightweight and browser-based monitors.
In the Global parameters tab, you can define variables and parameters. This is one of several methods you can use to define variables and parameters. To learn more about the other methods and which methods take precedence over others, see Work with params and secrets.
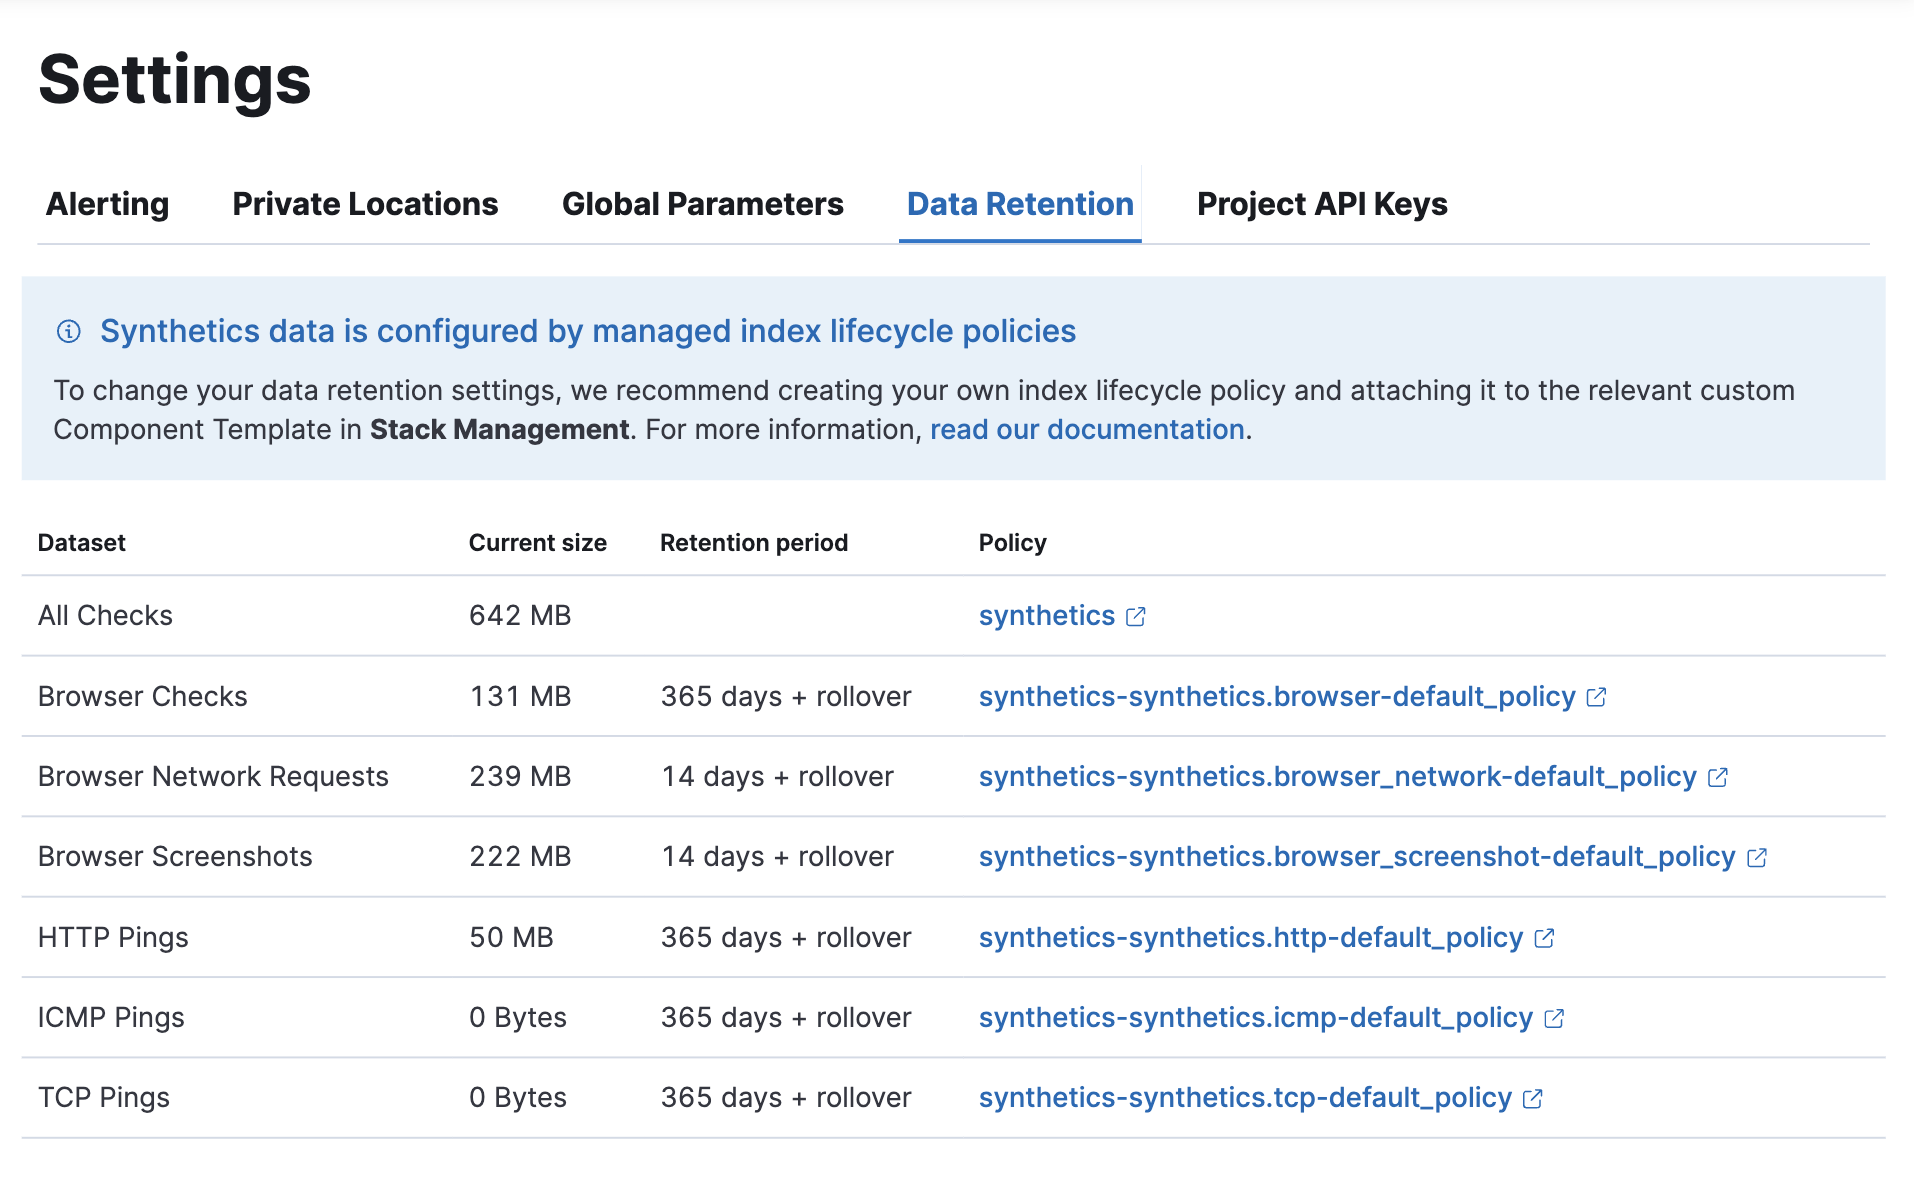
When you set up a synthetic monitor, data from the monitor is saved in Elasticsearch data streams, an append-only structure in Elasticsearch. You can customize how long synthetics data is stored by creating your own index lifecycle policy and attaching it to the relevant custom Component Template.
In the Data retention tab, use the links to jump to the relevant policy for each data stream. Learn more about the data included in each data stream in Manage data retention.
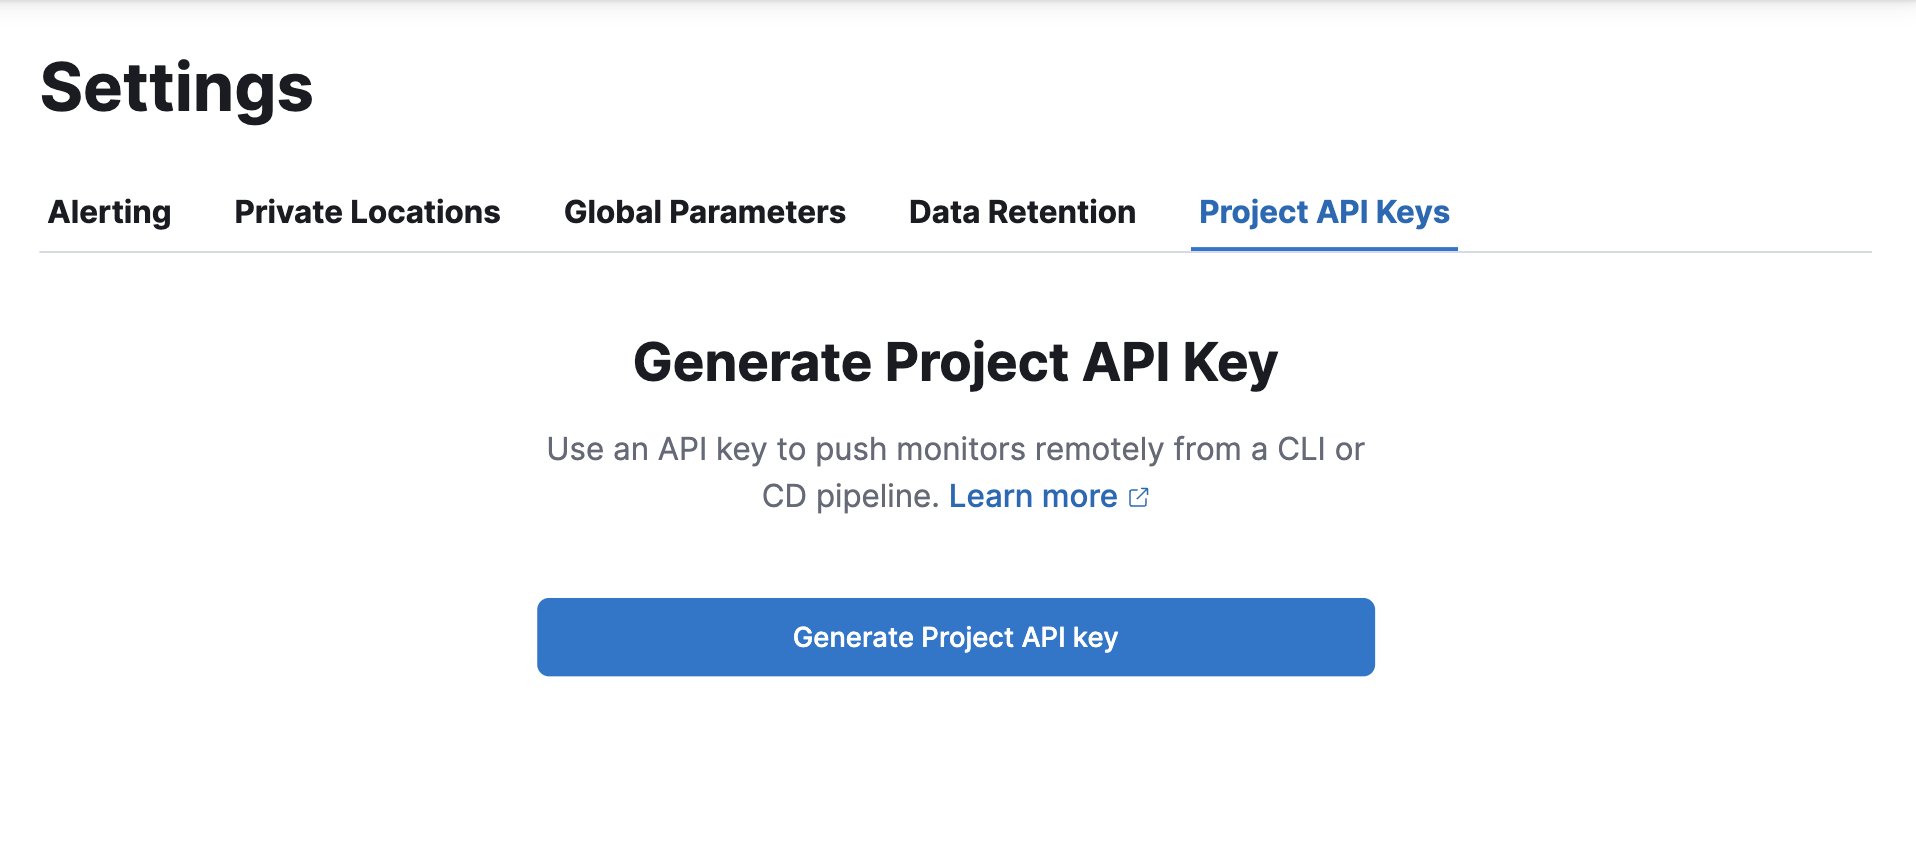
Project API keys are used to push project monitors remotely from a CLI or CD pipeline.
In the Project API keys tab, you can generate project API keys to use with your projects. Learn more about using API keys in Use Project monitors.
In an Elastic Stack deployment, to create a Project API key you must be logged into Kibana as a user with the privileges described in Writer role.
In a serverless project, to create a Project API key you must be logged in as a user with Editor access.
- The Elastic managed locations enabled toggle controls whether your Synthetics monitors are permitted to run from Elastic's globally distributed, cloud-hosted testing infrastructure. If enabled, the key can push monitors to both Elastic-managed and private locations. If disabled, the key is restricted to private locations only.
- The Spaces menu allows you to select the space where your API keys are available.
In the Remote clusters tab, you can configure cross-cluster search (CCS) settings so that Synthetics can include monitor data from remote Elasticsearch clusters alongside local monitors. CCS is off by default; on first save, the settings are anchored to the space you are currently in.
These settings are stored as a single shared configuration — one per deployment, not a separate copy per space. Use the Spaces field to control which Kibana spaces it applies to.
To edit these settings, you must have the All privilege for the Synthetics and Uptime feature in Stack Management → Roles → Kibana privileges → Observability. Users with only the Read privilege see the form as read-only.
On Elastic Cloud Serverless, after you link projects, you can view monitors from those projects without any additional configuration. Refer to Monitors from linked projects.
Use the Use all remote clusters toggle or Select remote clusters combo box to control which remote clusters Synthetics queries:
- Turn on Use all remote clusters to include monitor data from all configured remote clusters.
- Turn off Use all remote clusters and use the Select remote clusters combo box to choose specific clusters. Each cluster is shown with a connected or disconnected status indicator.
To configure remote clusters, go to Stack Management → Remote Clusters.
Use the Spaces combo box to control which Kibana spaces can access these CCS settings. Select one or more specific spaces, or select All spaces to make the settings available across your entire deployment. Removing a space makes these settings inaccessible there, and Synthetics no longer includes monitor data from remote clusters in that space.
The Spaces field shows the current sharing configuration when you open the tab (your current space by default). Clearing the field and saving leaves that configuration unchanged, meaning it does not remove access from existing spaces. To update which spaces have access, select the new spaces explicitly.
In the Advanced tab, you can configure advanced settings for your Synthetics deployment.
Private location monitors are periodically synced to apply active maintenance window changes. The Maintenance windows sync interval setting controls how frequently this sync occurs.
Use the Sync interval (minutes) field to set the interval. The default is 5 minutes, and valid values range from 5 to 1440 minutes. When you apply a new interval, an immediate sync is triggered so the change takes effect right away.
When a maintenance window becomes active, a callout in the Synthetics UI displays the estimated delay for applying changes to private location monitors: "It may take up to X minutes for maintenance window changes to be applied to private location monitors," where X equals the configured sync interval. Click Sync now in the callout to trigger an immediate sync without waiting for the interval.
A separate callout appears when maintenance windows are modified or deleted but changes have not yet propagated to your private location monitors.
Synthetics regularly reassigns monitors across the healthy agents of scalable Private Locations. The Rebalance private location shards switch controls this for all Kibana spaces. It's on by default.
Turning off Rebalance private location shards also removes the agent assignment from every monitor in every scalable Private Location. Each monitor then runs on every agent enrolled on its location's agent policy, which duplicates test runs. When you turn the switch back on, Synthetics reassigns the monitors right away.