Manage discoveries from the Attack Discovery page
This page describes how to change status, share, bulk-act on, and search saved discoveries directly from the Attack Discovery page. For a unified, alert-correlated view that also supports triage actions like assignment and tagging, use the Attacks page instead.
Manage discoveries from the Attacks view.
Recent Attack Discovery generations appear as status callouts on the Attack Discovery page, above your saved discoveries. Use them to check run status while a generation is running or after it finishes.
You can set a discovery's status to indicate that it's under active investigation or that it's been resolved:
| Status | Meaning |
|---|---|
| Open | Needs investigation (default) |
| Acknowledged | Under active investigation |
| Closed | Resolved |
Attacks on the Attacks page use this same status lifecycle.
To change a discovery's status, click Take action, then select Mark as acknowledged or Mark as closed. You can choose to change the status of only the discovery, or of both the discovery and the alerts associated with it.
By default, scheduled discoveries are shared with all users in a Kibana space.
Manually generated discoveries are private by default. To share them, change Not shared to Shared next to the discovery's name.
Once a discovery is shared, its visibility cannot be changed.
You can take bulk actions on multiple discoveries, such as bulk-changing their status or adding them to a case. To do this, select the checkboxes next to each discovery, then click Selected x Attack discoveries and choose the action you want to take.
You can search and filter saved discoveries to help locate relevant findings.
Use the search box to perform full-text searches across your generated discoveries.
Visibility: Use this filter to, for example, show only shared discoveries.
Status: Filter discoveries by their current status.
Connector: Filter discoveries by connector name. Connectors that are deleted after discoveries have been generated are shown with a Deleted tag.
Time filter: Adjust the time filter to view discoveries generated within a specific timeframe.
Use these options to continue an investigation:
- Click an entity's name to open the entity details flyout and view more details that might be relevant to your investigation.
- Hover over an entity's name to either add the entity to Timeline (
 ) or copy its field name and value to the clipboard (
 ).
). - Click Take action, then select Add to new case or Add to existing case to add a discovery to a case. This makes it easy to share the information with your team and other stakeholders.
- Click Investigate in timeline to explore the discovery in Timeline.
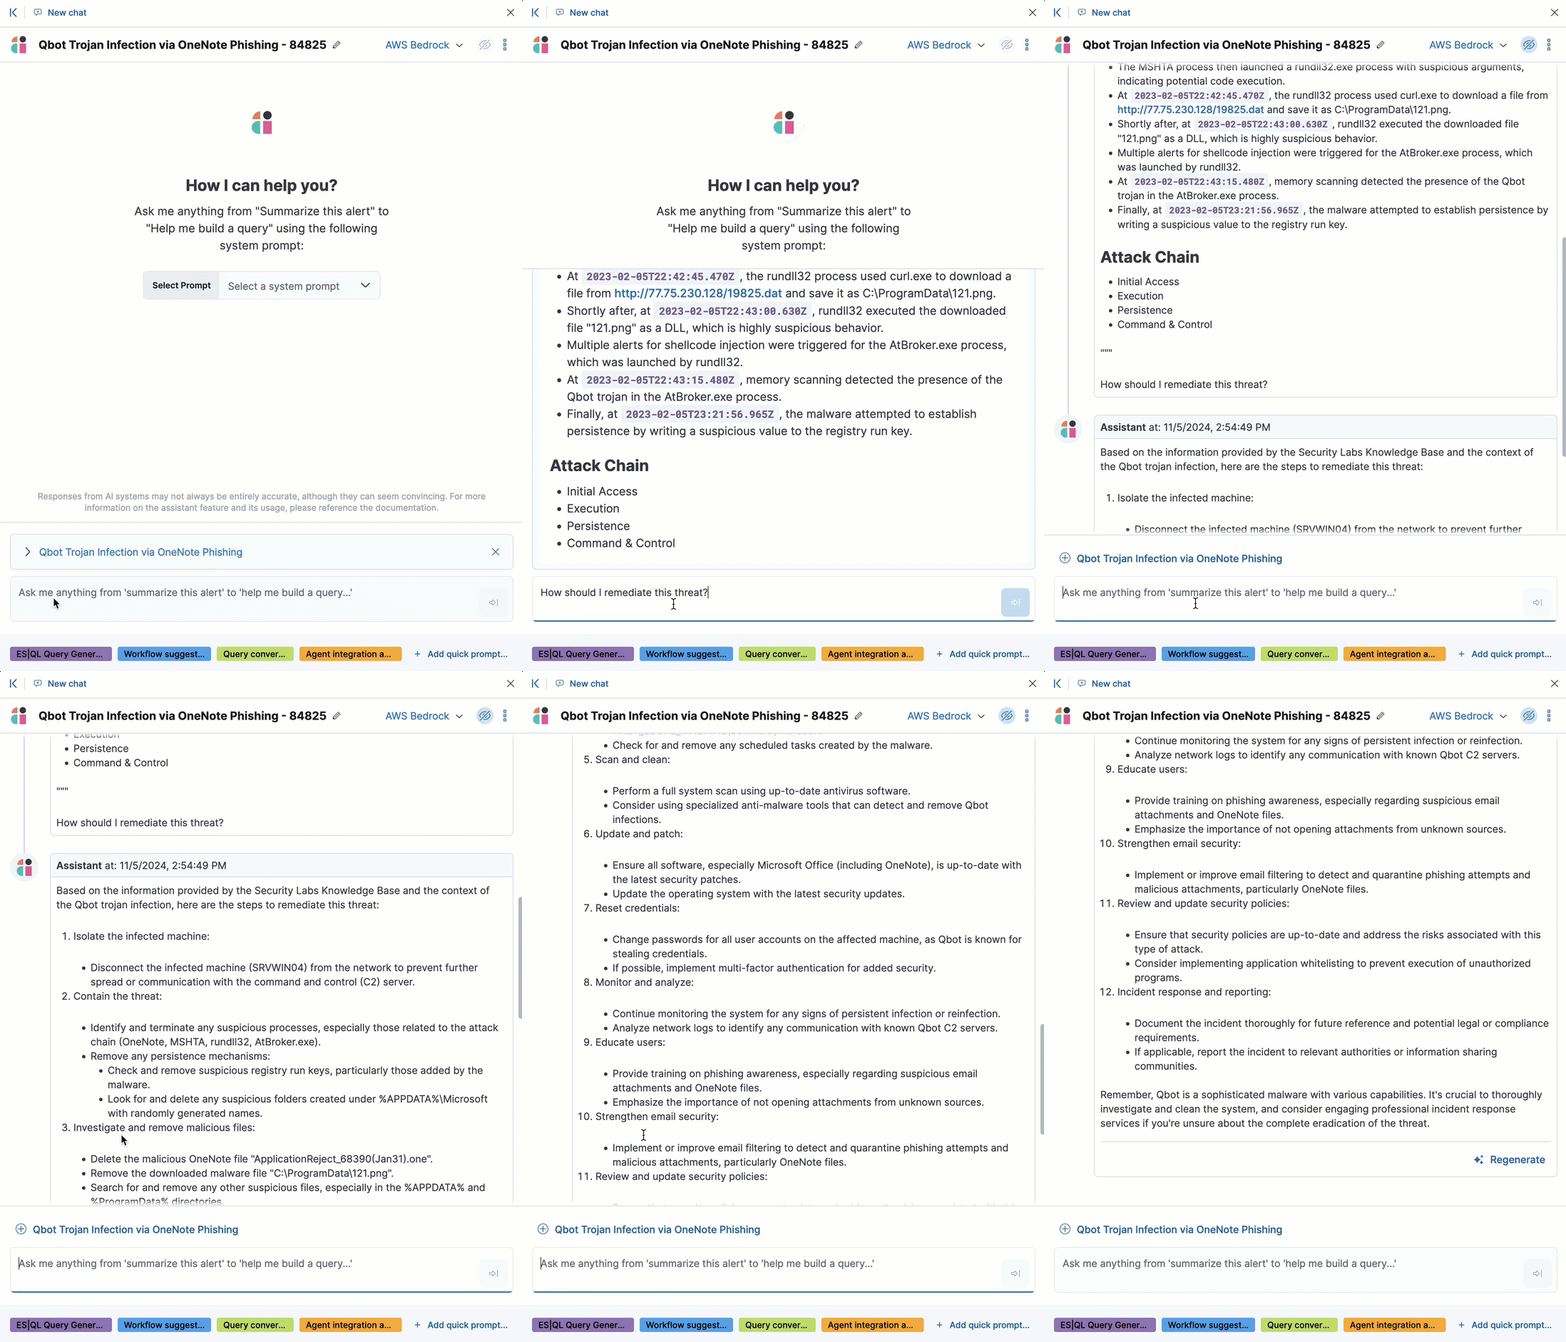
- Click View in AI Assistant or Add to chat to attach the discovery to a conversation. You can then ask follow-up questions about the discovery or associated alerts.
- Automate the triage end-to-end with Elastic Workflows. The AI-driven alert triage workflow shows how to invoke an Agent Builder agent on each discovery, open a case populated with the analysis, isolate the affected host, and notify the SOC.