Logs
To troubleshoot a slow or failed transaction, select a service, then select Logs. The tab shows that service's application and container log events, while maintaining any environment, query, and time range filters already set.
From here you can inspect a specific failure, group similar messages to see what's changed, or jump from a correlated log to its trace.
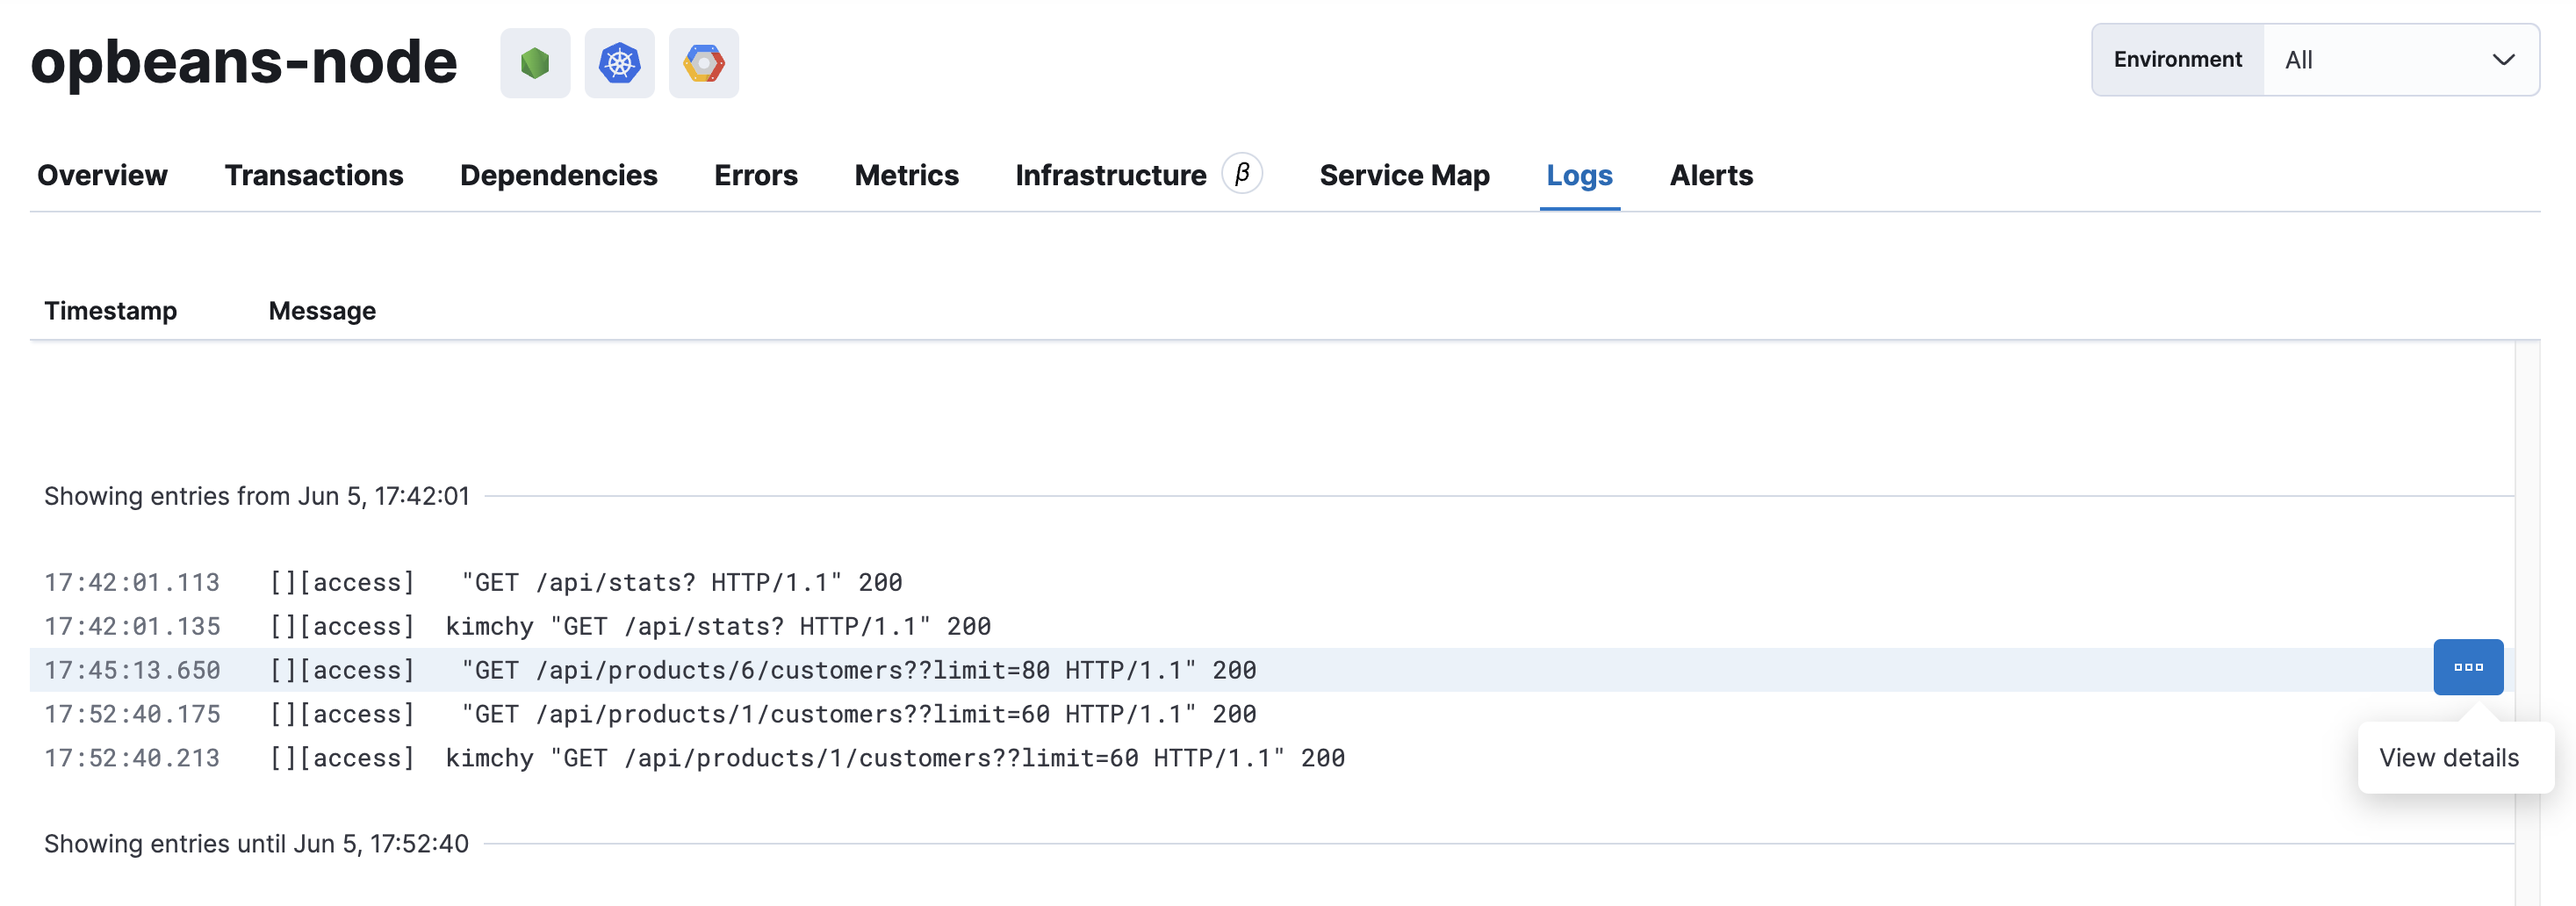
The tab opens with Log Events selected, with the table showing each individual event. Use this view when you already have a specific event in mind: an error message, a timestamp, or a trace.id from a failed transaction. Select a row to inspect the message and fields, or select Open logs in Discover to search the same documents with a wider query.
Select Log Events, then select Log Patterns to group similar messages. Each pattern shows its event count, change type, and change time.
The observability:newLogsOverview advanced setting controls log pattern grouping:
-
The setting is on by default. Turn it off to hide Log Patterns. -
The setting is off by default. Turn it on to use Log Patterns.
The Logs tab searches indices that match the patterns configured in observability:logSources. To include custom log indices, see Configure log data sources.
To send application logs and correlate them with traces, refer to Send application log data.