Manage detection alerts
The Alerts page is your central hub for triaging and investigating detection alerts. Filter alerts to focus on what matters, change statuses to track progress, and take actions to investigate or respond.
A skill is available to help AI agents with this topic.
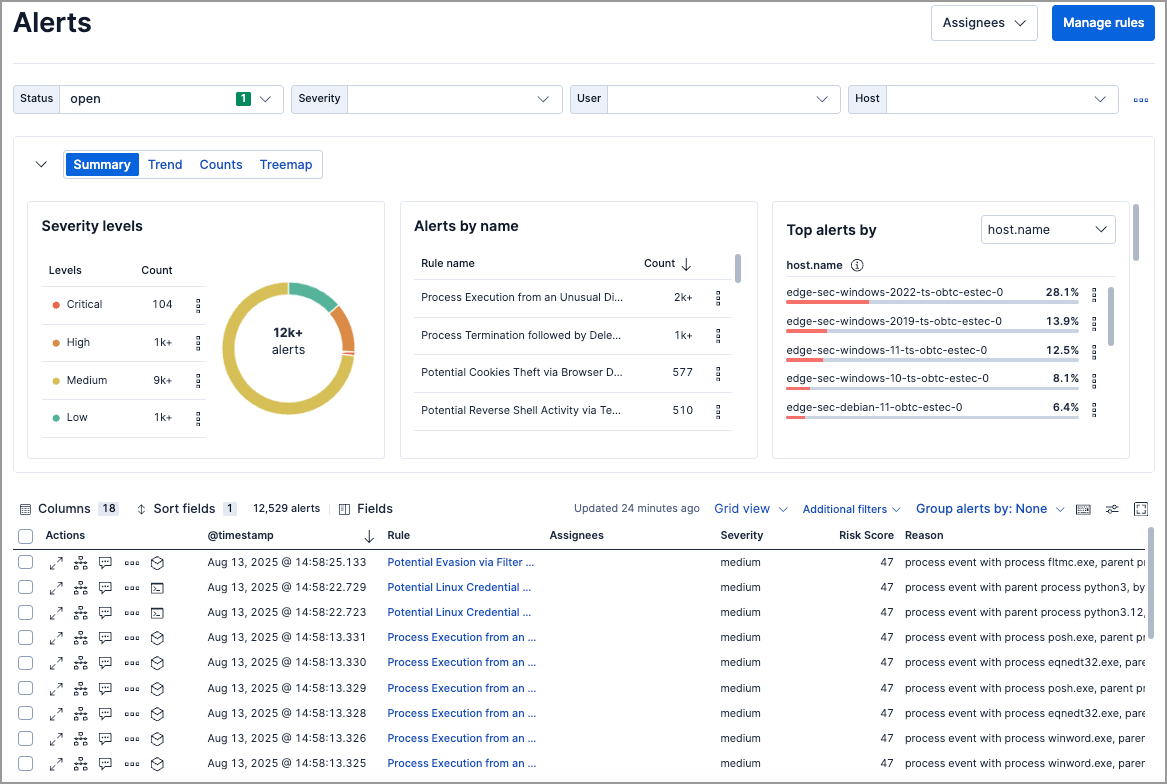
| Task | How to do it |
|---|---|
| View alert details | Click the View details icon in the Alerts table |
| Filter by rule | Use KQL: kibana.alert.rule.name: "Rule Name" |
| Filter by time | Use the date/time picker (default: last 24 hours) |
| Change alert status | Click the More actions icon > select status, or use bulk selection |
| Add to case | Click the More actions icon > Add to case |
| Investigate in Timeline | Click Investigate in timeline icon |
| Add exception | Click the More actions icon > Add exception |
| Filter method | Description |
|---|---|
| KQL search | Enter queries like kibana.alert.rule.name: "SSH from the Internet". Autocomplete is available for .alerts-security.alerts-* indices. |
| Date/time picker | Set a specific time range (default: last 24 hours). |
| Drop-down controls | Filter by status, severity, user, host, or custom fields. |
| Additional filters | Include building block alerts or show only indicator match rule alerts. |
| Visualization section | Group and visualize alerts by field. Refer to Visualize detection alerts. |
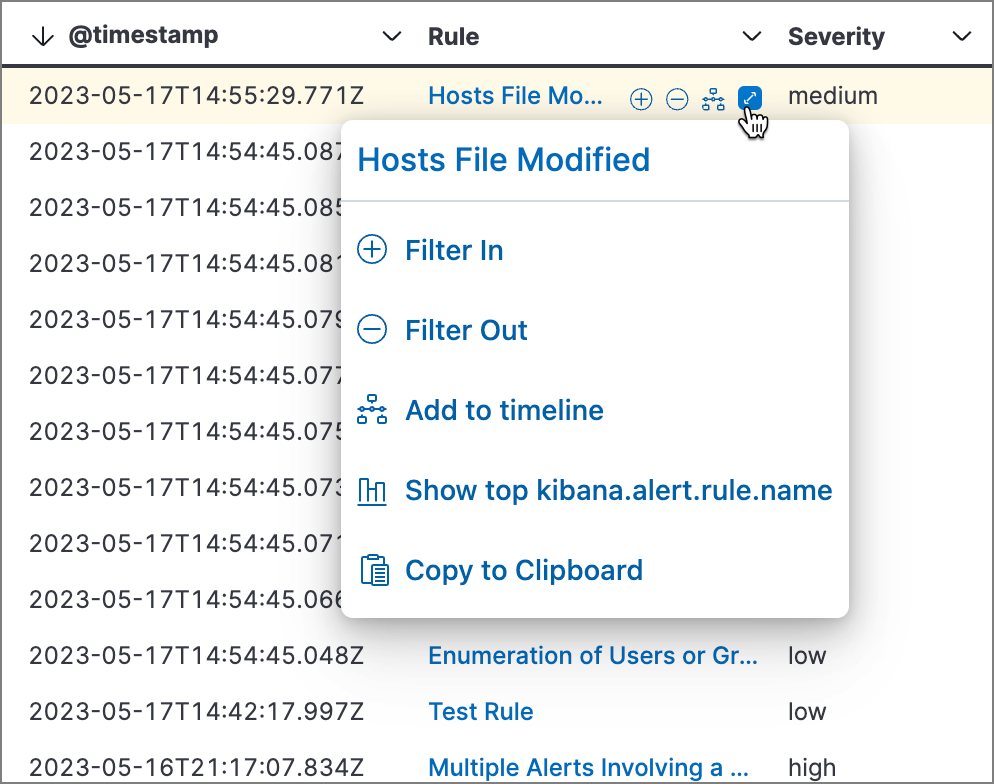
Hover over any value in the Alerts table to see inline actions. Click the expand icon for more options:
| Action | Description |
|---|---|
| Filter for value | Add the value as a filter |
| Filter out value | Exclude the value |
| Show top x | View most common values |
| Add to timeline | Add the field value to Timeline for investigation |
| Copy to clipboard | Copy the value |
Go to Rules > Detection rules (SIEM), then select a rule name. The rule details page shows all alerts from that rule, including alerts from previous rule revisions.
Customize the filter controls above the Alerts table. By default, you can filter by Status, Severity, User, and Host.

| Action | How to do it |
|---|---|
| Edit controls | Click next to controls > Edit Controls |
| Reorder | Drag controls by their handle |
| Remove | Hover over control > click Remove control |
| Add | Click Add Controls (maximum 4) |
| Save changes | Click Save pending changes |
- The Status control cannot be removed.
- Changes are saved in your browser's local storage, not your user profile.
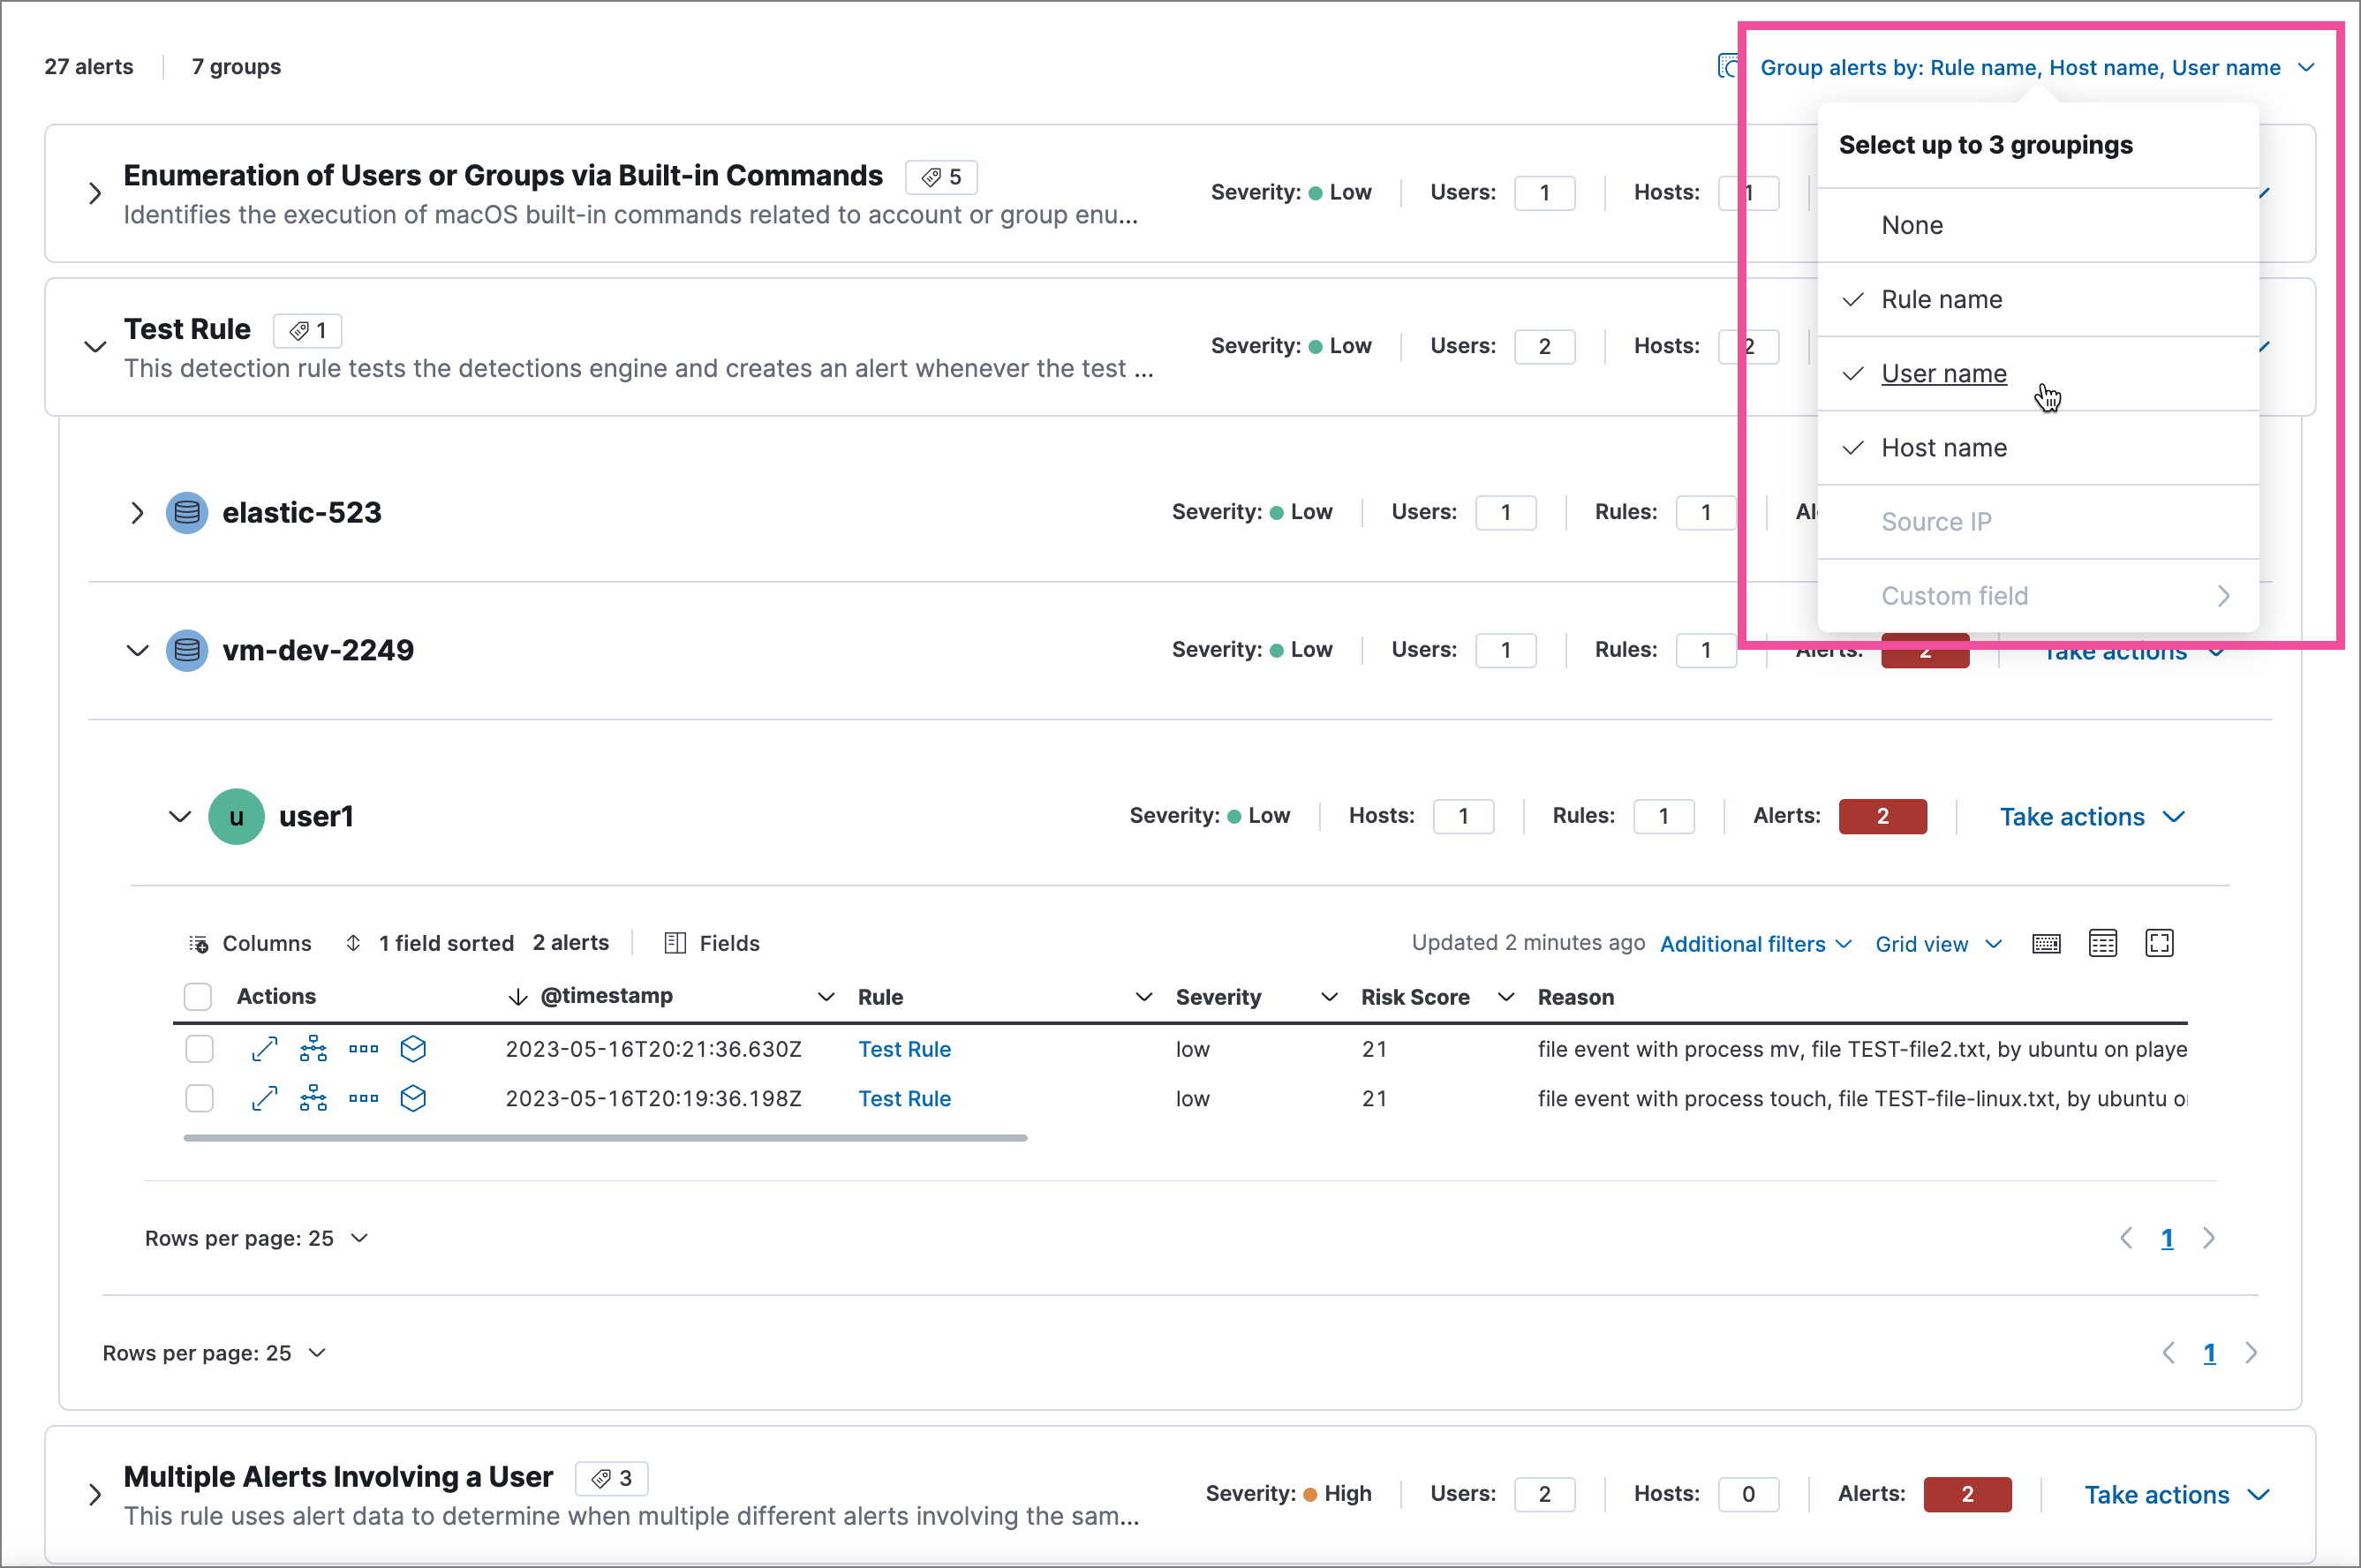
Group alerts by up to three fields, such as rule name, host, user, source IP, or custom fields. Groups nest in the order you select them.
| Action | How to do it |
|---|---|
| Group alerts | Click Group alerts by > select field(s) |
| Expand a group | Click the group name or expand icon |
| Bulk action on group | Click Take actions menu on the group row |
| Button | Function |
|---|---|
| Columns | Reorder columns |
| Sort fields | Sort by one or more columns |
| Fields | Add or remove fields (including runtime fields) |
| Full screen | Expand table to full screen |

| Mode | Description |
|---|---|
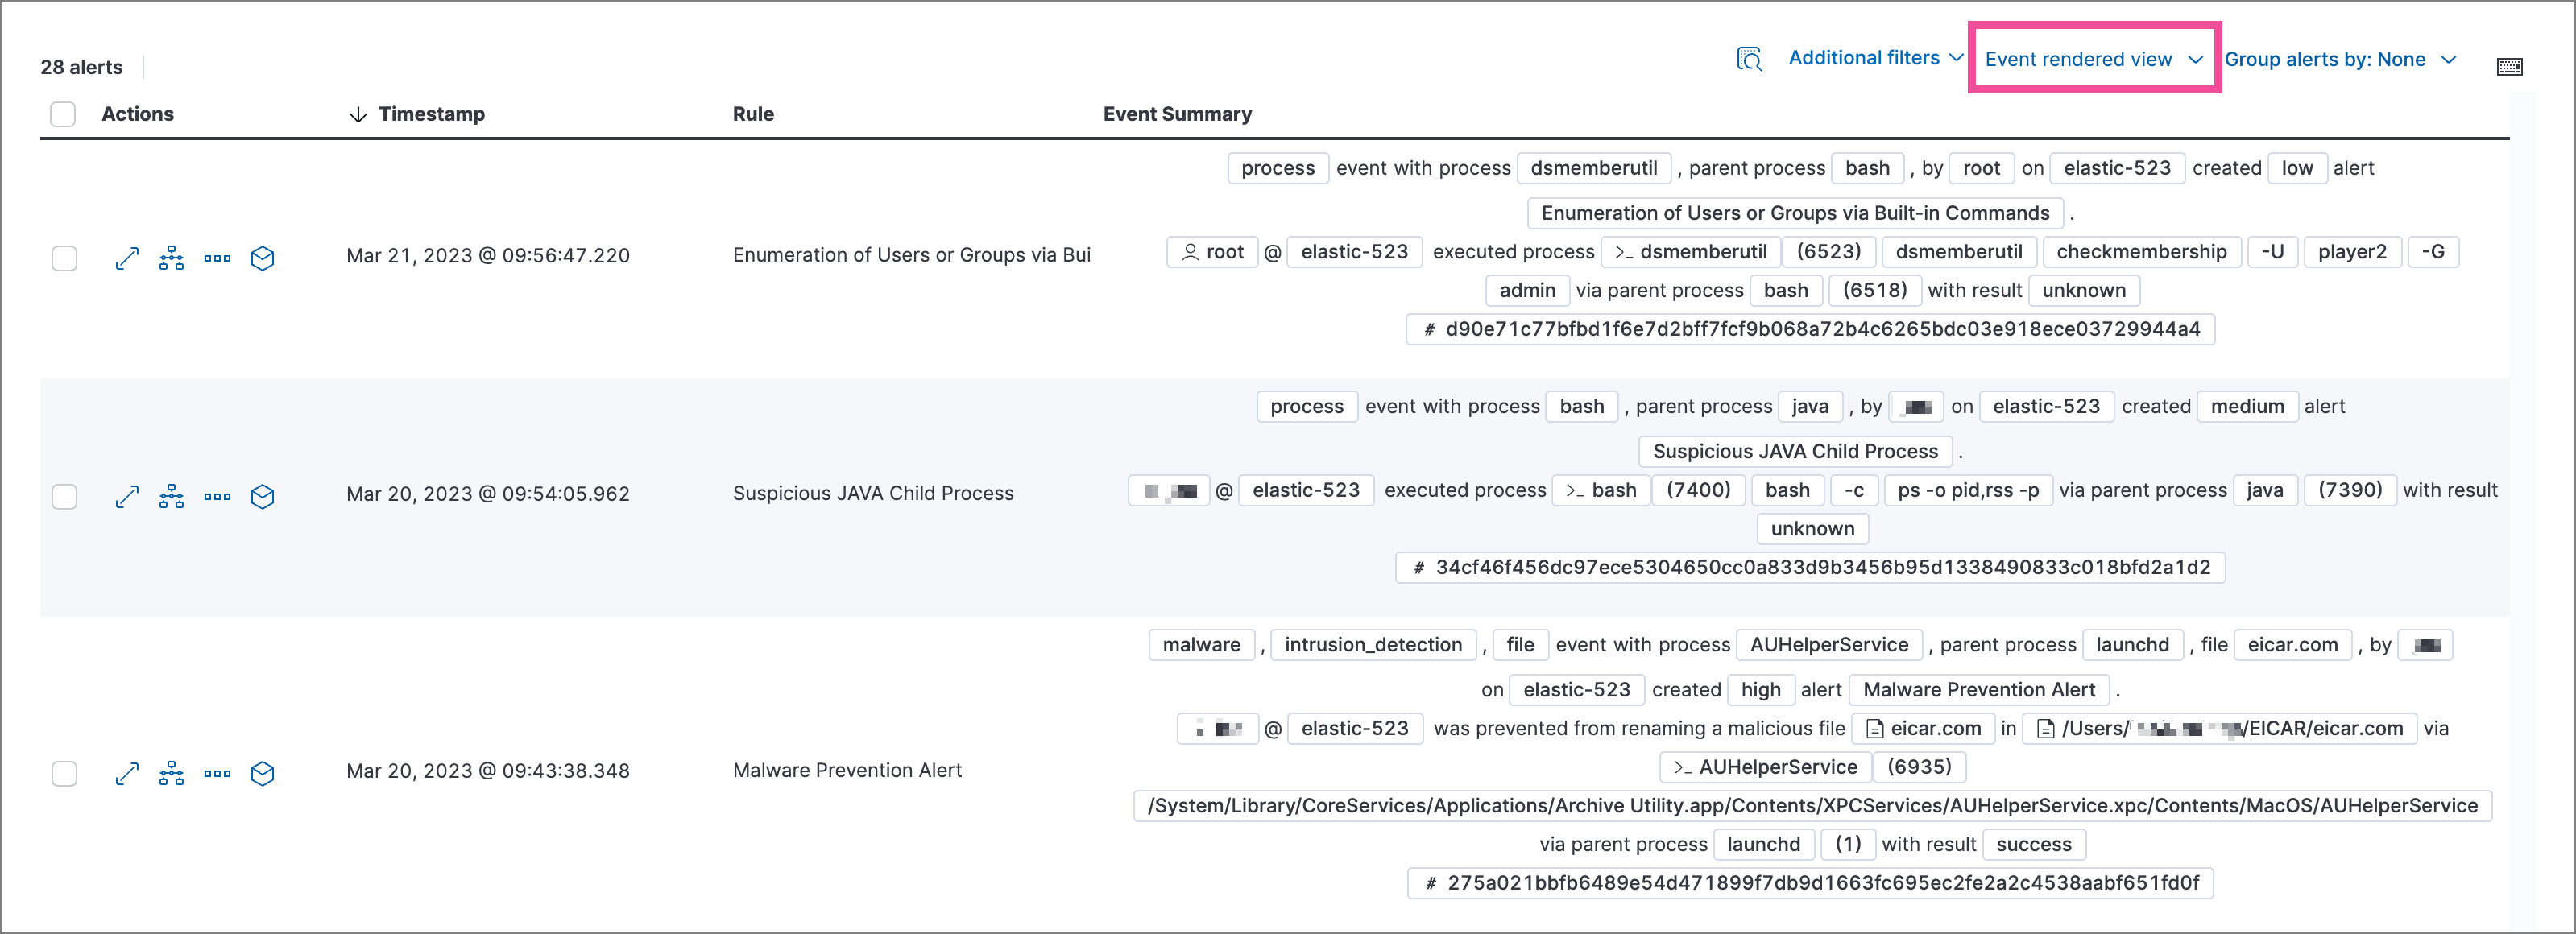
| Grid view | Traditional table with columns for each field. Click the expand icon in the Reason column to see rendered alert details. |
| Event rendered view | Descriptive event flow showing relevant context. |
Access actions from the More actions (…) menu in the Alerts table, or from Take action in the alert details flyout.
| Action | Description |
|---|---|
| Change status | Mark as open, acknowledged, or closed |
| Add to case | Attach alert to a new or existing case |
|
|
Run an Elastic workflow for on-demand response or investigation |
| Add rule exception | Prevent rule from generating similar alerts |
| Add Elastic Endpoint exception | Prevent Elastic Endpoint alerts for specific conditions |
| Apply alert tags | Categorize alerts for filtering |
| Assign users | Assign analysts to investigate |
| Investigate in Timeline | Open alert in Timeline for analysis |
| Analyze process tree | Visualize process relationships |
| Isolate host | Isolate the alert's host from the network |
| Run Osquery | Query the host for additional context |
| Response actions | Execute response actions on the host |
Alert statuses track investigation progress:
| Status | Meaning |
|---|---|
| Open | Needs investigation (default view) |
| Acknowledged | Under active investigation |
| Closed | Resolved |
To change status:
| Scope | How to do it |
|---|---|
| Single alert | More actions icon > select status |
| Multiple alerts | Select alerts > Selected x alerts > select status |
| Grouped alerts | Take actions menu on group row > select status |
| From flyout | Take action > select status |
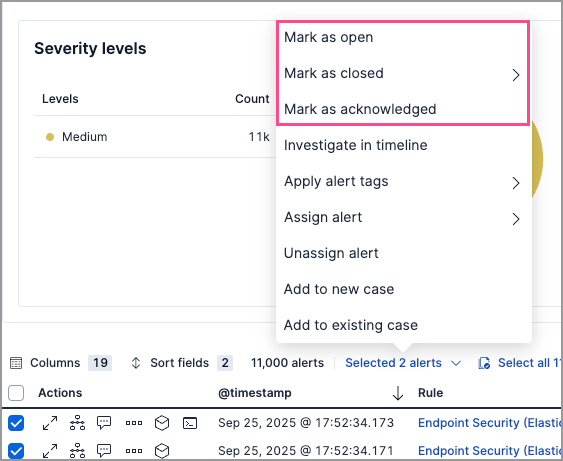
When closing alerts, you can specify a reason:
| Reason | Use when |
|---|---|
| Close without reason | No specific categorization needed |
| Duplicate | Alert duplicates another alert |
| False positive | Normal activity, not a security issue |
| True positive | Real incident that's been resolved |
| Benign positive | Real activity but acceptable/not actionable |
| Other | Other reasons |
You can add your own closing reason options by updating the securitySolution:alertCloseReasons advanced setting. Refer to Add custom alert closing reasons for more information.
The closing reason is stored in kibana.alert.workflow_reason and can be used for filtering. Reopening an alert removes this field.
You can run an Elastic workflow directly from an alert to trigger an on-demand response or investigation. To use this feature, make sure you meet the workflows prerequisites.
To run a workflow on an individual alert, do one of the following:
- In the Alerts table, click More actions ( ) in an alert's row, then click Run workflow. Use the search bar to select a workflow, then click Run workflow.
- In an alert's details flyout, click Take action → Run workflow. Use the search bar to select a workflow, then click Run workflow.
You can select only enabled workflows.
To run a workflow on multiple alerts, select the alerts, then click Selected x alerts at the upper-left above the table. Click Run workflow, select a workflow, then click Run workflow.
Tags help organize alerts into filterable categories.
| Task | How to do it |
|---|---|
| Tag single alert | More actions icon > Apply alert tags |
| Tag multiple alerts | Select alerts > Selected x alerts > Apply alert tags |
| Tag from flyout | Take action > Apply alert tags |
| Filter by tag | KQL: kibana.alert.workflow_tags: "False Positive" |
| Show tags column | Fields > add kibana.alert.workflow_tags |
| Manage tag options | Configure securitySolution:alertTags |
Assign analysts to alerts they should investigate.
Users are not notified when assigned or unassigned.
| Task | How to do it |
|---|---|
| Assign to single alert | More actions icon > Assign alert > select users |
| Assign to multiple alerts | Select alerts > Selected x alerts > Assign alert |
| Assign from flyout | Take action > Assign alert, or click the assign icon at top |
| Unassign all users | More actions icon > Unassign alert |
| Show assignees column | Fields > add kibana.alert.workflow_assignee_ids |
| Filter by assignee | Click Assignees filter above table |
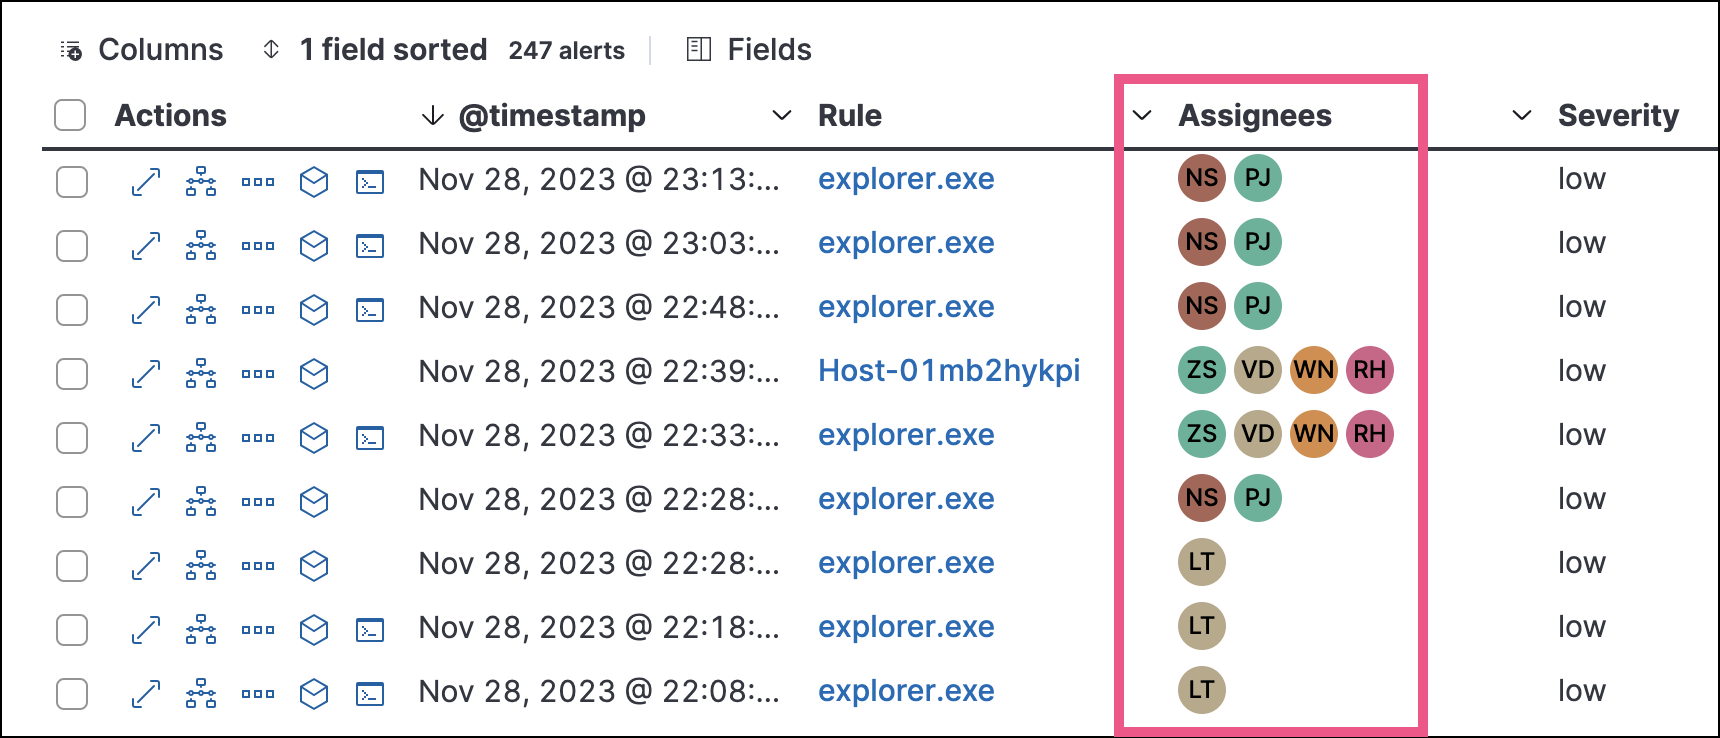
Create an exception to prevent a rule from generating similar alerts.
| Location | How to do it |
|---|---|
| Alerts table | More actions icon > Add exception |
| Alert details flyout | Take action > Add rule exception |
| Scope | How to do it |
|---|---|
| Single alert | Click Investigate in timeline button in table, or Take action > Investigate in timeline |
| Multiple alerts | Select alerts (up to 2,000) > Selected x alerts > Investigate in timeline |
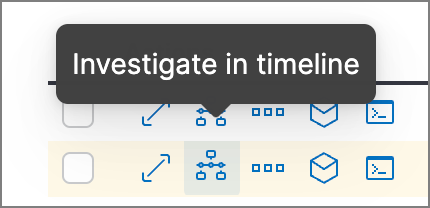
For threshold rule alerts, Timeline shows all matching events, not only those that crossed the threshold.
If the rule uses a Timeline template, dropzone query values are replaced with the alert's actual field values.
Manage the size of alert indices in your space by clearing out alerts that are older or infrequently accessed. You can do this by running an alert cleanup task, which deletes alerts according to the criteria that you define.