Elastic Stack features
From enterprise-grade security and developer-friendly APIs to machine learning and graph analytics, the Elastic Stack ships with features (some formerly packaged as X-Pack) to help you ingest, store, analyze, search and visualize all types of data at scale.
Management and operations
Scalability and resiliency
Monitoring
Management
Alerting
Stack Security
Deployment
Ingest and enrich
Data sources
Data enrichment
Modules and integrations
Data storage
Flexibility
Search and analyze
Full-text search
Machine learning
Explore and visualize
Visualizations
Share and collaborate
Elastic Maps
Elastic Metrics
Elastic Uptime
Elastic Security
Management and operations
Management and operations
Scalability and resiliency
Elasticsearch operates in a distributed environment designed from the ground up for perpetual peace of mind. Our clusters grow with your needs — just add another node.
Clustering and high availability
A cluster is a collection of one or more nodes (servers) that together holds all of your data and provides federated indexing and search capabilities across all nodes. Elasticsearch clusters feature primary and replica shards to provide failover in the case of a node going down. When a primary shard goes down, the replica takes its place.
Learn about clustering and HAAutomatic node recovery
When a node leaves the cluster for whatever reason, intentional or otherwise, the master node reacts by replacing the node with a replica and rebalancing the shards. These actions are intended to protect the cluster against data loss by ensuring that every shard is fully replicated as soon as possible.
Learn about node allocationAutomatic data rebalancing
The master node within your Elasticsearch cluster will automatically decide which shards to allocate to which nodes, and when to move shards between nodes in order to rebalance the cluster.
Learn about automatic data rebalancingHorizontal scalability
As your usage grows, Elasticsearch scales with you. Add more data, add more use cases, and when you start to run out of resources, just add another node to your cluster to increase its capacity and reliability. And when you add more nodes to a cluster, it automatically allocates replica shards so you're prepared for the future.
Learn about scaling horizontallyRack awareness
You can use custom node attributes as awareness attributes to enable Elasticsearch to take your physical hardware configuration into account when allocating shards. If Elasticsearch knows which nodes are on the same physical server, in the same rack, or in the same zone, it can distribute the primary shard and its replica shards to minimize the risk of losing all shard copies in the event of a failure.
Learn about allocation awarenessCross-cluster replication
The cross-cluster replication (CCR) feature enables replication of indices in remote clusters to a local cluster. This functionality can be used in common production use cases.
Learn about CCRDisaster recovery: If a primary cluster fails, a secondary cluster can serve as a hot backup.
Geo-proximity: Reads can be served locally, decreasing network latency.
Cross-datacenter replication
Cross-datacenter replication has been a requirement for mission-critical applications on Elasticsearch for some time, and was previously solved partially with additional technologies. With cross-cluster replication in Elasticsearch, no additional technologies are needed to replicate data across datacenters, geographies, or Elasticsearch clusters.
Read about cross-datacenter replicationManagement and operations
Monitoring
The monitoring features of the Elastic Stack give you visibility into how your Elastic Stack is running. Keep a pulse on how it's performing to make sure you're getting the most out of it.
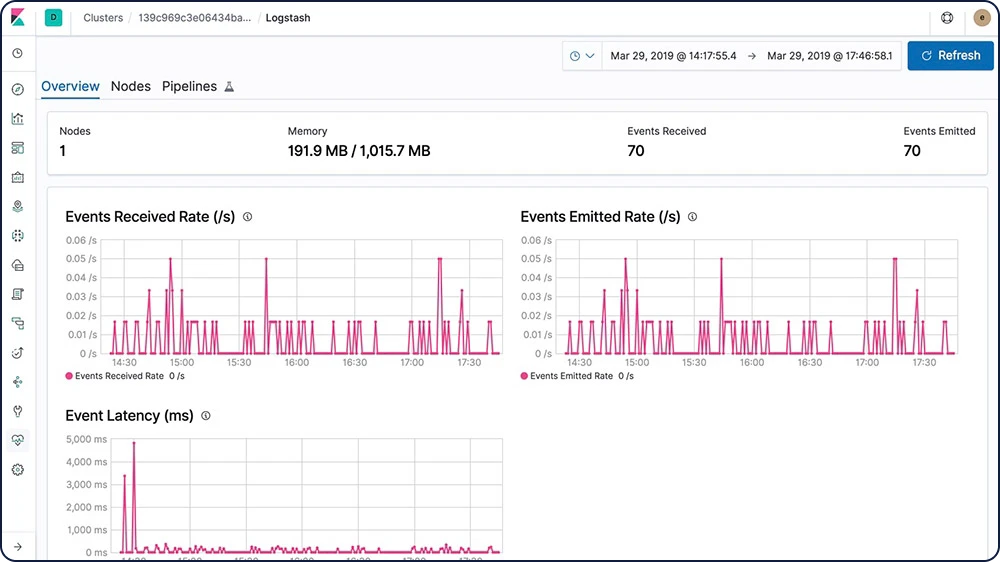
Full stack monitoring
The monitoring features of the Elastic Stack give you insight into the operation of Elasticsearch, Logstash, and Kibana. All of the monitoring metrics are stored in Elasticsearch, which enables you to easily visualize the data from Kibana.
Learn about monitoring the Elastic Stack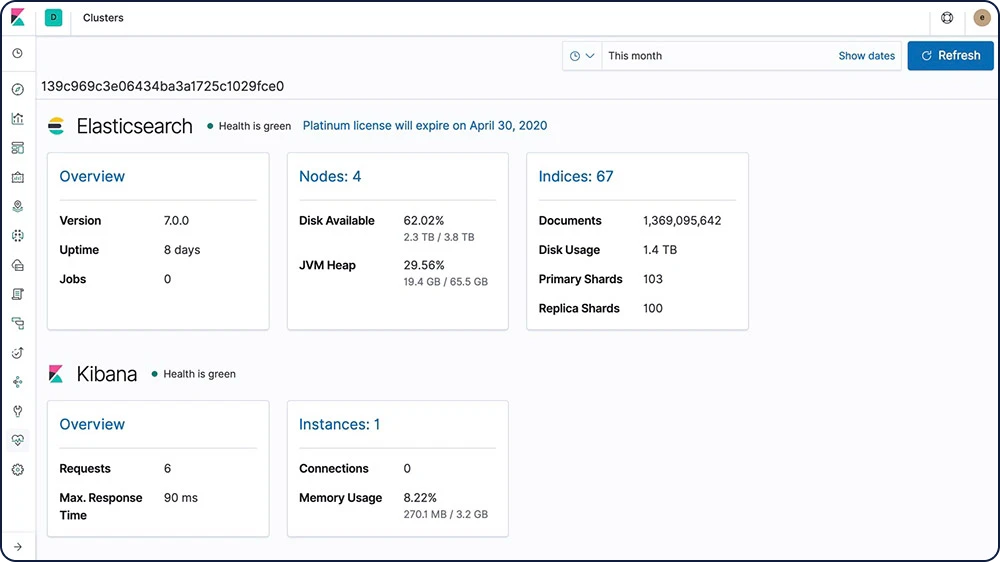
Multi-stack monitoring
Simplify your workflow with a centralized monitoring cluster to record, track, and compare the health and performance of multiple Elastic Stack deployments from a single place.
Learn about multi-stack monitoringConfigurable retention policy
With the Elastic Stack, you can control how long you hold onto monitoring data. The default is 7 days, but you can change that to anything you want.
Learn about retention policiesAutomatic alerts on stack issues
With Elastic Stack alerting features, you can get notified automatically to changes in your cluster — cluster state, license expiration, and other metrics across Elasticsearch, Kibana, and Logstash — using the power of alerting.
Learn about automatic stack alerting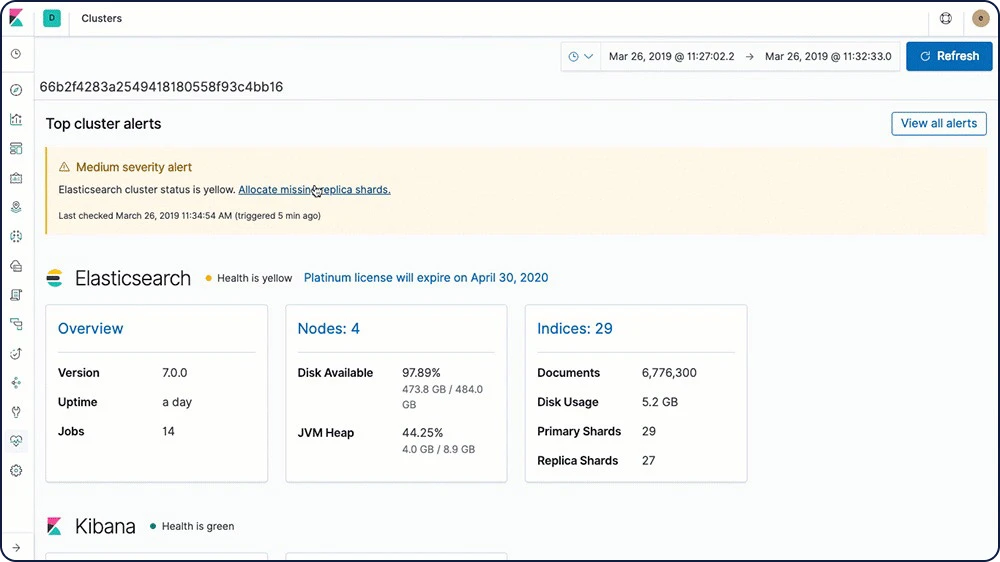
Management and operations
Management
The Elastic Stack comes with a variety of management tools, UIs, and APIs to allow full control over data, users, cluster operations, and more.
Index lifecycle management
Index lifecycle management (ILM) lets the user define and automate policies to control how long an index should live in each of four phases, as well as the set of actions to be taken on the index during each phase. This allows for better control of cost of operation, as data can be put in different resource tiers.
Learn about ILMHot: actively updated and queried
Warm: no longer updated, but still queried
Cold/Frozen: no longer updated and seldom queried (search is possible, but slower)
Delete: no longer needed
Data tiers
Data Tiers are the formalized way to partition data into Hot, Warm and Cold nodes through a node role attribute that automatically defines the Index Lifecycle Management policy for your nodes. By assigning Hot, Warm, and Cold node roles, you can greatly simplify and automate the process of moving data from higher cost, higher performant storage to lower cost, lower performance storage, all without compromising insight.
Learn about Data tiers- Hot: actively updated and queried on most performant instance
Warm: data queried less frequently on lower performant instances
Cold: read only, seldom queried, significant storage reduction without performance degradation, powered by Searchable Snapshots
Snapshot and restore
A snapshot is a backup taken from a running Elasticsearch cluster. You can take a snapshot of either individual indices or the entire cluster and store the snapshot in a repository on a shared file system. There are plugins available that also support remote repositories.
Learn about snapshot and restoreSearchable snapshots
Searchable snapshots give you the ability to directly query your snapshots at a fraction of the time it would take to complete a typical restore-from-snapshot. This is achieved by reading only the necessary pieces of each snapshot index to complete the request. Together with the Cold Tier, Searchable snapshots can significantly reduce your data storage costs by backing up your replica shards in object based storage systems such as Amazon S3, Azure Storage or Google Cloud Storage while still providing full search access to them.
Learn about searchable snapshotsSnapshot lifecycle management
As a background snapshot manager, snapshot lifecycle management (SLM) APIs allow administrators to define the cadence with which to take snapshots of an Elasticsearch cluster. With a dedicated UI, SLM empowers users to configure retention for SLM policies and create, schedule, and delete snapshots automatically — ensuring that appropriate backups of a given cluster are taken on a frequent enough basis to be able to restore in compliance with customer SLAs.
Learn about SLMSnapshot-based peer recoveries
This feature allows Elasticsearch to recover replicas and relocates primary shards from a recent snapshot when data is available, thus reducing operating costs for clusters running in an environment where the node-to-node data transfer costs are higher than the costs of recovering data from a snapshot.
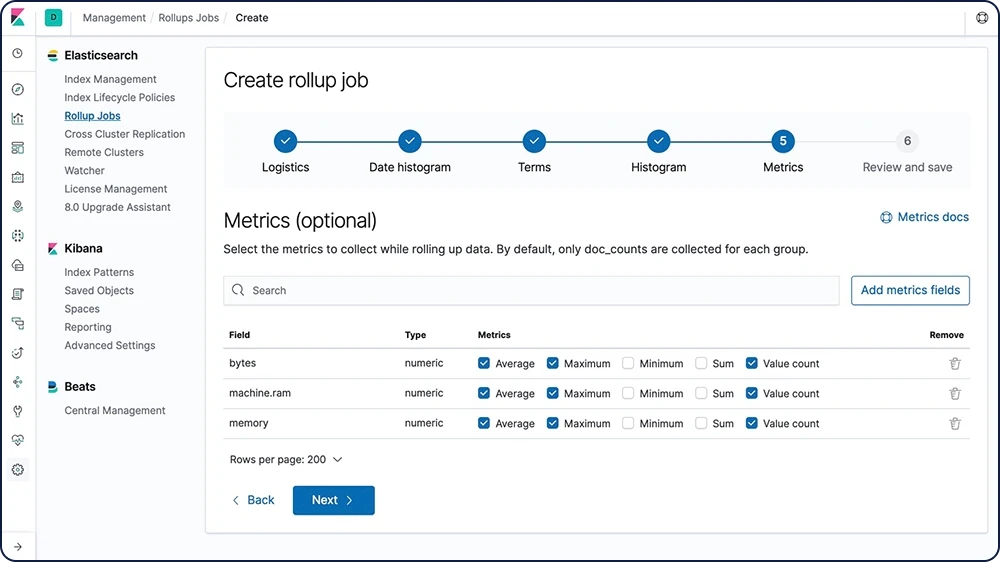
Learn about snapshot-based peer recoveriesData rollups
Keeping historical data around for analysis is extremely useful but often avoided due to the financial cost of archiving massive amounts of data. Retention periods are thus driven by financial realities rather than by the usefulness of extensive historical data. The rollup feature provides a means to summarize and store historical data so that it can still be used for analysis, but at a fraction of the storage cost of raw data.
Learn about rollups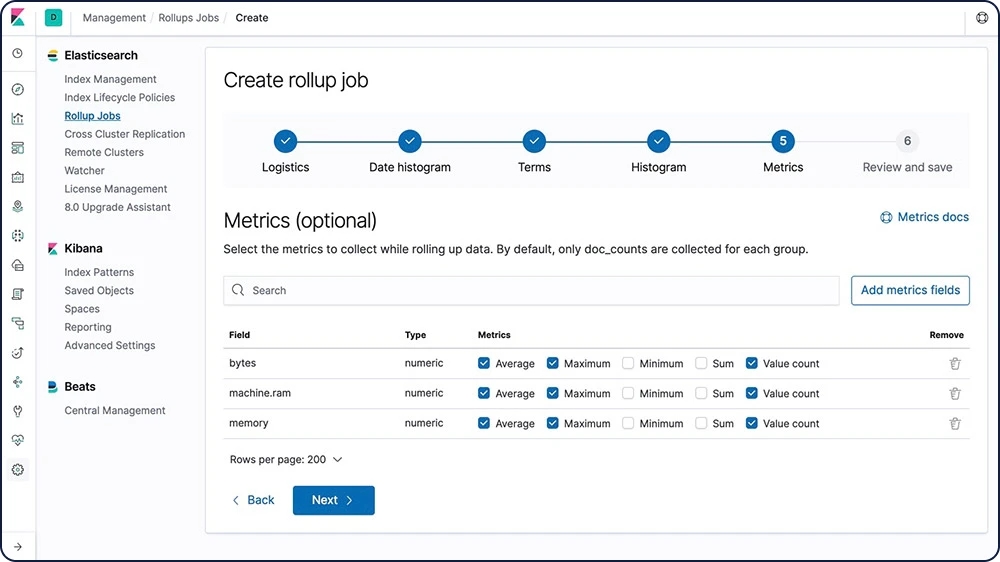
Data streams
Data streams are a convenient and scalable way to ingest, search, and manage continuously generated time-series data.
Learn more about data streamsCLI tools
Elasticsearch provides a number of tools for configuring security and performing other tasks from the command line.
Explore the different CLI toolsUpgrade Assistant UI
The Upgrade Assistant UI helps you prepare your upgrade to the most recent version of the Elastic Stack. Within the UI, the assistant identifies the deprecated settings in your cluster and indices, guiding you through the process of resolving issues — including reindexing.
Learn about the Upgrade Assistant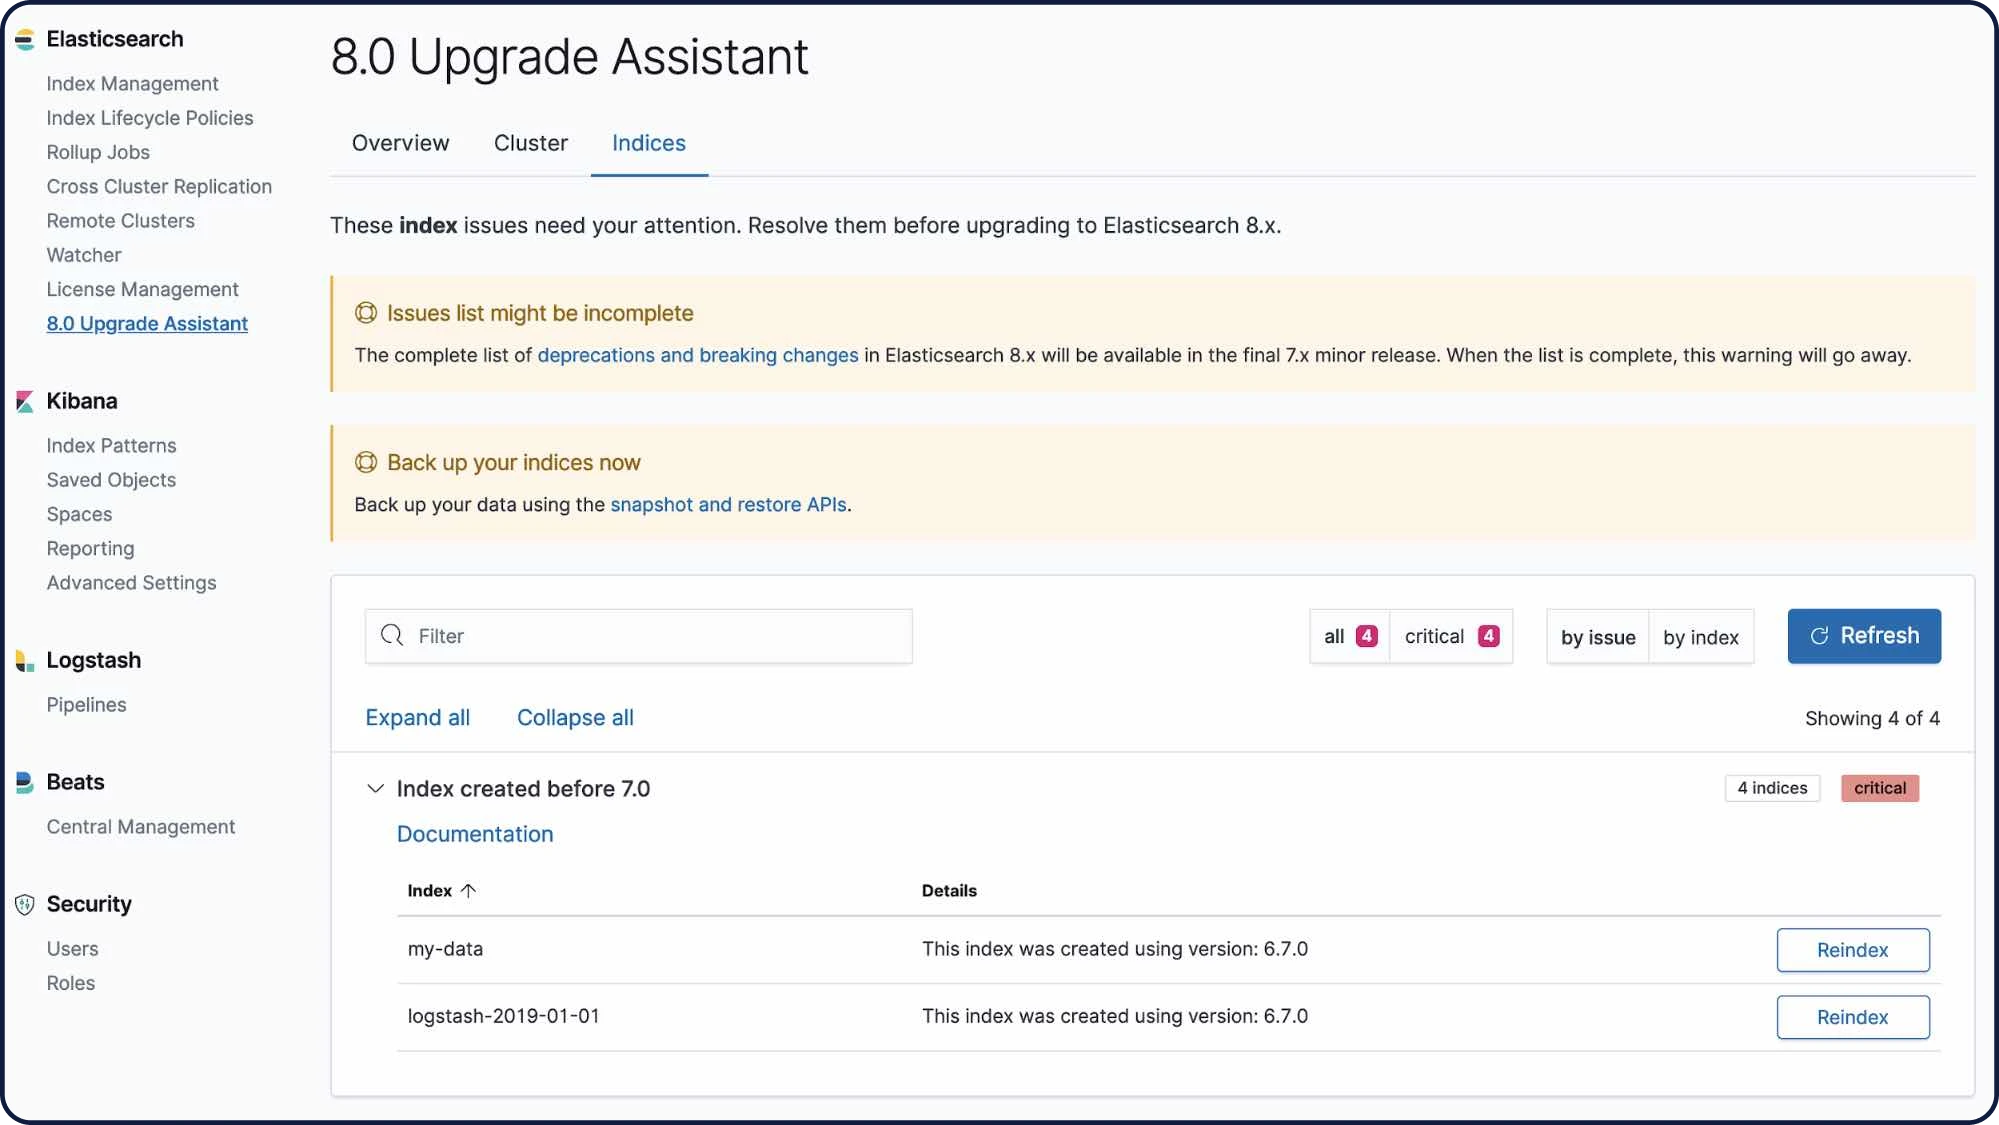
Upgrade Assistant API
The Upgrade Assistant API allows you to check the upgrade status of your Elasticsearch cluster and reindex indices that were created in the previous major version. The assistant helps you prepare for the next major version of Elasticsearch.
Learn about the Upgrade Assistant APIUser and role management
Create and manage users and roles via API or from Management within Kibana.
Learn about user/role management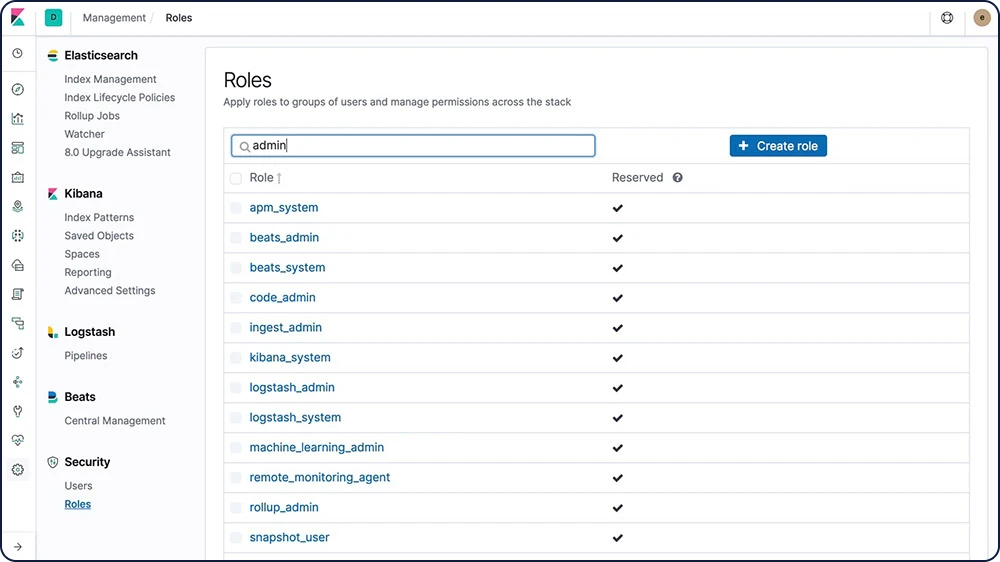
Transforms
Transforms are two-dimensional, tabular data structures that make indexed data more digestible. Transforms perform aggregations that pivot your data into a new entity-centric index. By transforming and summarizing your data, it becomes possible to visualize and analyze it in alternative ways, including as a source for other machine learning analytics.
Learn about transformsManagement and operations
Alerting
The alerting features of the Elastic Stack give you the full power of the Elasticsearch query language to identify changes in your data that are interesting to you. In other words, if you can query something in Elasticsearch, you can alert on it.
Highly available, scalable alerting
There's a reason organizations large and small trust the Elastic Stack to handle their alerting needs. By reliably and securely ingesting data from any source, in any format, analysts can search, analyze, and visualize key data in real time — all with customized, reliable alerting.
Learn about alertingNotifications via email, webhooks, IBM Resilient, Jira, Microsoft Teams, PagerDuty, ServiceNow, Slack, xMatters
Link alerts with built-in integrations for email, IBM Resilient, Jira, Microsoft Teams, PagerDuty, ServiceNow, xMatters, and Slack. Integrate with any other third-party system via a webhook output.
Learn about alert notification options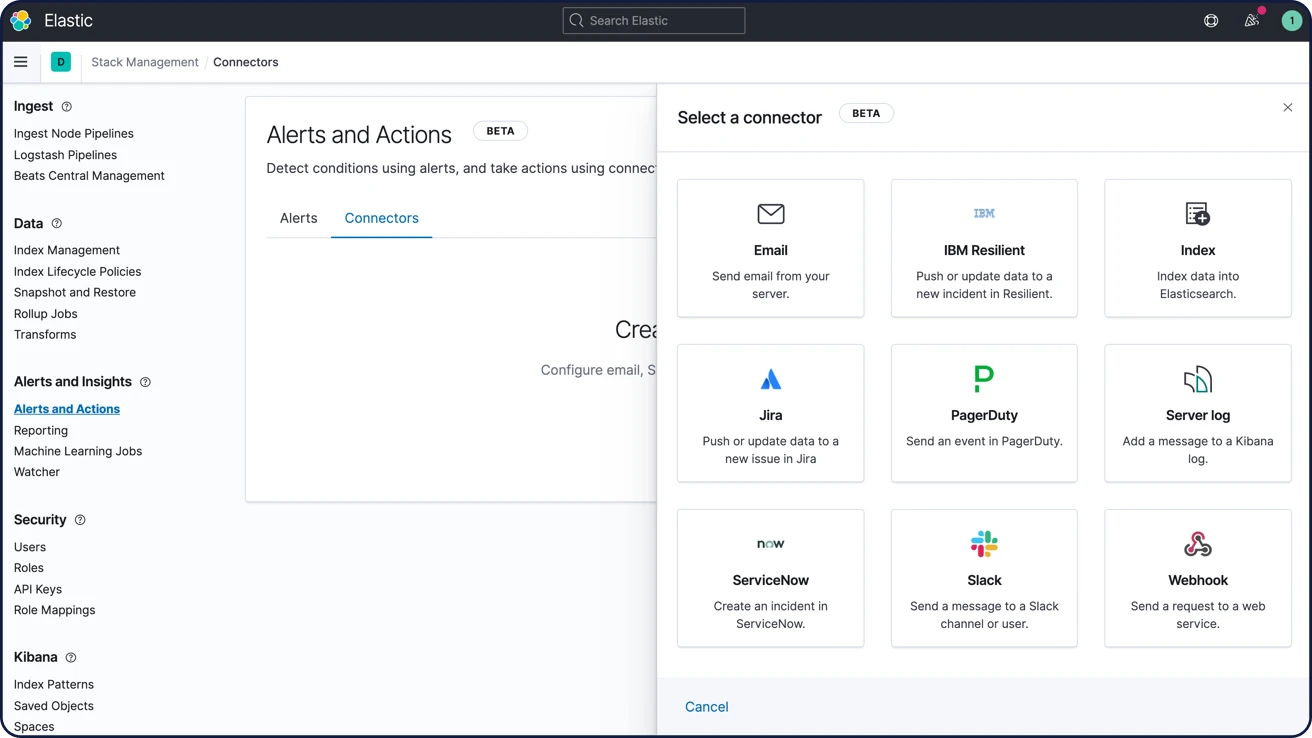
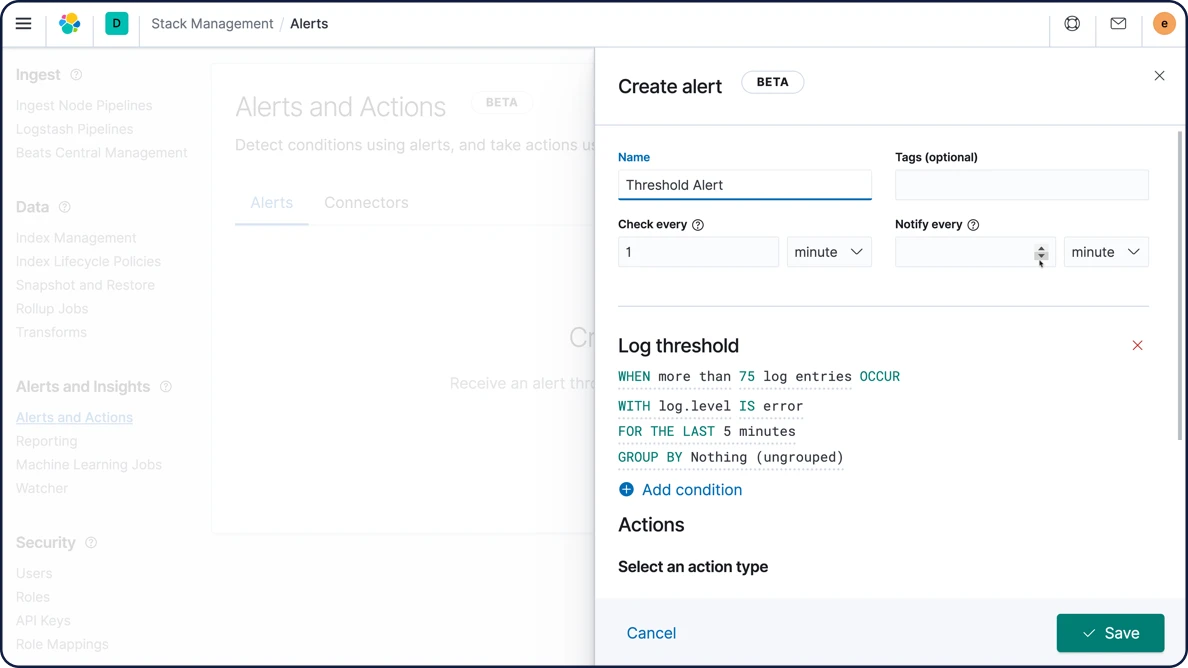
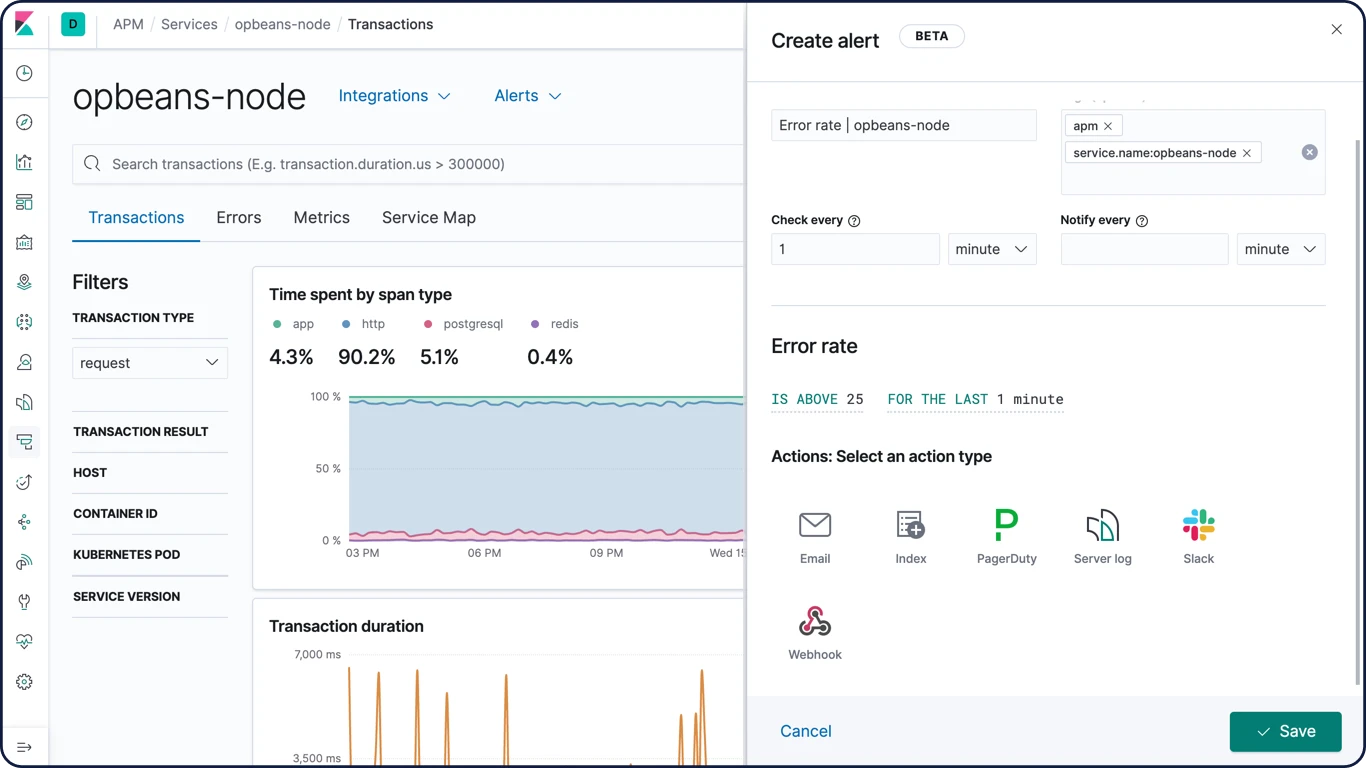
Alerting UI
Take control of your alerts by viewing, creating, and managing all of them from a single UI. Stay in the know with real-time updates on which alerts are running and what actions were taken.
Learn about configuring alerts in Kibana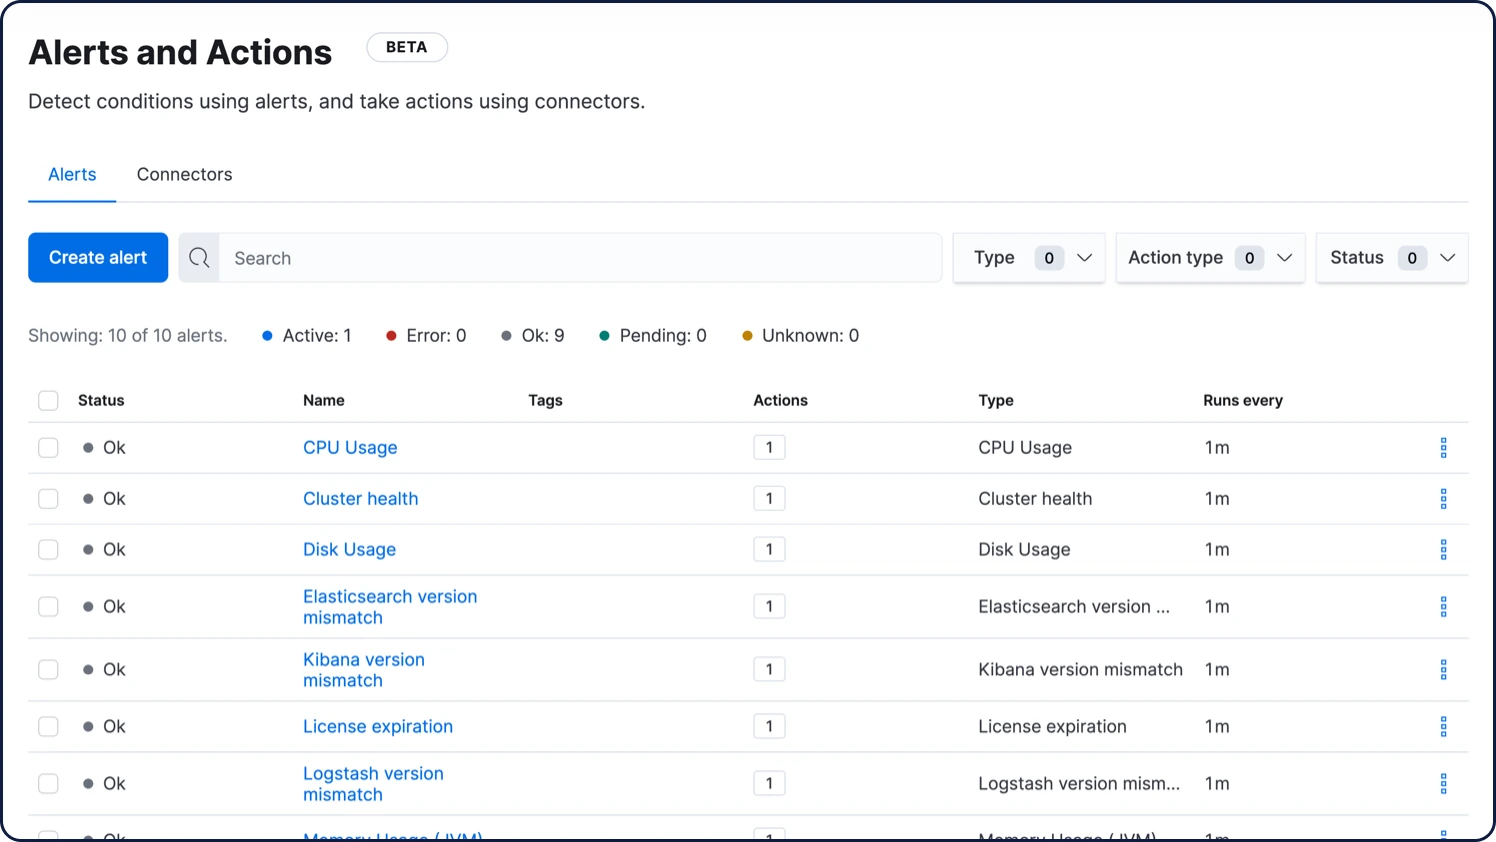
Alerting suppression and noise reduction
Snooze alerting rules to suppress notifications and actions for a user-defined duration. You’ll never miss an action because you forgot to unmute a rule while handling problems that arose unexpectedly or during known downtimes.
Learn about alerting suppression and noise reductionSearch threshold alerts for Discover
A search threshold rule in Discover is based on an Elasticsearch query - it analyzes documents at a given time interval to check if a threshold is reached for documents with the designated criteria, then triggers an alert. Users can create and assign an action if they wish to be trigger a notification or automatically create an incident.
Learn about search threshold alerts for DiscoverManagement and operations
Stack Security
The security features of the Elastic Stack give the right access to the right people. IT, operations, and application teams rely on these features to manage well-intentioned users and keep malicious actors at bay, while executives and customers can rest easy knowing data stored in the Elastic Stack is safe and secure.
Secure settings
Some settings are sensitive, and relying on filesystem permissions to protect their values is not sufficient. For this use case, Elastic Stack components provide keystores to prevent unwanted access to sensitive cluster settings. The Elasticsearch and Logstash keystores can optionally be password protected for additional security.
Learn more about secure settingsEncrypted communications
Network-based attacks on Elasticsearch node data can be thwarted through traffic encryption using SSL/TLS, node authentication certificates, and more.
Learn about encrypting communicationsEncryption at rest support
While the Elastic Stack does not implement encryption at rest out of the box, it is recommended that disk-level encryption be configured on all host machines. In addition, snapshot targets must also ensure that data is encrypted at rest.
Role-based access control (RBAC)
Role-based access control (RBAC) enables you to authorize users by assigning privileges to roles and assigning roles to users or groups.
Learn about RBAC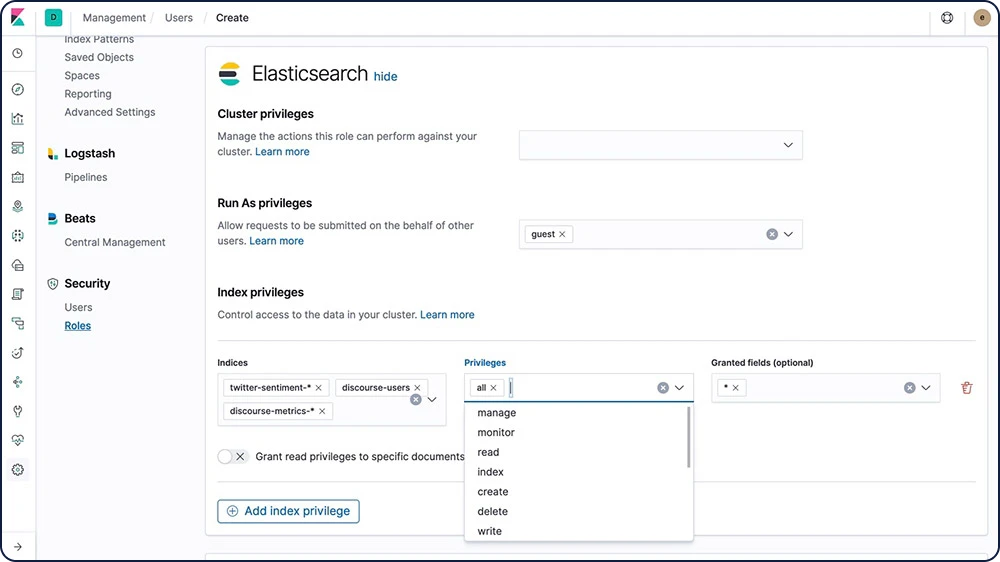
Attribute-based access control (ABAC)
The security features of the Elastic Stack also provide an attribute-based access control (ABAC) mechanism, which enables you to use attributes to restrict access to documents in search queries and aggregations. This allows you to implement an access policy in a role definition so users can read a specific document only if they have all the required attributes.
Learn about ABACAnonymous access control (for public sharing)
From maps to dashboards to literally any Kibana saved object, you can now create specialized links that let anyone access an asset without being prompted for credentials.
Learn about anonymous accessField- and document-level security
Field-level security restricts the fields that users have read access to. In particular, it restricts which fields can be accessed from document-based read APIs.
Learn about field-level securityDocument-level security restricts the documents that users have read access to. In particular, it restricts which documents can be accessed from document-based read APIs.
Learn about document-level securityAudit logging
You can enable auditing to keep track of security-related events such as authentication failures and refused connections. Logging these events enables you to monitor your cluster for suspicious activity and provides evidence in the event of an attack.
Learn about audit loggingIP filtering
You can apply IP filtering to application clients, node clients, or transport clients, in addition to other nodes that are attempting to join the cluster. If a node's IP address is on the blacklist, the Elasticsearch security features allow the connection to Elasticsearch but it is dropped immediately and no requests are processed.
IP address or range
xpack.security.transport.filter.allow: "192.168.0.1"
xpack.security.transport.filter.deny: "192.168.0.0/24"
Whitelist
xpack.security.transport.filter.allow: [ "192.168.0.1", "192.168.0.2", "192.168.0.3", "192.168.0.4" ]
xpack.security.transport.filter.deny: _all
IPv6
xpack.security.transport.filter.allow: "2001:0db8:1234::/48"
xpack.security.transport.filter.deny: "1234:0db8:85a3:0000:0000:8a2e:0370:7334"
Hostname
xpack.security.transport.filter.allow: localhost
xpack.security.transport.filter.deny: '*.google.com'
Learn about IP filtering
Security realms
The security features of the Elastic Stack authenticate users by using realms and one or more token-based authentication services. A realm is used to resolve and authenticate users based on authentication tokens. The security features provide a number of built-in realms.
Learn about security realmsSingle sign-on (SSO)
The Elastic Stack supports SAML single sign-on (SSO) into Kibana, using Elasticsearch as a backend service. SAML authentication allows users to log in to Kibana with an external identity provider, such as Okta or Auth0.
Learn about SSOThird-party security integration
If you are using an authentication system that is not supported out of the box with the security features of the Elastic Stack, you can create a custom realm to authenticate users.
Learn about third party securityFIPS 140-2 mode
Elasticsearch offers a FIPS 140-2-compliant mode that can run in an enabled JVM. Adherence to the processing standard is ensured by FIPs-approved/NIST-recommended cryptographic algorithms.
Learn about FIPS 140-2 complianceSection 508
If you need your Elastic Stack deployment to meet Section 508 compliance standards, our security features have you covered.
Read about the different compliancesStandards (GDPR)
Chances are good that your data is classified as personal data by GDPR guidelines. Learn how you can use the features of the Elastic Stack — from role-based access control to data encryption — to equip your Elasticsearch data for GDPR securing and processing requirements.
Management and operations
Deployment
Public cloud, private cloud, or somewhere in between — we make it easy for you to run and manage the Elastic Stack.
Download and install
It's as easy as ever to get started. Just download and install Elasticsearch and Kibana as an archive or with a package manager. You'll be indexing, analyzing, and visualizing data in no time. And with the default distribution, you can also test out Platinum features such as machine learning, security, graph analytics, and more with a free 30-day trial.
Download the Elastic StackElastic Cloud
Elastic Cloud is our growing family of SaaS offerings that make it easy to deploy, operate, and scale Elastic products and solutions in the cloud. From an easy-to-use hosted and managed Elasticsearch experience to powerful, out-of-the-box search solutions, Elastic Cloud is your springboard for seamlessly putting Elastic to work for you. Try any of our Elastic Cloud products for free for 14 days — no credit card required.
Get started in Elastic CloudStart a free trial of Elasticsearch Service
Elastic Cloud Enterprise
With Elastic Cloud Enterprise (ECE), you can provision, manage, and monitor Elasticsearch and Kibana at any scale, on any infrastructure, while managing everything from a single console. Choose where you run Elasticsearch and Kibana: physical hardware, virtual environment, private cloud, private zone in a public cloud, or just plain public cloud (e.g., Google, Azure, AWS). We've covered them all.
Try ECE free for 30 daysElastic Cloud on Kubernetes
Built on the Kubernetes Operator pattern, Elastic Cloud on Kubernetes (ECK) extends the basic Kubernetes orchestration capabilities to support the setup and management of Elasticsearch and Kibana on Kubernetes. With Elastic Cloud on Kubernetes, simplify the processes around deployment, upgrades, snapshots, scaling, high availability, security, and more for running Elasticsearch in Kubernetes.
Deploy with Elastic Cloud on KubernetesHelm Charts
Deploy in minutes with the official Elasticsearch and Kibana Helm Charts.
Read about the official Elastic Helm ChartsDocker containerization
Run Elasticsearch and Kibana on Docker with the official containers from Docker Hub.
Run the Elastic Stack on DockerManagement and operations
Clients
The Elastic Stack allows you to work with data in whatever way you're most comfortable. With its RESTful APIs, language clients, robust DSL, and more (even SQL), we're flexible so you don't get stuck.
REST API
Elasticsearch provides a comprehensive and powerful JSON-based REST API that you can use to interact with your cluster.
Learn about the REST APICheck your cluster, node, and index health, status, and statistics.
Administer your cluster, node, and index data and metadata.
Perform CRUD (create, read, update, and delete) and search operations against your indices.
Execute advanced search operations such as paging, sorting, filtering, scripting, aggregations, and many others.
Language clients
Elasticsearch uses standard RESTful APIs and JSON. We also build and maintain clients in many languages such as Java, Python, .NET, SQL, and PHP. Plus, our community has contributed many more. They're easy to work with, feel natural to use, and, just like Elasticsearch, don't limit what you might want to do with them.
Explore the available language clientsConsole
In Console, one of the Dev Tools in Kibana, you can compose requests to send to Elasticsearch in a cURL-like syntax and view responses to your requests.
Learn about Console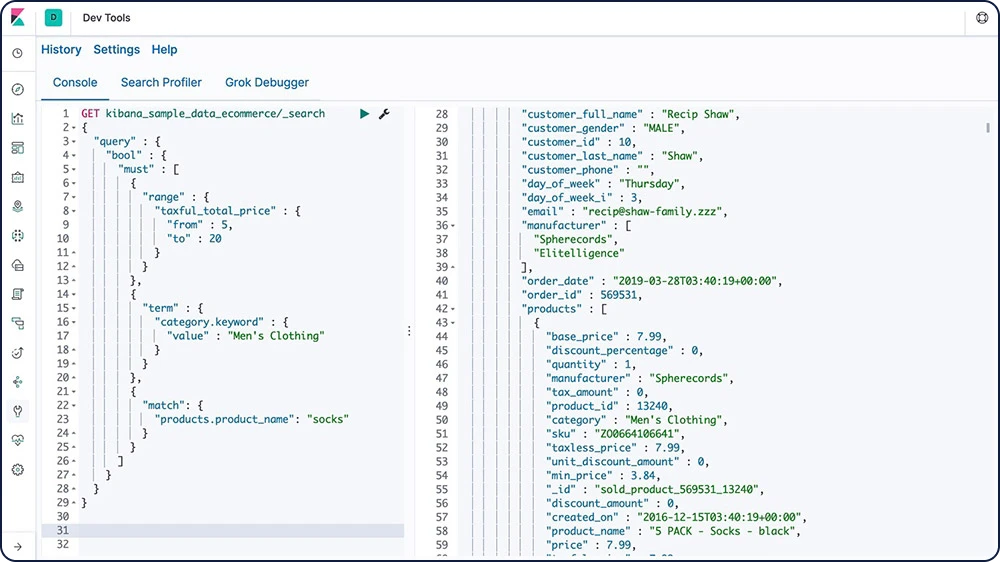
Elasticsearch DSL
Elasticsearch provides a full Query DSL (domain-specific language) based on JSON to define queries. Query DSL provides powerful search options for full-text search, including term and phrase matching, fuzziness, wildcards, regex, nest queries, geo queries, and more.
Learn about Elasticsearch DSLGET /_search
{
"query": {
"match" : {
"message" : {
"query" : "this is a test",
"operator" : "and"
}
}
}
}
Elasticsearch SQL
Elasticsearch SQL is a feature that allows SQL-like queries to be executed in real time against Elasticsearch. Whether using the REST interface, command line, or JDBC, any client can use SQL to search and aggregate data natively inside Elasticsearch.
Learn about Elasticsearch SQL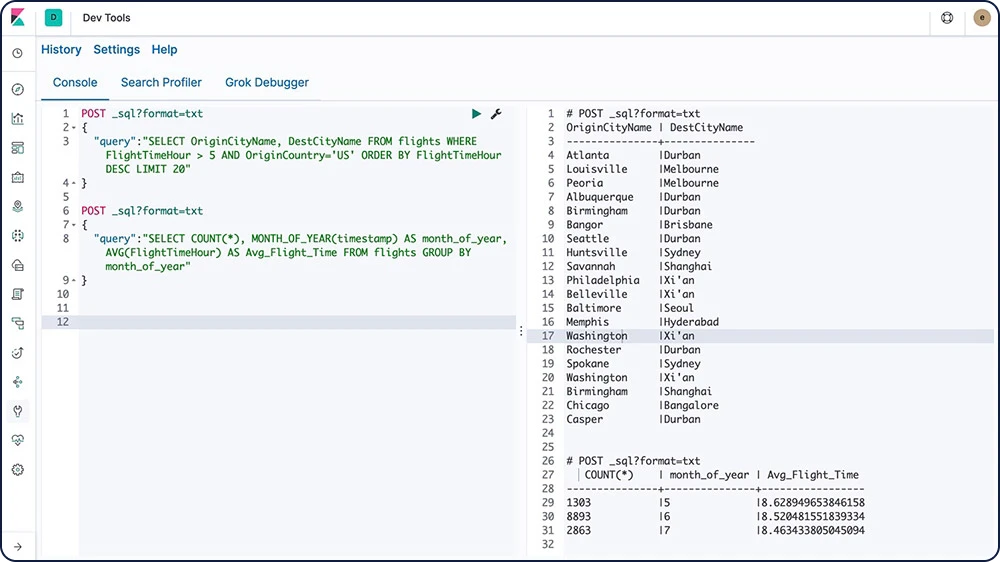
Event Query Language (EQL)
With the capability to query sequences of events matching specific conditions, Event Query Language (EQL) is purpose built for use cases like security analytics.
Learn about EQLJDBC client
The Elasticsearch SQL JDBC driver is a rich, fully featured JDBC driver for Elasticsearch. It is Type 4 driver, meaning it is a platform-independent, standalone, direct-to-database, pure Java driver that converts JDBC calls to Elasticsearch SQL.
Learn about the JDBC clientODBC client
The Elasticsearch SQL ODBC driver is a feature-rich 3.80 ODBC driver for Elasticsearch. It is a core-level driver, exposing all of the functionality accessible through the Elasticsearch SQL ODBC API, converting ODBC calls into Elasticsearch SQL.
Learn about the ODBC clientTableau Connector for Elasticsearch
The Tableau Connector for Elasticsearch makes it easy for Tableau Desktop and Tableau Server users to access data in Elasticsearch.
Download the Tableau ConnectorIngest and enrich
Ingest and enrich
Data sources
No matter what kind of data you have, Beats are great for gathering data. They sit on your servers, with your containers, or deploy as functions — and then centralize data in Elasticsearch. And if you want more processing muscle, Beats can also ship to Logstash for transformation and parsing.
Operating systems
Collect your Linux audit framework data and monitor the integrity of your files. Auditbeat ships these events in real time to the rest of the Elastic Stack for further analysis.
Keep a pulse on what's happening across your Windows-based infrastructure. Winlogbeat live streams Windows event logs to Elasticsearch and Logstash in a lightweight way.
Read about WinlogbeatWeb servers and proxies
Filebeat and Metricbeat offer a variety of ways to monitor your web servers and proxy servers, including modules and preconfigured dashboards for NGINX, Apache, HAProxy, IIS, and more.
Datastores and queues
Filebeat and Metricbeat include internal modules that simplify collecting, parsing, and visualizing common log formats and system metrics from data stores, databases, and queuing systems like MySQL, MongoDB, PostgreSQL, Microsoft SQL, and more.
Cloud services
Track performance and availability across a broad range of cloud services from Amazon Web Services, Google Cloud, and Microsoft Azure from a single pane of glass to drive efficient analysis at scale. In addition, Functionbeat delivers simplicity when observing your serverless cloud architecture, including Kinesis, SQS, and CloudWatch logs.

Containers and orchestration
Monitor your application logs, keep an eye on Kubernetes metrics and events, and analyze the performance of Docker containers. Visualize and search through them all in an app built for infrastructure operations.
The autodiscover feature in Metricbeat and Filebeat keeps you up to date with changes in your environment.
Automate the addition of modules and log paths and dynamically adapt your monitoring settings using Docker and Kubernetes API hooks.
Network data
Network information like HTTP, DNS, and SIP let you keep a pulse on application latency and errors, response times, SLA performance, user access patterns and trends, and more. Tap into this data to understand how traffic is flowing through your network.
Security data
The key to detecting a threat can come from anywhere. So having a real-time picture of what's happening across your environment matters. Agent and Beats ingest myriad commercial and OSS sources of security data, enabling monitoring and detection at scale.
Uptime data
Whether you're testing a service from the same host or across the open web, Heartbeat makes it easy to generate uptime and response time data.
File import
With File Data Visualizer, you can upload a CSV, NDJSON, or log file to an Elasticsearch index. File Data Visualizer uses the file structure API to identify the file format and field mappings, after which you can choose to import the data into an index.
Ingest and enrich
Data enrichment
With a variety of analyzers, tokenizer, filters, and index time enrichment options, the Elastic Stack turns raw data into valuable information.
Processors
Use an ingest node to pre-process documents before the actual document indexing happens. The ingest node intercepts bulk and index requests, it applies transformations, and it then passes the documents back to the index or bulk APIs. Ingest node offers over 25 different processors, including append, convert, date, dissect, drop, fail, grok, join, remove, set, split, sort, trim, and more.
Analyzers
Analysis is the process of converting text, like the body of any email, into tokens or terms which are added to the inverted index for searching. Analysis is performed by an analyzer which can be either a built-in analyzer or a custom analyzer defined per index using a combination of tokenizers and filters.
Example: Standard Analyzer (default)
Input: "The 2 QUICK Brown-Foxes jumped over the lazy dog's bone."
Output: the 2 quick brown foxes jumped over the lazy dog's bone
Tokenizers
A tokenizer receives a stream of characters, breaks it up into individual tokens (usually individual words), and outputs a stream of tokens. The tokenizer is also responsible for recording the order or position of each term (used for phrase and word proximity queries) and the start and end character offsets of the original word which the term represents (used for highlighting search snippets). Elasticsearch has a number of built-in tokenizers which can be used to build custom analyzers.
Example: Whitespace tokenizer
Input: "The 2 QUICK Brown-Foxes jumped over the lazy dog's bone."
Output: The 2 QUICK Brown-Foxes jumped over the lazy dog's bone.
Filters
Token filters accept a stream of tokens from a tokenizer and can modify tokens (e.g., lowercasing), delete tokens (e.g., remove stopwords), or add tokens (e.g., synonyms). Elasticsearch has a number of built-in token filters which can be used to build custom analyzers.
Character filters are used to pre-process the stream of characters before it is passed to the tokenizer. A character filter receives the original text as a stream of characters and can transform the stream by adding, removing, or changing characters. Elasticsearch has a number of built-in character filters which can be used to build custom analyzers.
Learn about character filtersLanguage analyzers
Search in your own language. Elasticsearch offers over 30 different language analyzers, including many languages with non-Latin character sets like Russian, Arabic, and Chinese.
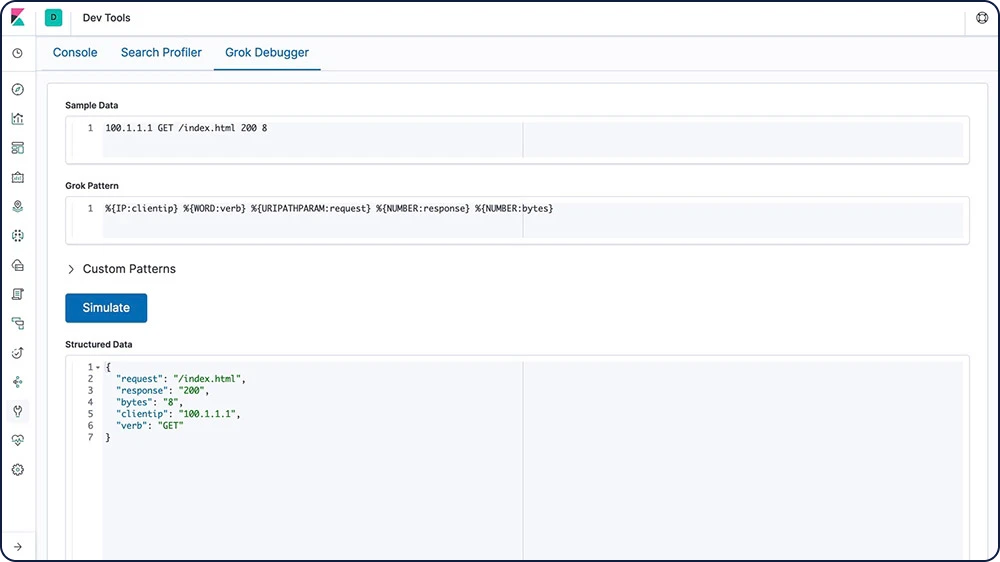
Grok
A grok pattern is like a regular expression that supports aliased expressions that can be reused. Use grok to extract structured fields out of a single text field within a document. This tool is perfect for syslog logs, web server logs like Apache, MySQL logs, and any log format that is generally written for human rather than computer consumption.
Field transformation
If you use datafeeds, you can add scripts to transform your data before it is analyzed. Datafeeds contain an optional script_fields property, where you can specify scripts that evaluate custom expressions and return script fields. Using this functionality, you can perform a variety of transformations.
Adding numerical fields
Concatenating, trimming, and transforming strings
Token replacement
Regular expression matching and concatenation
Splitting strings by domain name
Transforming geo_point data
External lookups
Enrich your log data on ingest with Logstash external lookup plugins. Easily supplement log lines and give them more context with information like client IP location, DNS lookup results, or even data from adjacent log lines. Logstash has a variety of lookup plugins to choose from.
Match enrich processor
The match ingest processor allows users to look up data at the time of ingestion and indicates the index from which to pull enriched data. This helps Beats users that need to add a few elements to their data — rather than pivoting from Beats to Logstash, users can consult the ingest pipeline directly. Users will also be able to normalize data with the processor for better analytics and more common queries.
Geo-match enrich processor
The geo-match enrich processor is a useful and practical way to allow users to improve their search and aggregation capabilities by leveraging their geo data without needing to define queries or aggregations in geo coordinate terms. Similar to the match enrich processor, users can look up data at the time of ingestion and find the optimal index from which to pull enriched data.
Ingest and enrich
Modules and integrations
Clients and APIs
Elasticsearch uses standard RESTful APIs and JSON. We also build and maintain clients in many languages such as Java, Python, .NET, SQL, and PHP. Plus, our community has contributed many more. They're easy to work with, feel natural to use, and, just like Elasticsearch, don't limit what you might want to do with them.
Ingest node
Elasticsearch offers a variety of node types, one of which is specifically for ingesting data. Ingest nodes can execute pre-processing pipelines, composed of one or more ingest processors. Depending on the type of operations performed by the ingest processors and the required resources, it may make sense to have dedicated ingest nodes that will only perform this specific task.
Elastic Agent
Elastic Agent is a single, unified agent that you can deploy to hosts or containers to collect data and send it to the Elastic Stack. You can use it to add monitoring for logs, metrics, and other types of data to each host. Your Elastic Agent controlled host can use the Endpoint Security integration to provide protection by monitoring your host for security-related events, allowing for investigation of security data through the Elastic Security app in Kibana.
Beats
Beats are open source data shippers that you install as agents on your servers to send operational data to Elasticsearch or Logstash. Elastic provides Beats for capturing a variety of common logs, metrics, and other various data types.
Auditbeat for Linux audit logs
Filebeat for log files
Functionbeat for cloud data
Heartbeat for availability data
Journalbeat for systemd journals
Metricbeat for infrastructure metrics
Packetbeat for network traffic
Winlogbeat for Windows event logs
Community shippers
If you have a specific use case to solve, we encourage you to create a community Beat. We've created an infrastructure to simplify the process. The libbeat library, written entirely in Go, offers the API that all Beats use to ship data to Elasticsearch, configure the input options, implement logging, and more.
With 100+ community-contributed Beats, there are agents for Cloudwatch logs and metrics, GitHub activities, Kafka topics, MySQL, MongoDB Prometheus, Apache, Twitter, and so much more.
Explore the available community-developed BeatsLogstash
Logstash is an open source data collection engine with real-time pipelining capabilities. Logstash can dynamically unify data from disparate sources and normalize the data into destinations of your choice. Cleanse and democratize all your data for diverse advanced downstream analytics and visualization use cases.
Logstash plugins
You can add your own input, codec, filter, or output plugins to Logstash. Plugins can be developed and deployed independently of the Logstash core. And you can also write your own Java plugin for use with Logstash.
Elasticsearch-Hadoop
Elasticsearch for Apache Hadoop (Elasticsearch-Hadoop or ES-Hadoop) is an open source, stand-alone, self-contained, small library that allows Hadoop jobs to interact with Elasticsearch. Use it to easily build dynamic, embedded search applications to serve your Hadoop data or perform deep, low-latency analytics using full-text, geospatial queries and aggregations.
Plugins and integrations
As an open source, language-agnostic application, it's easy to extend the functionality of Elasticsearch with plugins and integrations. Plugins are a way to enhance the core Elasticsearch functionality in a custom manner, while integrations are external tools or modules that make it easier to work with Elasticsearch.
API extension plugins
Alerting plugins
Analysis plugins
Discovery plugins
Ingest plugins
Management plugins
Mapper plugins
Security plugins
Snapshot/restore repository plugins
Store plugins
Ingest and enrich
Management
Manage your ingest methods from centralized locations within Kibana.
Fleet
Fleet provides a web-based UI in Kibana to add and manage integrations for popular services and platforms, as well as manage a fleet of Elastic Agents. Our integrations provide an easy way to add new sources of data, plus they ship with out-of-the-box assets like dashboards, visualizations, and pipelines to extract structured fields out of logs.
Logstash centralized pipeline management
Control multiple Logstash instances from the pipeline management UI in Kibana. On the Logstash side, simply enable configuration management and register Logstash to use the centrally managed pipeline configurations.
Data storage
Data storage
Flexibility
The Elastic Stack is a powerful solution that can be thrown at almost any use case. And while it's best known for its advanced search capabilities, its flexible design makes it an optimal tool for many different needs, including document storage, time series analysis and metrics, and geospatial analytics.
Data types
Elasticsearch supports a number of different data types for the fields in a document, and each of those data types offers its own multiple subtypes. This allows you to store, analyze, and utilize data in the most efficient and effective way possible, regardless of the data. Some of the types of data Elasticsearch is optimized for include:
Text
Shapes
Numbers
Vectors
Histogram
Date/time series
Flattened field
Geo-points/geo-shapes
Unstructured data (JSON)
Structured data
Full-text search (inverted index)
Elasticsearch uses a structure called an inverted index, which is designed to allow very fast full-text searches. An inverted index consists of a list of all the unique words that appear in any document, and for each word, a list of the documents in which it appears. To create an inverted index, we first split the content field of each document into separate words (which we call terms, or tokens), create a sorted list of all the unique terms, and then list in which document each term appears.
Document store (unstructured)
Elasticsearch does not require data to be structured in order to be ingested or analyzed (though structuring will improve speeds). This design makes it simple to get started, but also makes Elasticsearch an effective document store. Though Elasticsearch is not a NoSQL database, it still provides similar functionality.
Time series / analytics (columnar store)
An inverted index allows queries to look up search terms quickly, but sorting and aggregations require a different data access pattern. Instead of looking up the term and finding documents, they need to be able to look up the document and find the terms that it has in a field. Doc values are the on-disk data structure in Elasticsearch, built at document index time, which makes this data access pattern possible, allowing search to occur in a columnar fashion. This lets Elasticsearch excel at time series and metrics analysis.
Geospatial (BKD trees)
Elasticsearch uses the BKD tree structures within Lucene to store geospatial data. This allows for the efficient analysis of both geo-points (latitude and longitude) and geo-shapes (rectangles and polygons).
Data storage
Security
Elasticsearch supports multiple ways to make sure data doesn't end up in the wrong hands.
Data encryption at rest support
While the Elastic Stack does not implement encryption at rest out of the box, it is recommended that disk-level encryption be configured on all host machines. In addition, snapshot targets must also ensure that data is encrypted at rest.
Field- and document-level API security
Field-level security restricts the fields that users have read access to. In particular, it restricts which fields can be accessed from document-based read APIs.
Document-level security restricts the documents that users have read access to. In particular, it restricts which documents can be accessed from document-based read APIs.
Learn about document-level securityData storage
Management
Elasticsearch gives you the ability to fully manage your clusters and their nodes, your indices and their shards, and most importantly, all the data held within.
Clustered indices
A cluster is a collection of one or more nodes (servers) that together holds all of your data and provides federated indexing and search capabilities across all nodes. This architecture makes it simple to scale horizontally. Elasticsearch provides a comprehensive and powerful REST API and UIs that you can use to manage your clusters.
Data snapshot and restore
A snapshot is a backup taken from a running Elasticsearch cluster. You can take a snapshot of either individual indices or the entire cluster and store the snapshot in a repository on a shared file system. There are plugins available that also support remote repositories.
Source-only data snapshots
A source repository enables you to create minimal, source-only snapshots that take up to 50% less space on disk. Source-only snapshots contain stored fields and index metadata. They do not include index or doc values structures and are not searchable when restored.
Rollup indices
Keeping historical data around for analysis is extremely useful but often avoided due to the financial cost of archiving massive amounts of data. Retention periods are thus driven by financial realities rather than by the usefulness of extensive historical data. The rollup feature provides a means to summarize and store historical data so that it can still be used for analysis, but at a fraction of the storage cost of raw data.
Search and analyze
Search and analyze
Full-text search
Elasticsearch is known for its powerful full-text search capabilities. Its speed comes from an inverted index at its core, and its power comes from its tunable relevance scoring, advanced query DSL, and wide range of search enhancing-features.
Inverted index
Elasticsearch uses a structure called an inverted index, which is designed to allow very fast full-text searches. An inverted index consists of a list of all the unique words that appear in any document, and for each word, a list of the documents in which it appears. To create an inverted index, we first split the content field of each document into separate words (which we call terms, or tokens), create a sorted list of all the unique terms, and then list in which document each term appears.
Runtime fields
A runtime field is a field that is evaluated at query time (schema on read). Runtime fields can be introduced or modified at any time, including after the documents have been indexed, and can be defined as part of a query. Runtime fields are exposed to queries with the same interface as indexed fields, so a field can be a runtime field in some indices of a data stream and an indexed field in other indices of that data stream, and queries need not be aware of that. While indexed fields provide optimal query performance, runtime fields complement them by introducing flexibility to change the data structure after the documents have been indexed.
Lookup runtime field
Lookup runtime fields gives you the flexibility of adding information from a lookup index to results from a primary index by defining a key on both indices that links documents. Like runtime fields, this feature is used at query time providing flexible data enrichment.
Cross-cluster search
The cross-cluster search (CCS) feature allows any node to act as a federated client across multiple clusters. A cross-cluster search node won't join the remote cluster; instead, it connects to a remote cluster in a light fashion in order to execute federated search requests.
Relevance scoring
A similarity (relevance scoring / ranking model) defines how matching documents are scored. By default, Elasticsearch uses BM25 similarity — an advanced, TF/IDF-based similarity that has built-in tf normalization optimal for short fields (like names) — but many other similarity options are available.
Vector search (ANN)
Building off of Lucene 9's new approximate nearest neighbor or ANN support based on HNSW algorithm, the new _knn_search API endpoint facilitates a more scalable and performant search by vector similarity. It does that by enabling a trade off between recall and performance, i.e., enabling much better performance on very large datasets (compared with the existing brute force vector similarity method) by making a minor compromises on recall.
Query DSL
Full-text search requires a robust query language. Elasticsearch provides a full Query DSL (domain-specific language) based on JSON to define queries. Create simple queries to match terms and phrases, or develop compound queries that can combine multiple queries. Additionally, filters can be applied at query time to remove documents before they're given a relevance score.
Asynchronous search
The asynchronous search API enables users to run long-running queries in the background, track query progress, and retrieve partial results as they become available.
Highlighters
Highlighters enable you to get highlighted snippets from one or more fields in your search results so you can show users where the query matches are. When you request highlights, the response contains an additional highlight element for each search hit that includes the highlighted fields and the highlighted fragments.
Type ahead (auto-complete)
The completion suggester provides auto-complete/search-as-you-type functionality. This is a navigational feature to guide users to relevant results as they are typing, improving search precision.
Corrections (spell check)
The term suggester is at the root of spell check, suggesting terms based on edit distance. The provided suggest text is analyzed before terms are suggested. The suggested terms are provided per analyzed suggest text token.
Suggesters (did-you-mean)
The phrase suggester adds did-you-mean functionality to your search by building additional logic on top of the term suggester to select entire corrected phrases instead of individual tokens weighted based on ngram-language models. In practice this suggester will be able to make better decisions about which tokens to pick based on co-occurrence and frequencies.
Percolators
Flipping the standard search model of using a query to find a document stored in an index, percolators can be used to match documents to queries stored in an index. The percolate query itself contains the document that will be used as a query to match with the stored queries.
Query profiler/optimizer
The profile API provides detailed timing information about the execution of individual components in a search request. It provides insight into how search requests are executed at a low level so you can understand why certain requests are slow and take steps to improve them.
Permissions-based search results
Field-level security and document-level security restrict search results to only what users have read access to. In particular, it restricts which fields and documents can be accessed from document-based read APIs.
Query cancellation
Query cancellation is a helpful Kibana feature that helps overall cluster impact by reducing unnecessary processing overload. Automatic cancellation of Elasticsearch requests will occur when users change/update their query or refresh the browser page.
Search and analyze
Analytics
Searching for data is just a start. The powerful analytical features of the Elastic Stack allow you take the data you've searched for and find deeper meaning. Whether through aggregating results, finding relationships between documents, or creating alerts based on threshold values, it's all built on a foundation of powerful search functionality.
Aggregations
The aggregations framework helps provide aggregated data based on a search query. It is based on simple building blocks called aggregations that can be composed in order to build complex summaries of the data. An aggregation can be seen as a unit-of-work that builds analytic information over a set of documents.
Metrics aggregations
Bucket aggregations
Pipeline aggregations
Matrix aggregations
Geohexgrid aggregations
Random sampler aggregations
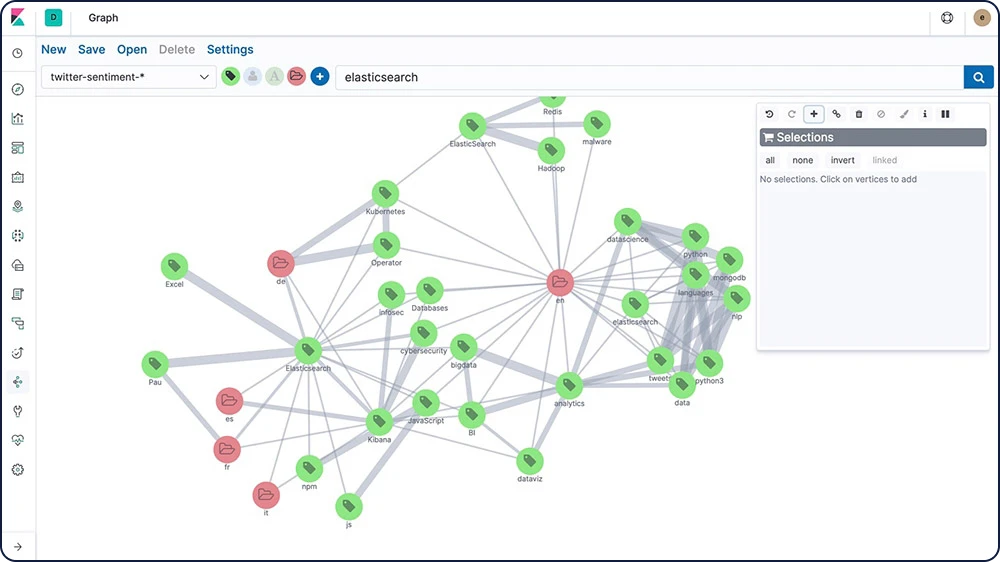
Graph exploration
The Graph explore API enables you to extract and summarize information about the documents and terms in your Elasticsearch index. The best way to understand the behavior of this API is to use Graph in Kibana to explore connections.
Threshold alerting
Create threshold alerts to periodically check when the data in your Elasticsearch indices goes above or below a certain threshold within a given time interval. Our alerting features give you the full power of the Elasticsearch query language to identify changes in your data that are interesting to you.
Search and analyze
Machine learning
Elastic machine learning features automatically model the behavior of your Elasticsearch data — trends, periodicity, and more — in real time to identify issues faster, streamline root cause analysis, and reduce false positives.
Inference
Inference enables you to use supervised machine learning processes – like regression or classification – not only as a batch analysis but in a continuous fashion. Inference makes it possible to use trained machine learning models against incoming data.
Language identification
Language identification is a trained model that you can use to determine the language of text. You can reference the language identification model in an inference processor.
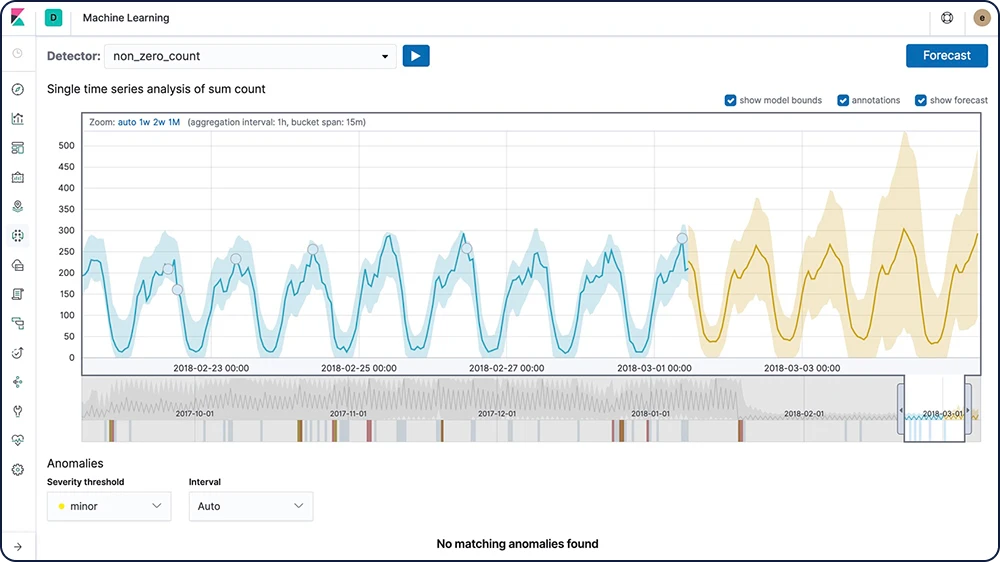
Forecasting on time series
After Elastic machine learning creates baselines of normal behavior for your data, you can use that information to extrapolate future behavior. Then create a forecast to estimate a time series value at a specific future date or estimate the probability of a time series value occurring in the future
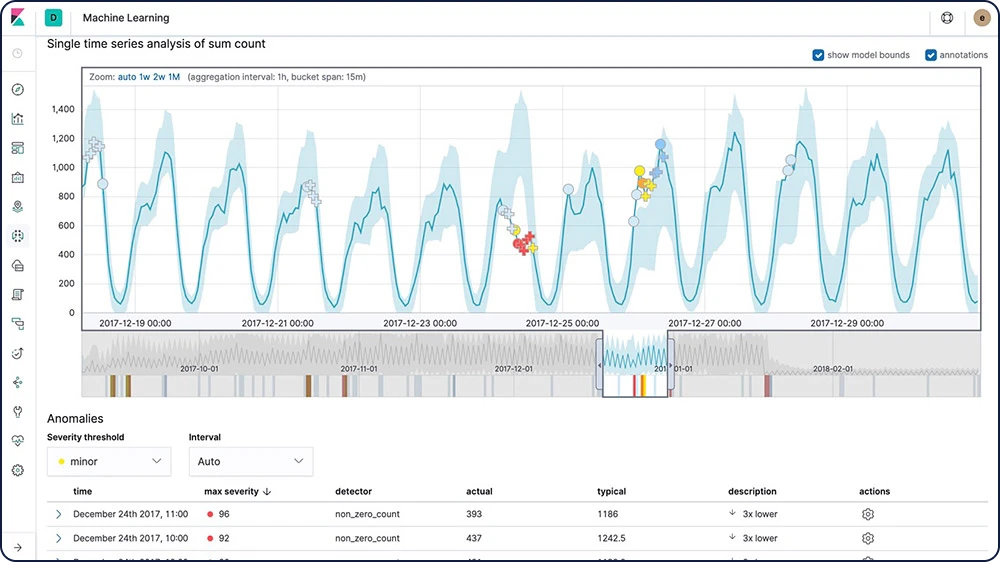
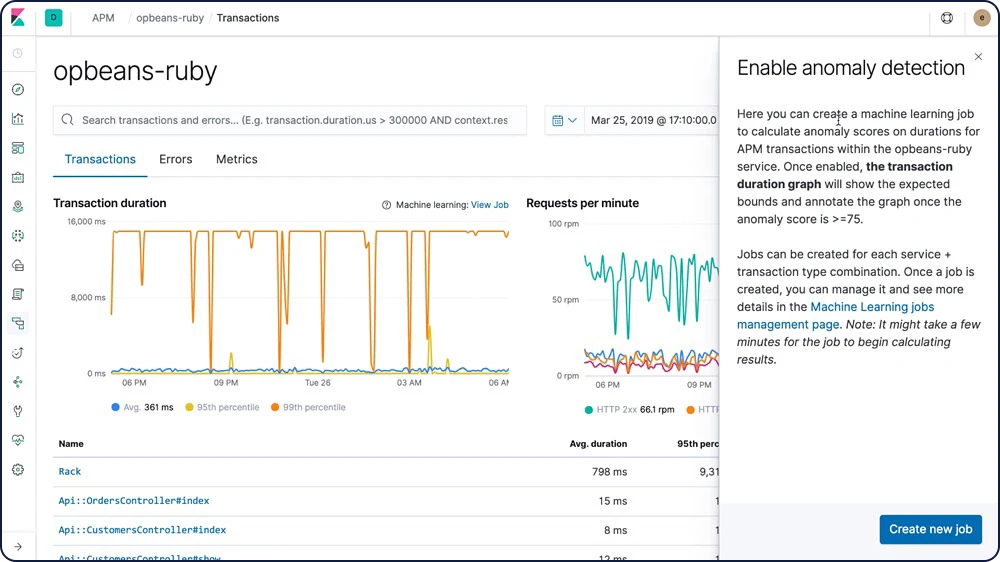
Anomaly detection on time series
Elastic machine learning features automate the analysis of time series data by creating accurate baselines of normal behavior in the data and identifying anomalous patterns in that data. Anomalies are detected, scored, and linked with statistically significant influencers in the data using proprietary machine learning algorithms.
Anomalies related to temporal deviations in values, counts, or frequencies
Statistical rarity
Unusual behaviors for a member of a population
Alerting on anomalies
For changes that are harder to define with rules and thresholds, combine alerting with unsupervised machine learning features to find the unusual behavior. Then use the anomaly scores in the alerting framework to get notified when problems arise.
Population/entity analysis
Use Elastic machine learning features to build a profile of what a "typical" user, machine, or other entity does over a specified time period and then identify outliers when they behave abnormally compared to the population.
Log message categorization
Application log events are often unstructured and contain variable data. Elastic machine learning features observe the static parts of the message, cluster similar messages together, and classify them into message categories.
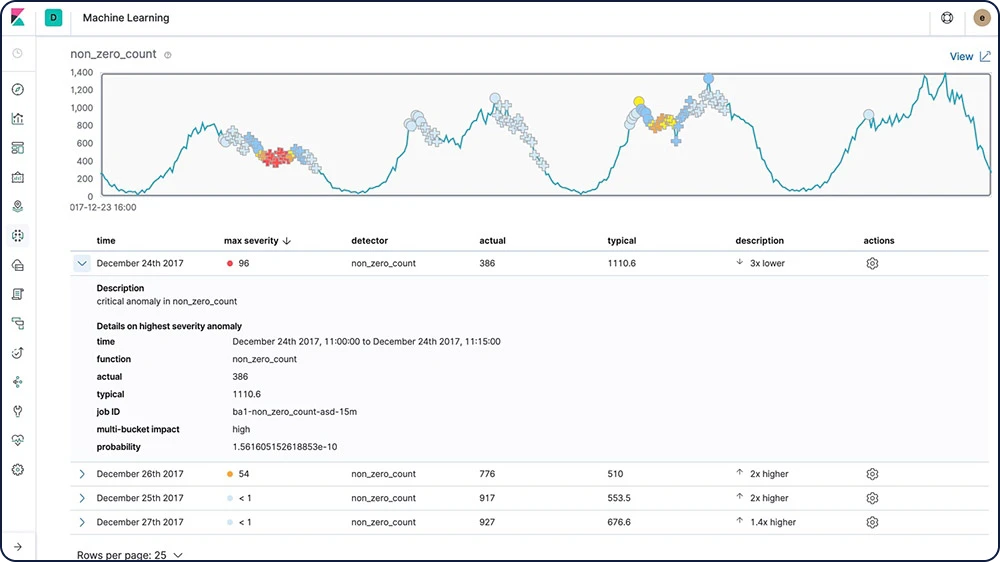
Root cause indication
Once an anomaly is detected, Elastic machine learning features make it easy to identify the properties that significantly influenced it. For instance, if there's an unusual drop in transactions, you can quickly identify the failing server or misconfigured switch causing the problem.
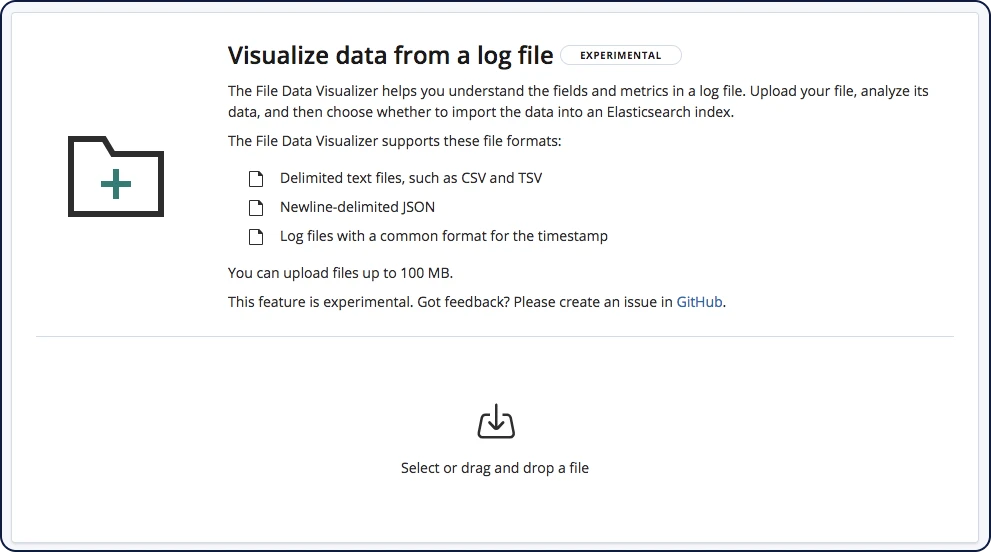
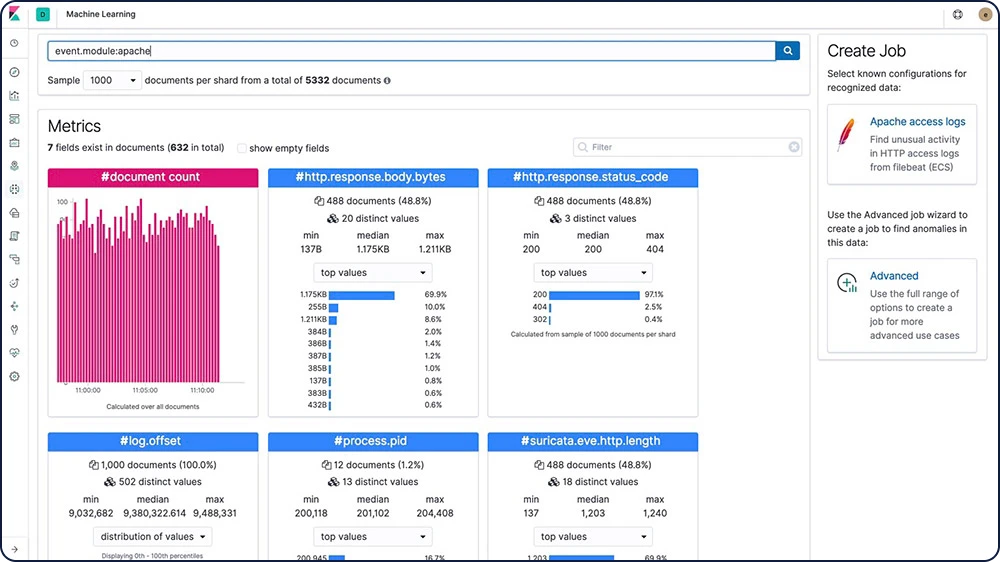
Data Visualizer
Data Visualizer helps you better understand your Elasticsearch data and identify possible fields for machine learning analysis by analyzing the metrics and fields in a log file or an existing index.
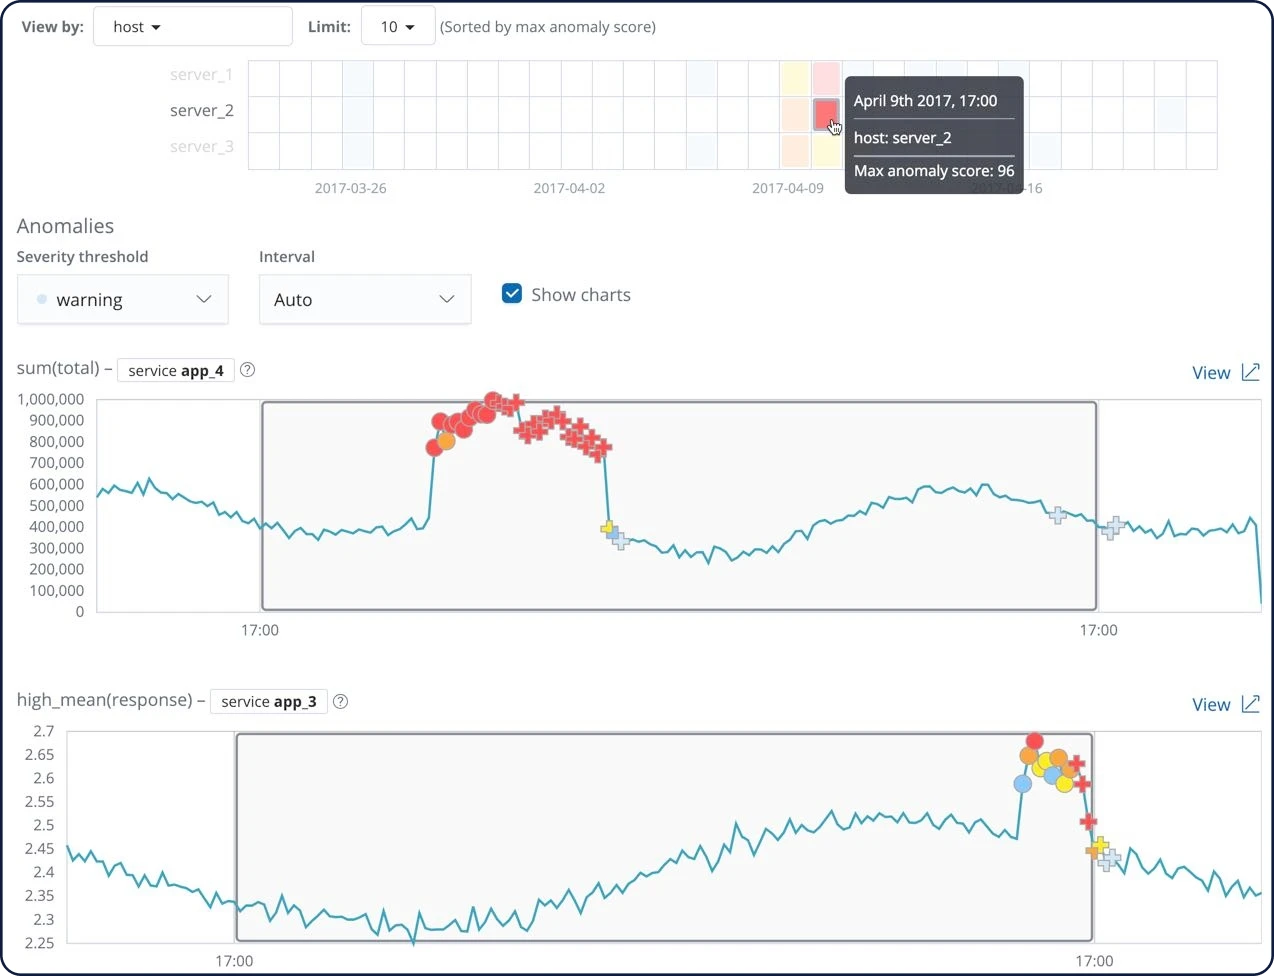
Multi-metric anomaly explorer
Create complex machine learning jobs with multiple detectors. Use the Anomaly Explorer to view the results after a multi-metric job has analyzed the input stream of data, modeled its behavior, and performed analysis based on the two detectors you defined in your job.
Outlier detection API
Unsupervised outlier detection uses four different distance- and density-based machine learning techniques to find which data points are unusual compared to the majority. Create outlier detection data frame analytics jobs by using the create data frame analytics jobs API.
Model snapshot management
Quickly revert a model back to a desired snapshot in case of an unplanned system outage or other event causing misleading results in anomaly detection.
Search and analyze
Elastic APM
Already housing logs and system metrics in Elasticsearch? Expand to application metrics with Elastic APM. Four lines of code let you see a bigger picture to quickly fix issues and feel good about the code you push.
APM Server
The APM Server receives data from APM agents and transforms them into Elasticsearch documents. It does this by exposing an HTTP server endpoint to which agents stream the APM data they collect. After the APM Server has validated and processed events from the APM agents, the server transforms the data into Elasticsearch documents and stores them in corresponding Elasticsearch indices.
APM agents
APM agents are open source libraries written in the same language as your service. You install them into your service as you would install any other library. They instrument your code and collect performance data and errors at runtime. This data is buffered for a short period and sent on to the APM Server.
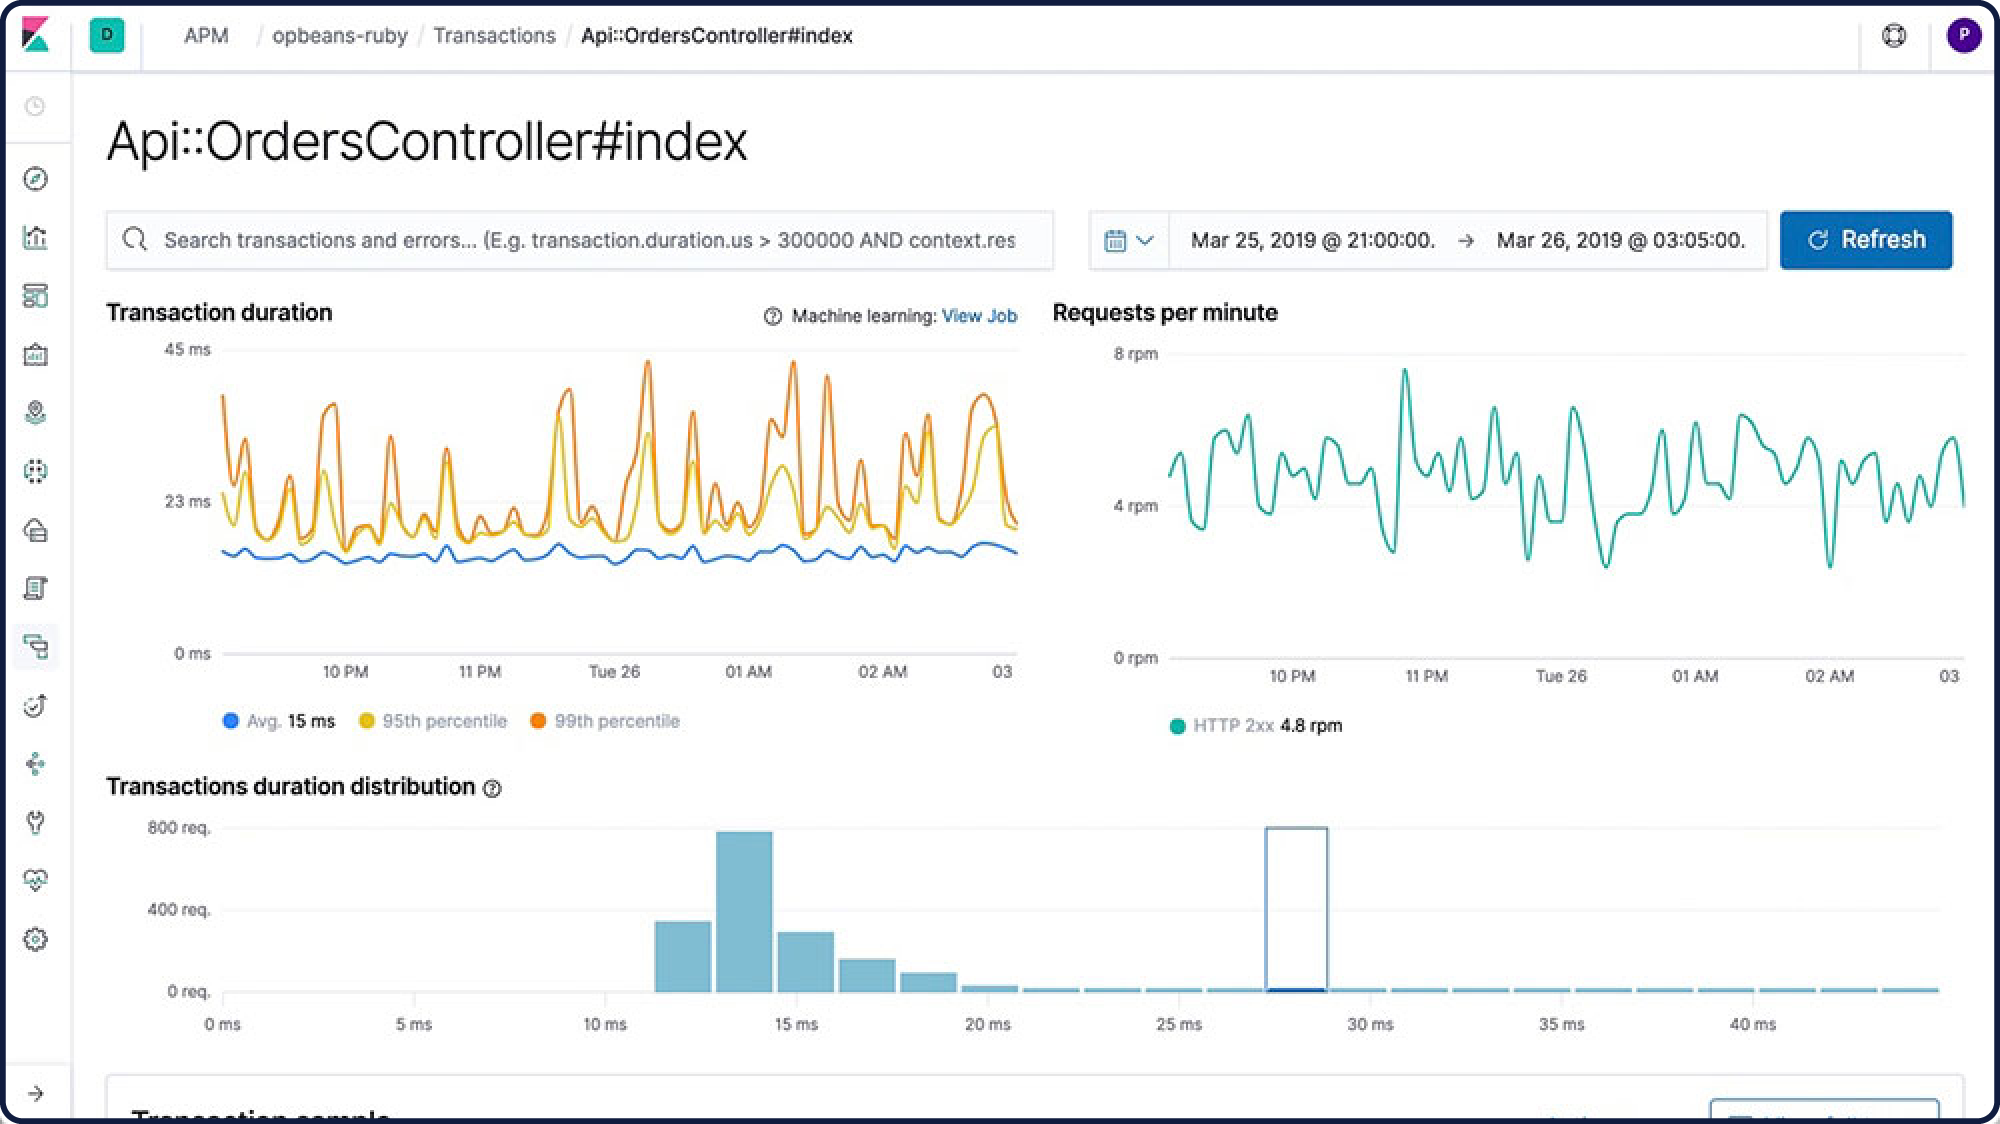
APM app
Finding and fixing roadblocks in your code boils down to search. Our dedicated APM app in Kibana lets you identify bottlenecks and zero in on problematic changes at the code level. As a result, you get better, more efficient code that leads to a speedier develop-test-deploy loop, faster applications, and better customer experiences.
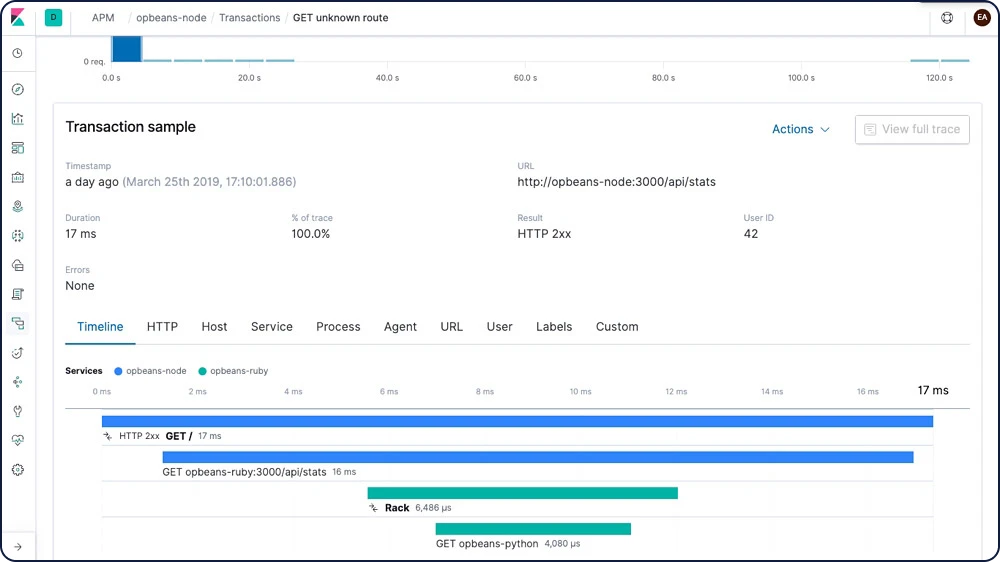
Distributed tracing
Wondering how requests are flowing through your entire infrastructure? String transactions together with a distributed trace and get a clear view of how your services are interacting. Find where latency issues are arising in the path and then pinpoint the components that need optimizing.
Alerting integration
Stay up to date on how your code is performing. Get an email notification when something goes awry or a Slack notification when something goes really right.
Service maps
Service maps are a visual representation of how your services are connected and provide high-level transaction metrics like average transaction duration, request and error rates, plus CPU and memory usage.
Machine learning integration
Create a machine learning job directly from the APM app. Quickly hone in on abnormal behavior with machine learning features that automatically model your data.
Explore and visualize
Explore and visualize
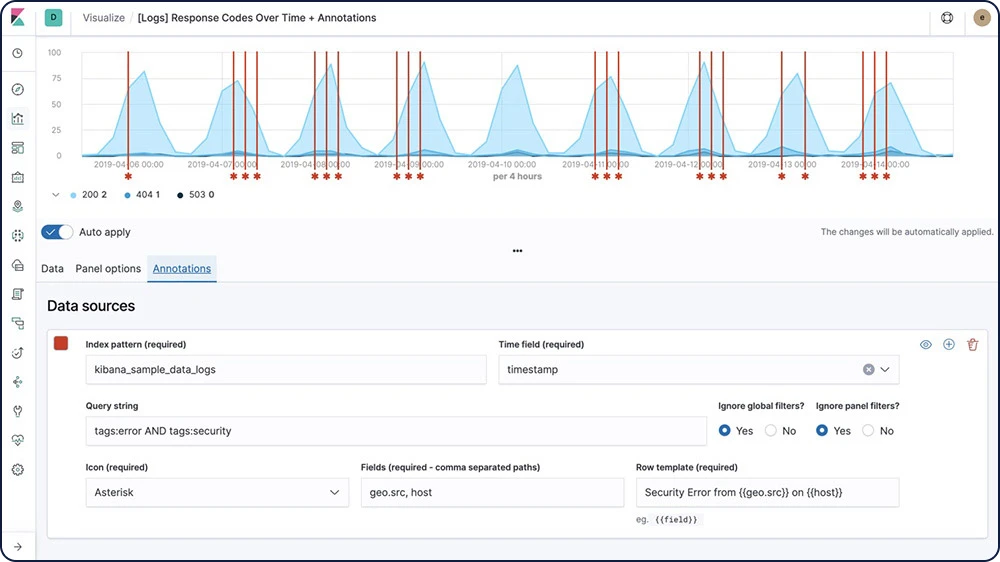
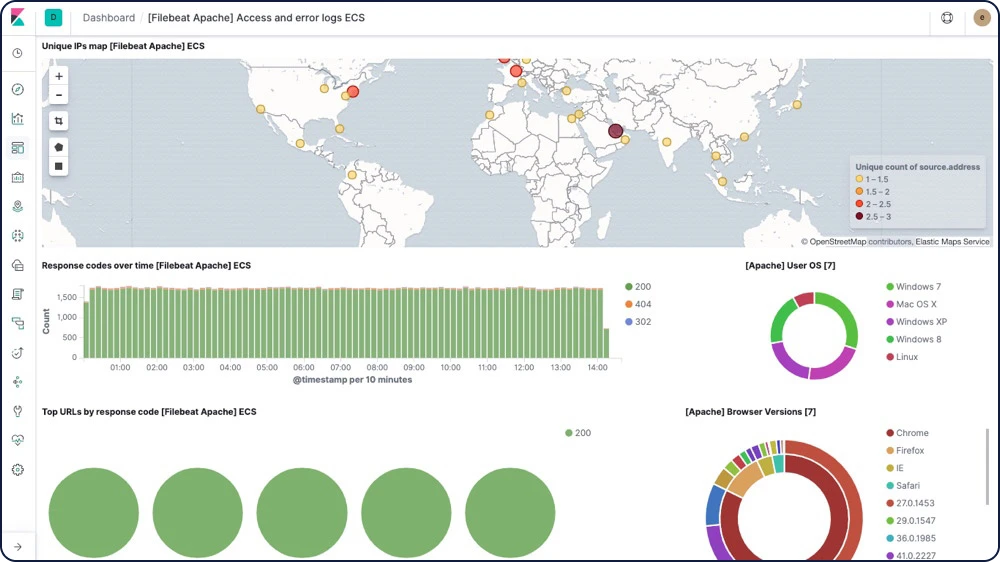
Visualizations
Create visualizations of the data in your Elasticsearch indices. Kibana visualizations are based on Elasticsearch queries. By using a series of Elasticsearch aggregations to extract and process your data, you can create charts that show you the trends, spikes, and dips you need to know about.
Dashboards
A Kibana dashboard displays a collection of visualizations and searches. You can arrange, resize, and edit the dashboard content and then save the dashboard so you can share it. You can create custom drilldowns between multiple dashboards or even out to web applications to drive action and decision making.
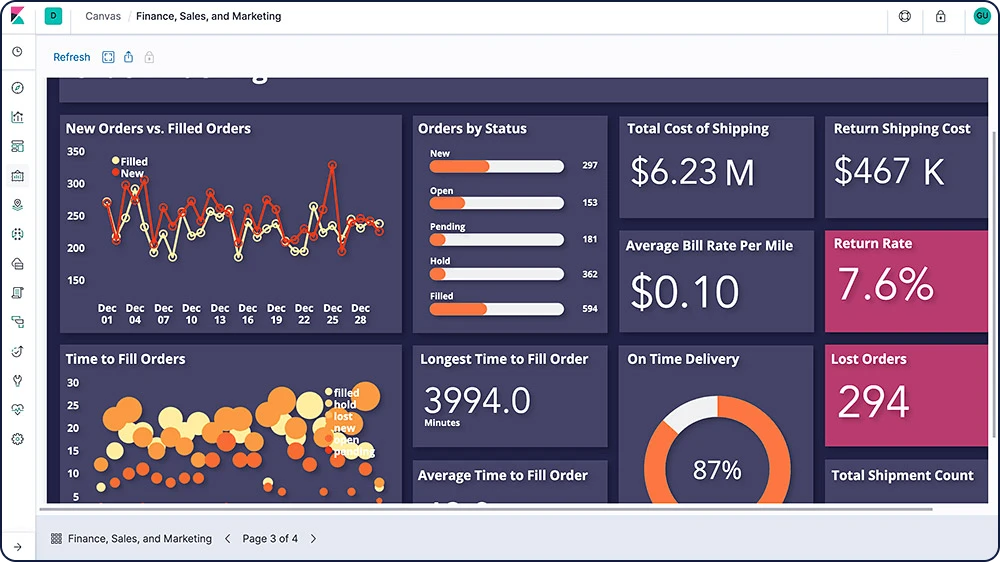
Canvas
Canvas is a whole new way of making data look amazing. Canvas combines data with colors, shapes, text, and your own imagination to bring dynamic, multi-page, pixel-perfect data displays to screens large and small.
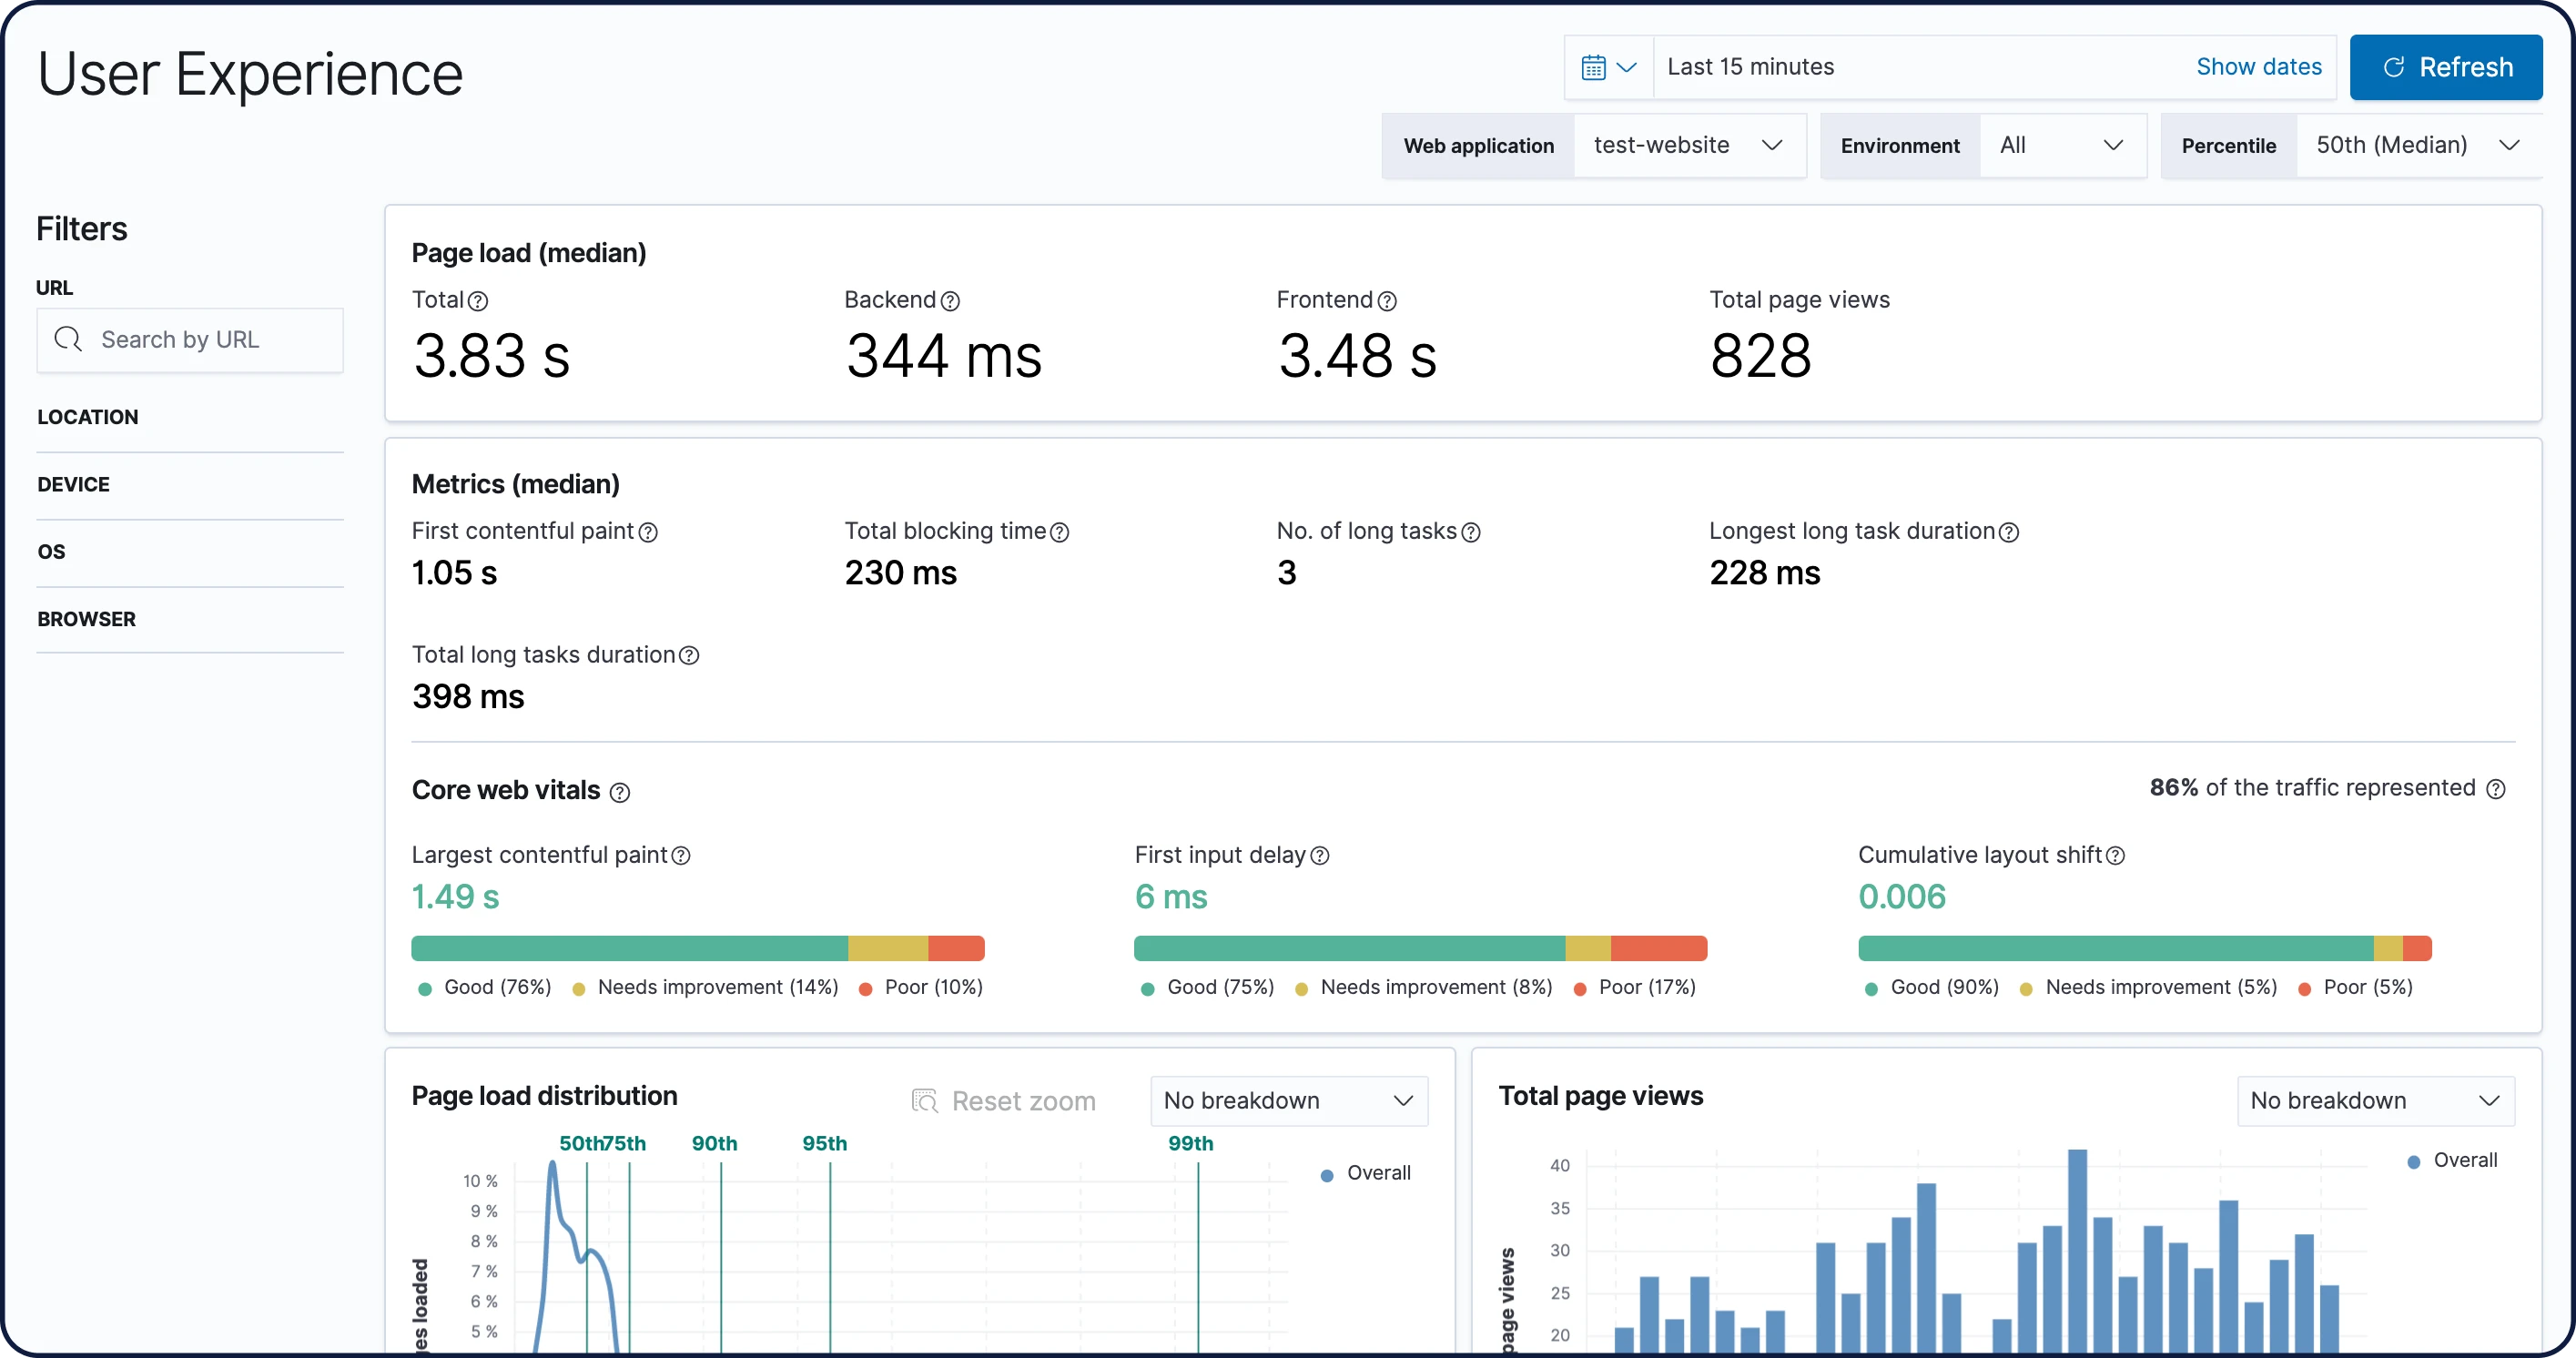
User Experience
User Experience data reflects real-world user experiences. Quantify and analyze the perceived performance of your web application.
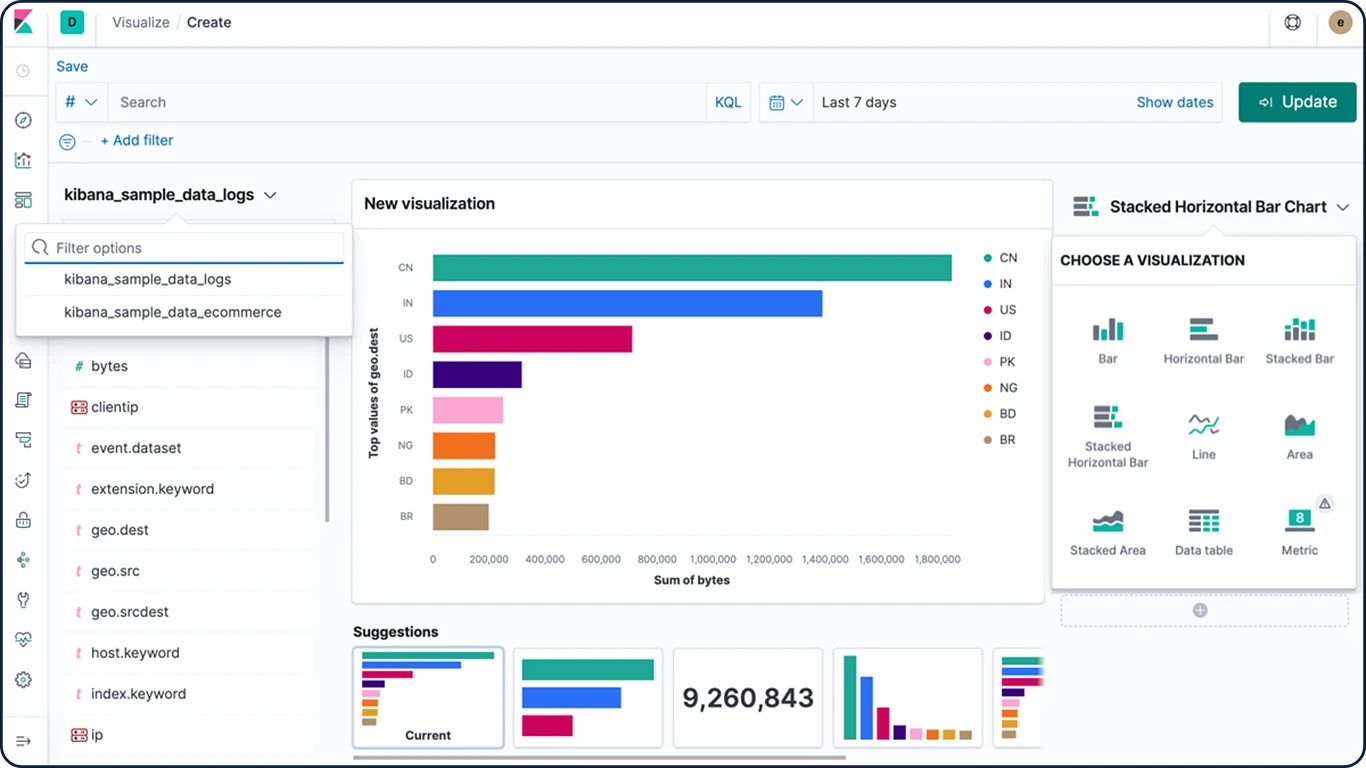
Kibana Lens
Kibana Lens is an easy-to-use, intuitive UI that simplifies the process of data visualization through a drag-and-drop experience. Whether you're exploring billions of logs or spotting trends from your website traffic, Lens gets you from data to insights in just a few clicks — no prior experience in Kibana required.
Time Series Visual Builder
Using the full power of the Elasticsearch aggregation framework, Time Series Visual Builder (TSVB) is a time series data visualizer that combines an infinite number of aggregations and pipeline aggregations to display complex data in a meaningful way.
Graph analytics
The graph analytics features enable you to discover how items in an Elasticsearch index are related. You can explore the connections between indexed terms and see which connections are the most meaningful. This can be useful in a variety of applications, from fraud detection to recommendation engines.
Geospatial analysis
"Where" is a critical question for many users of the Elastic Stack. Whether you're protecting your network from attackers, investigating slow application response times in specific locations, or simply hailing a ride home, geo data and search play an important role.
Container monitoring
Your apps and environment are evolving, and so is the Elastic Stack. Monitor, search, and visualize what's happening in your applications, Docker, and Kubernetes — all in one place.
Kibana plugins
Add even more functionality to Kibana with community-driven plugin modules. Open source plugins are available for a variety of apps, extensions, visualizations, and more. Plugins include:
Vega visualizations
Prometheus exporter
3D charts and graphs
Calendar visualizations
And many more
Data import tutorial
With our easy-to-follow tutorial, learn to load a data set into Elasticsearch, define an index pattern, discover and explore the data, create visualizations and dashboards, and more.
Kibana runtime fields editor
The Kibana runtime fields editor uses the Elasticsearch functionality for runtime fields to give analysts access to adding their own custom fields on the fly. From Index Patterns, Discover, and Kibana Lens, this editor is available to create, edit, or remove runtime fields.
Explore and visualize
Share and collaborate
Easily share Kibana visualizations with your team members, your boss, their boss, your customers, compliance managers, contractors — anyone you like, really — using the sharing option that works for you. Embed a dashboard, share a link, or export to PDF, PNG, or CSV files and send as an attachment. Or organize your dashboards and visualizations into Kibana spaces.
Embeddable dashboards
From Kibana, you can easily share a direct link to a Kibana dashboard, or embed the dashboard in a web page as an iframe — either as a live dashboard or a static snapshot of the current point in time.
Dashboard-only mode
Use the kibana_dashboard_only_user built-in role to limit what users see when they log in to Kibana. The kibana_dashboard_only_user role is preconfigured with read-only permissions to Kibana. When users open a dashboard, they will have a limited visual experience. All edit and create controls are hidden.
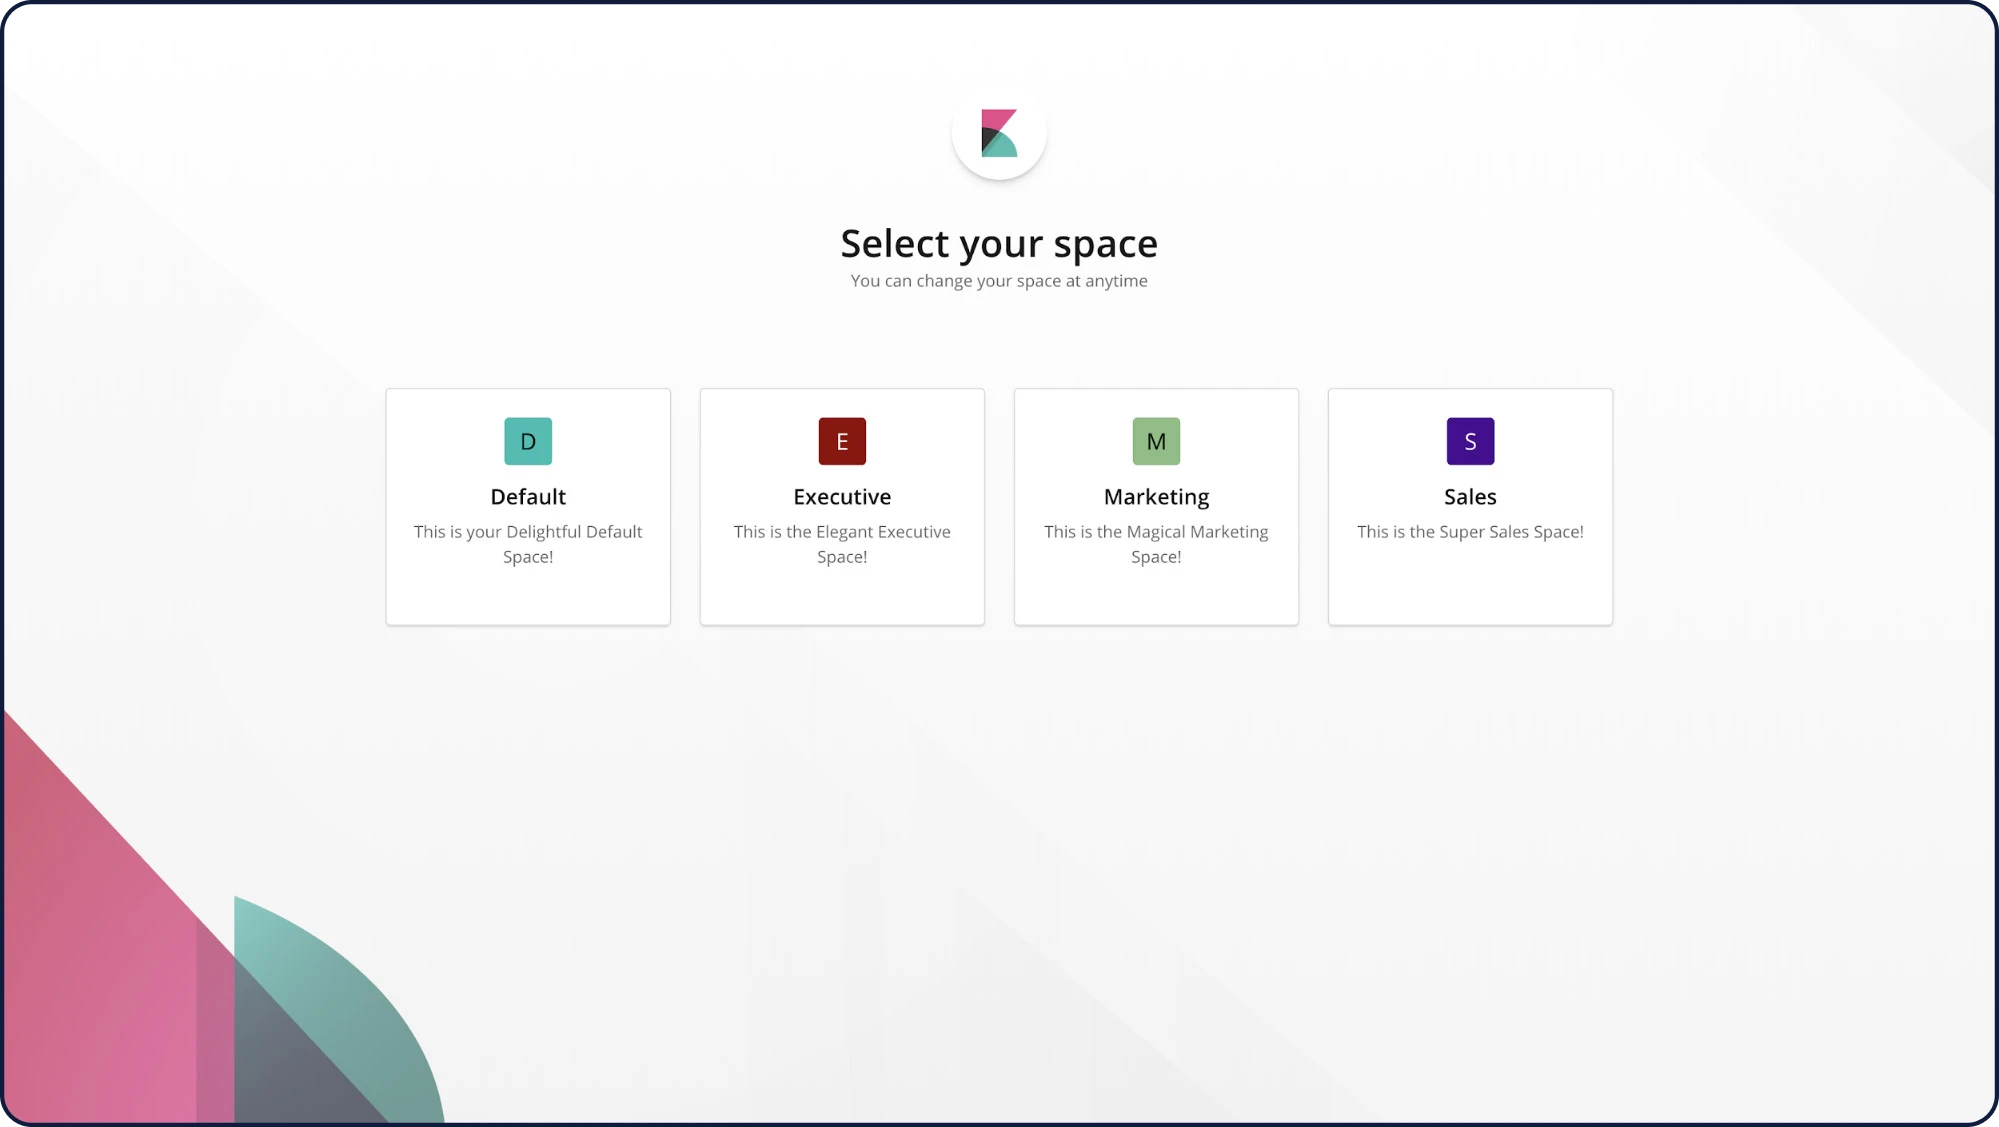
Spaces
With Spaces in Kibana, you can organize your dashboards and other saved objects into meaningful categories. Once you're in a specific space, you will only see the dashboards and other saved objects that belong to it. And with security enabled, you can control which users have access to individual spaces, giving you an extra layer of protection.
Custom banners for Kibana Spaces
Custom banners help to differentiate Kibana Spaces for different roles, teams, functions, and more. Tailor specific announcements and messagings to individual Kibana Spaces, and help users quickly identify which Space they’re in.
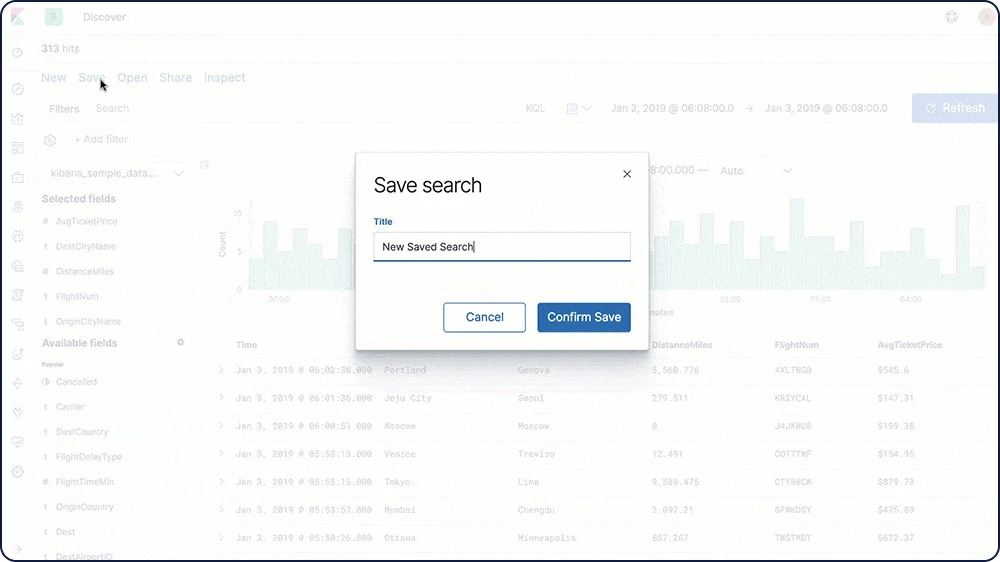
CSV exports
Export saved searches in Discover to CSV files for use with external text editors.
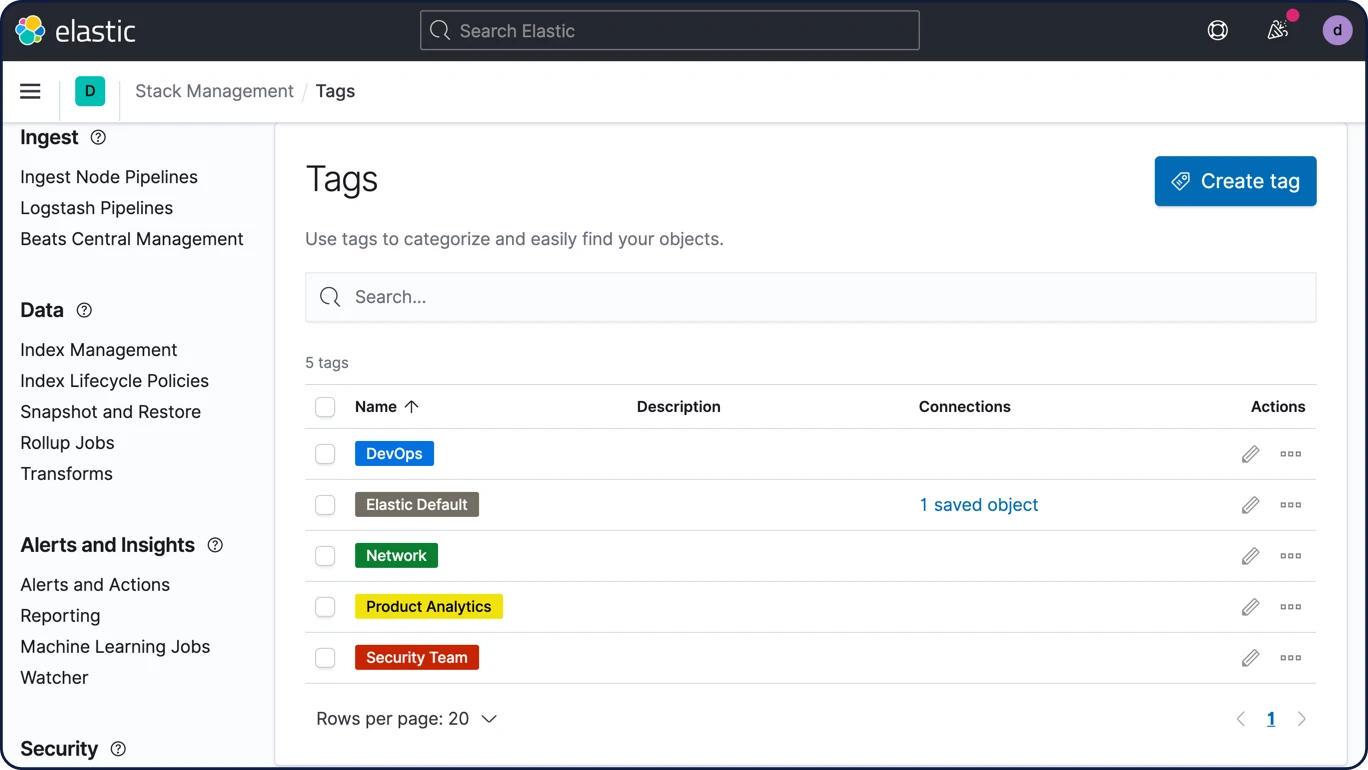
Tags
Easily create tags and add them to dashboards and visualization for efficient content management.
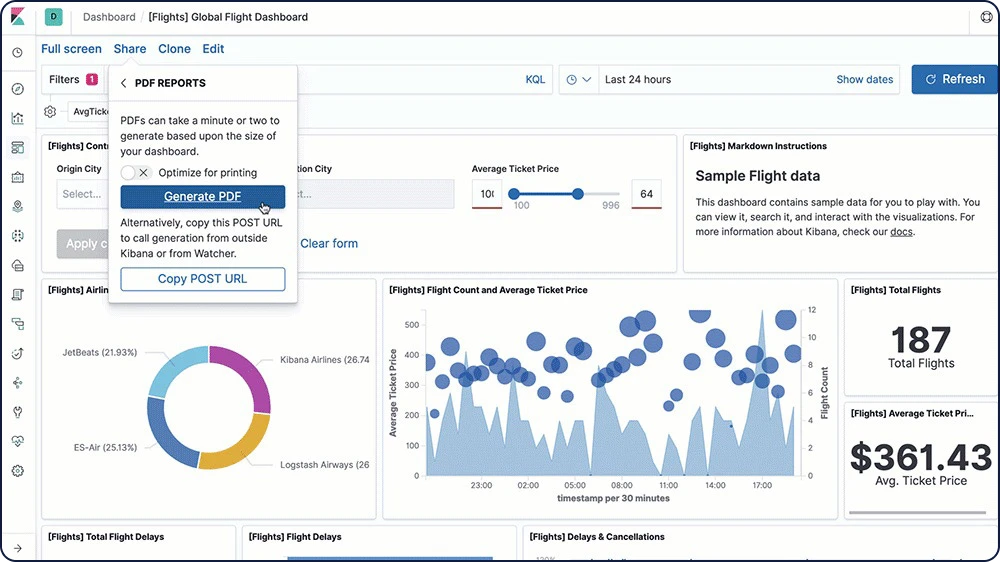
PDF/PNG reports
Quickly generate reports of any Kibana visualization or dashboard and save them to PDF or PNG. Get a report on demand, schedule it for later, trigger it based on specified conditions, and automatically share it with others.
Explore and visualize
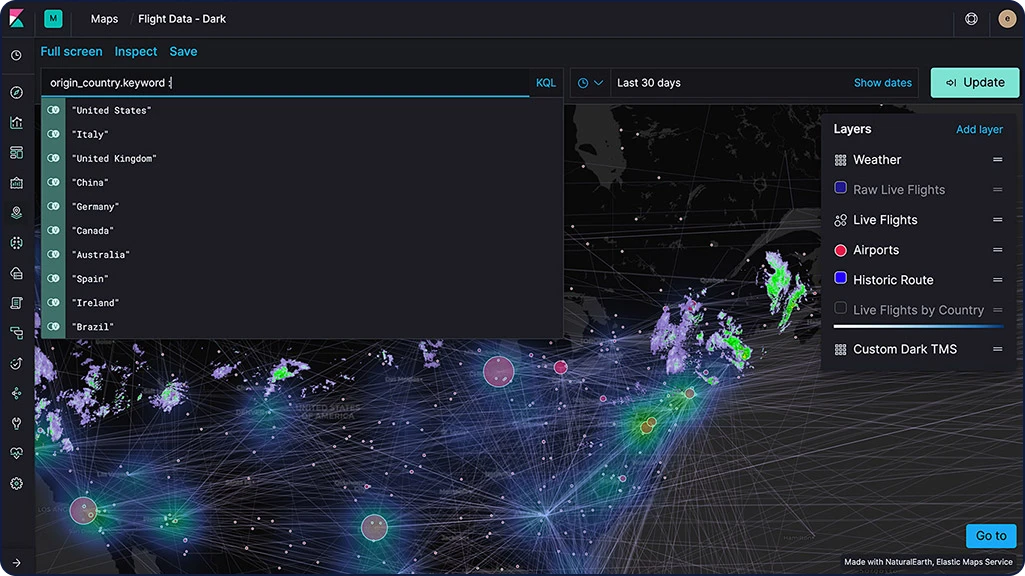
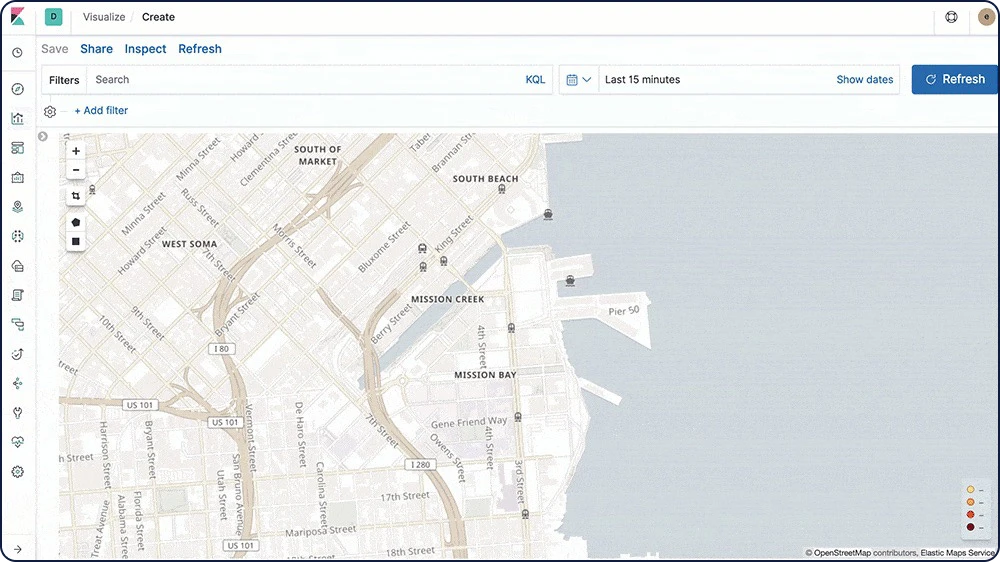
Elastic Maps
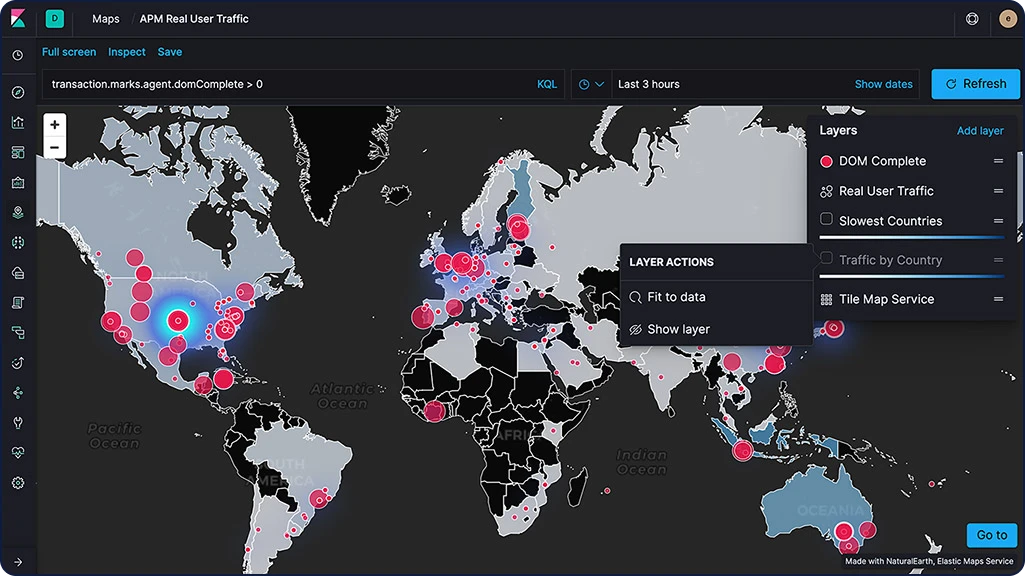
The Maps app enables you to parse through your geographical data at scale, with speed, and in real time. With features like multiple layers and indices in a map, plotting of raw documents, dynamic client-side styling, and global search across multiple layers, you can understand and monitor your data with ease.
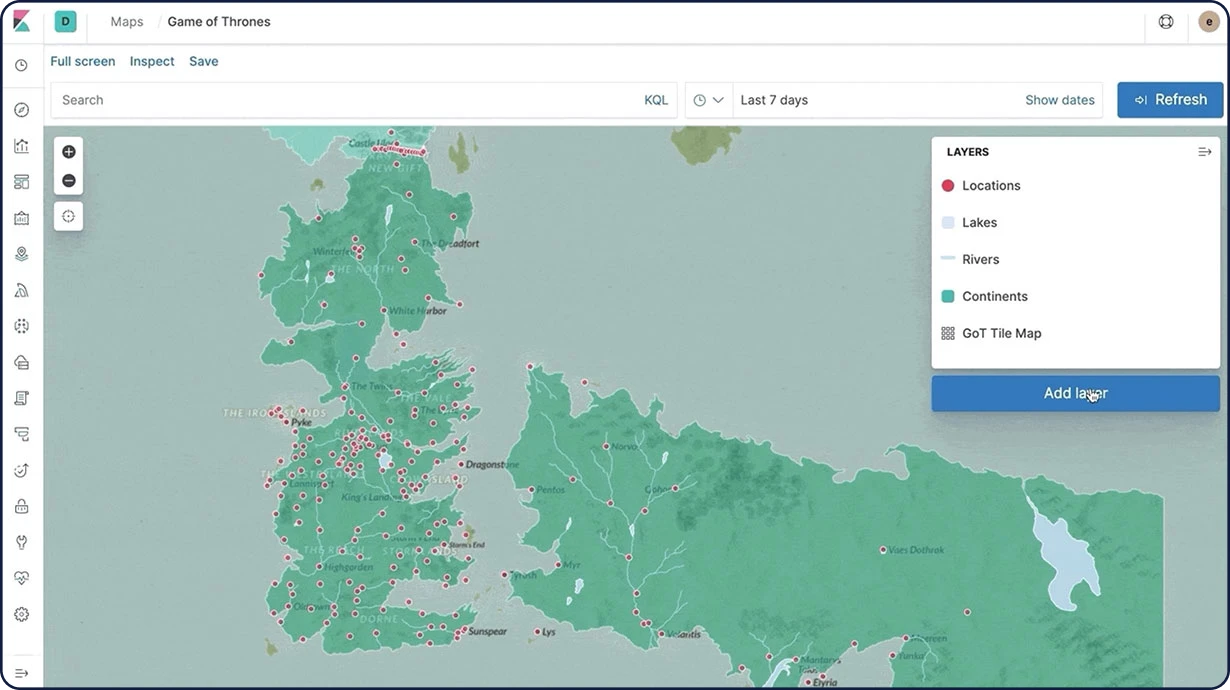
Map layers
Add layers from unique indices into one view using the Maps app in Kibana. And since the layers are on the same map, you can search and filter across all of them in real time. Options include choropleth layers, heat map layers, tile layers, and vector layers and even use-case specific layers like observability for APM data.
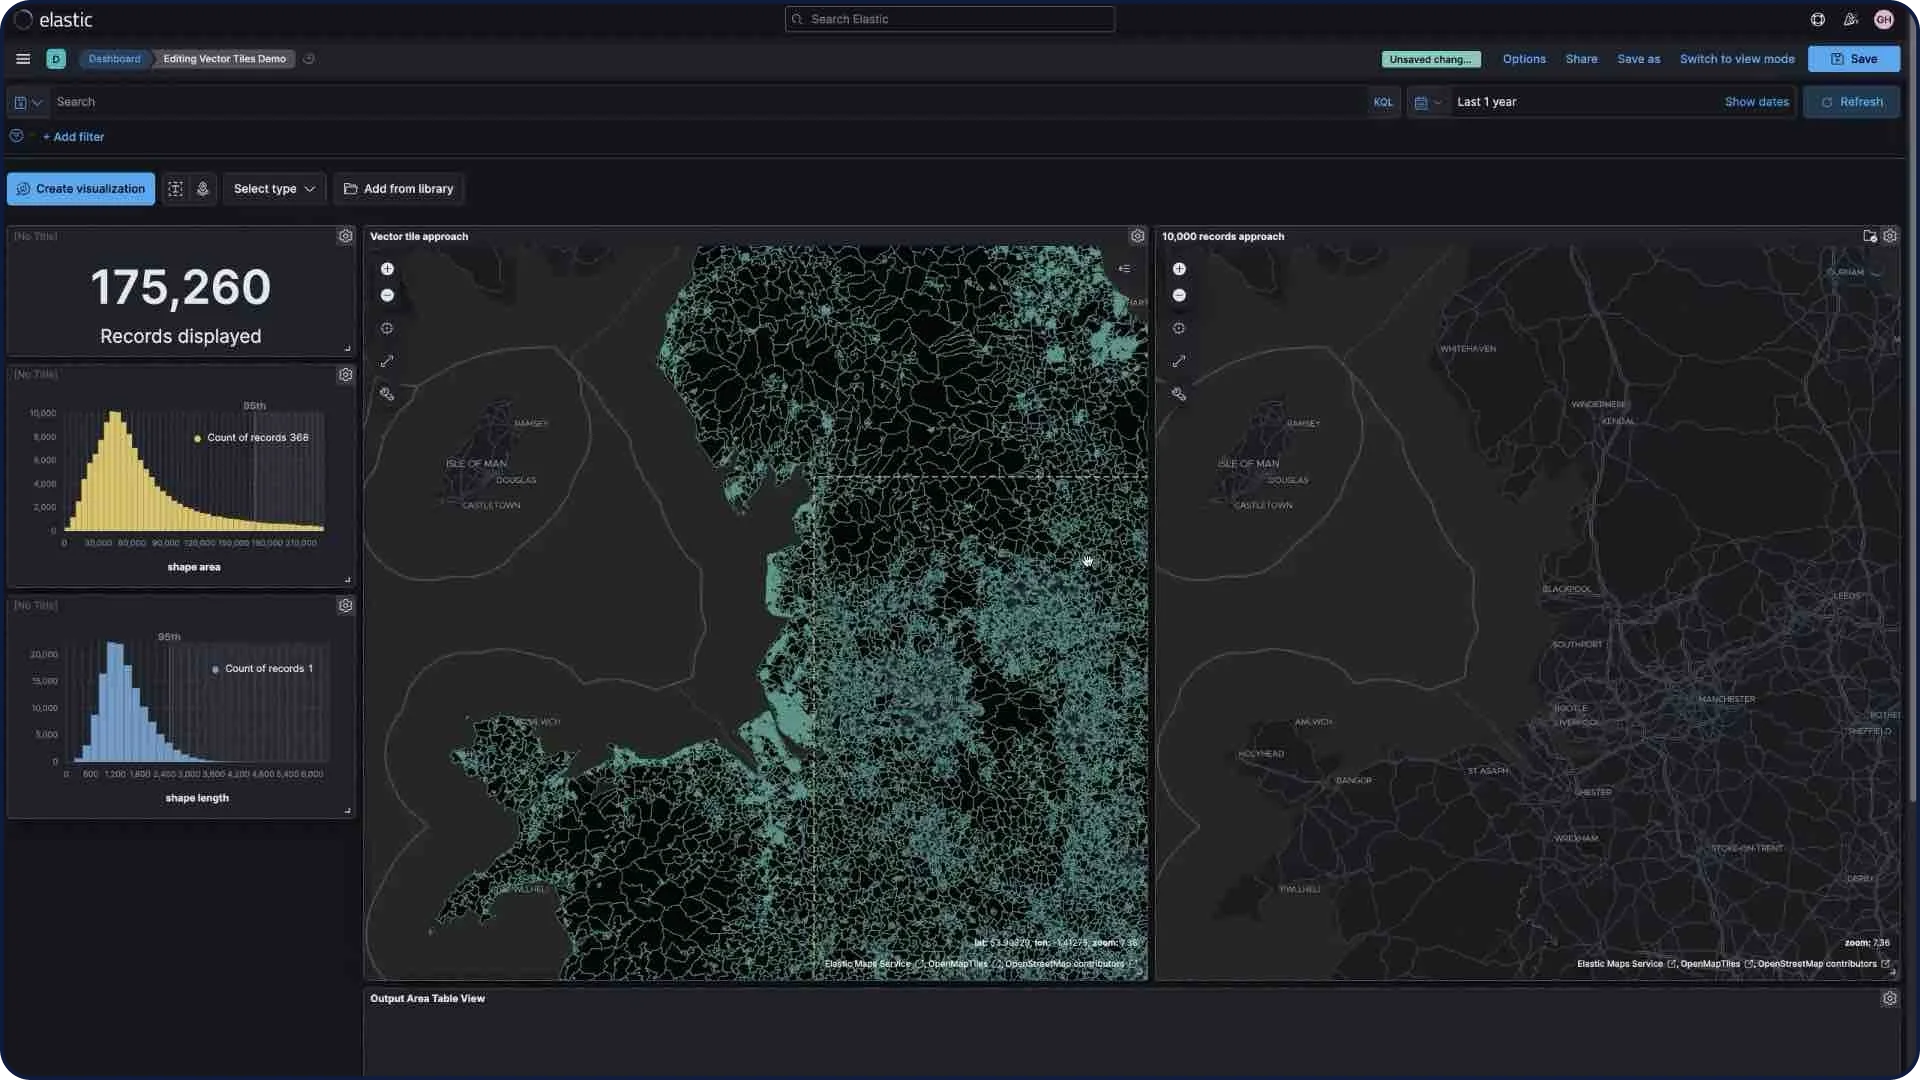
Vector tiles
Vector tiles partition your map into tiles and offer the best performance and smooth zooming over the alternative methods. All new polygon layers enable the 'Use vector tiles' setting by default. You can change the scaling options in layer settings if you prefer the 10,000 records approach.
Custom region maps
Create region maps — thematic maps in which boundary vector shapes are colored using a gradient — using the custom location data on a schematic of your choosing.

Elastic Maps Service (zoom levels)
The Elastic Maps Service powers all the geospatial visualizations in Kibana (including the Maps app) by serving basemap tiles, shapefiles, and key features that are essential for visualizing geodata. With the default distribution of Kibana, you can zoom in up to 18x on a map.
Elastic Maps Server
The Elastic Maps Server uses the Elastic Maps Service’s basemaps and boundaries on local infrastructure.
GeoJSON upload
Though simple and easy to use, the GeoJSON upload feature is robust. Through direct ingestion into Elasticsearch, the feature enables map creators to drag and drop GeoJSON files enriched with points, shapes, and content into a map for instantaneous visualization. Enable email or webapp alerts using GeoJSON defined boundaries when tracking data driven object movement.
Geo alerts
Trigger notifications when an entity enters, leaves, or crosses a boundary. Monitor the location of an entity while it remains inside a specified boundary.
Shapefile upload
Load shapefiles into Elastic with this simple but powerful uploader built right into the Maps application. Easily load local open data and boundaries for analysis and comparison.
Explore and visualize
Elastic Logs
With out-of-the-box support for common data sources and default dashboards to boot, the Elastic Stack is all about the it-just-works experience. Ship logs with Filebeat and Winlogbeat, index into Elasticsearch, and visualize it all in Kibana in minutes.
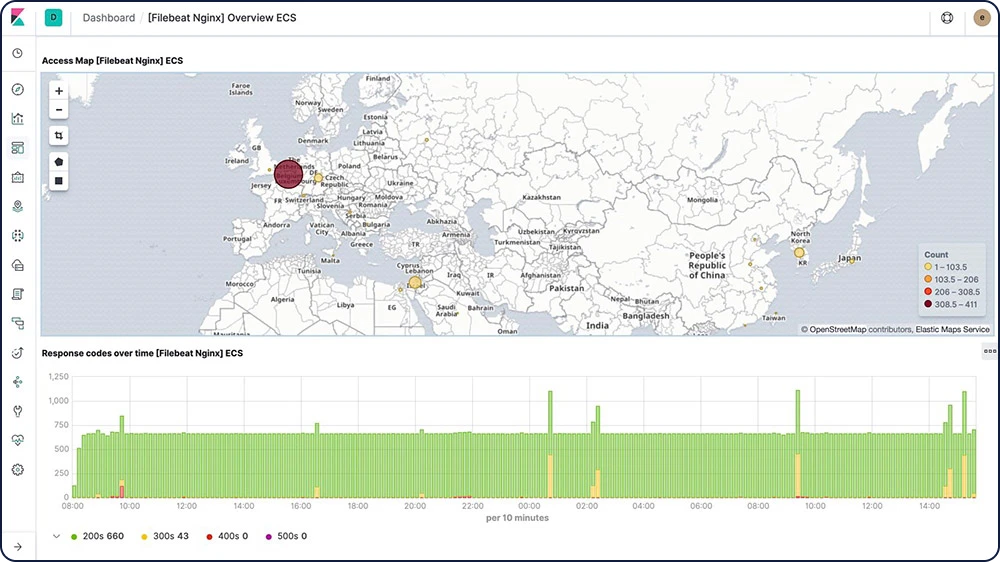
Log shipper (Filebeat)
Filebeat helps you keep the simple things simple by offering a lightweight way to forward and centralize logs and files. Filebeat comes with internal modules (auditd, Apache, NGINX, System, MySQL, and more) that simplify the collection, parsing, and visualization of common log formats down to a single command.
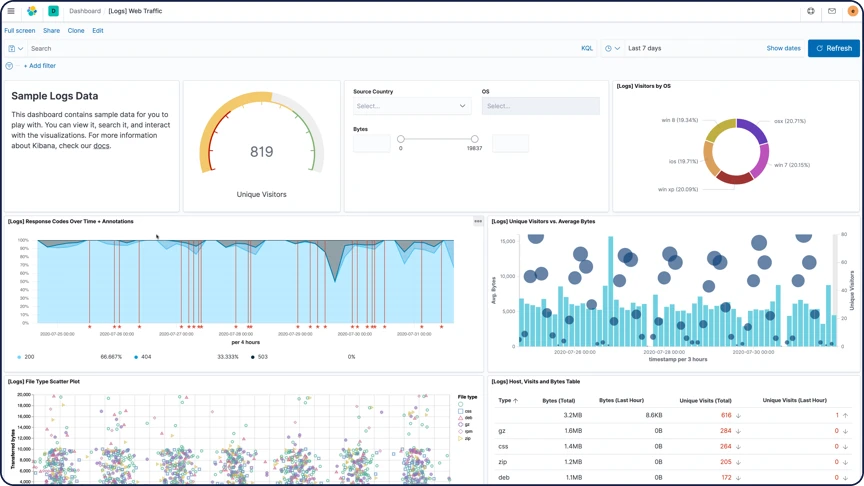
Logs dashboards
Example Filebeat dashboards make it easy for you to explore log data in Kibana. Get started quickly with these preconfigured dashboards, then customize them to meet your needs.
Log rate anomaly detection
Log rate analysis powered by machine learning automatically highlights periods of time where the log rate is outside normal bounds so you can quickly identify and inspect log anomalies.
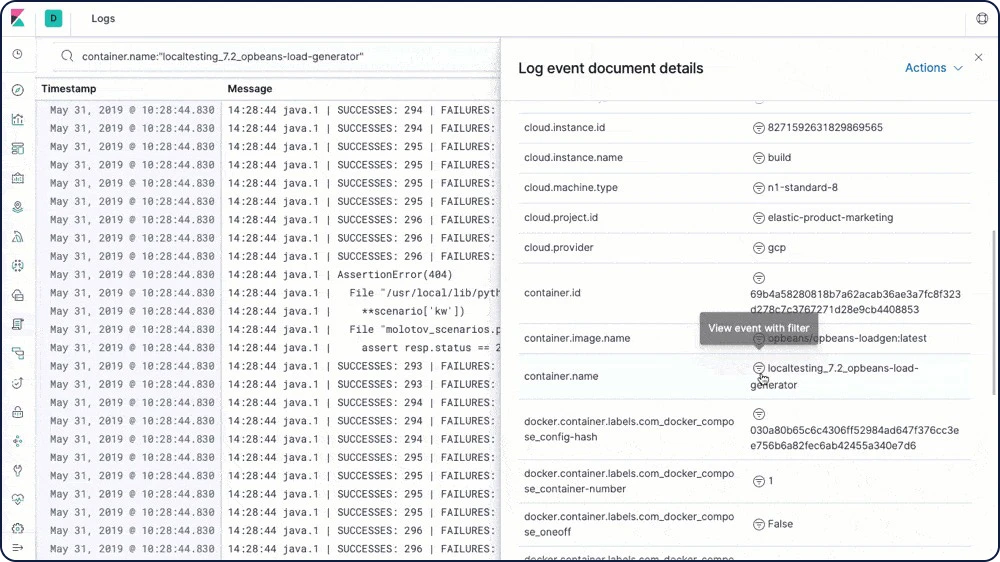
Logs app
The Logs app provides real-time log tailing in a compact, customizable display. The log data is correlated with metrics in the Metrics app, making it easier for you to diagnose problems.
Explore and visualize
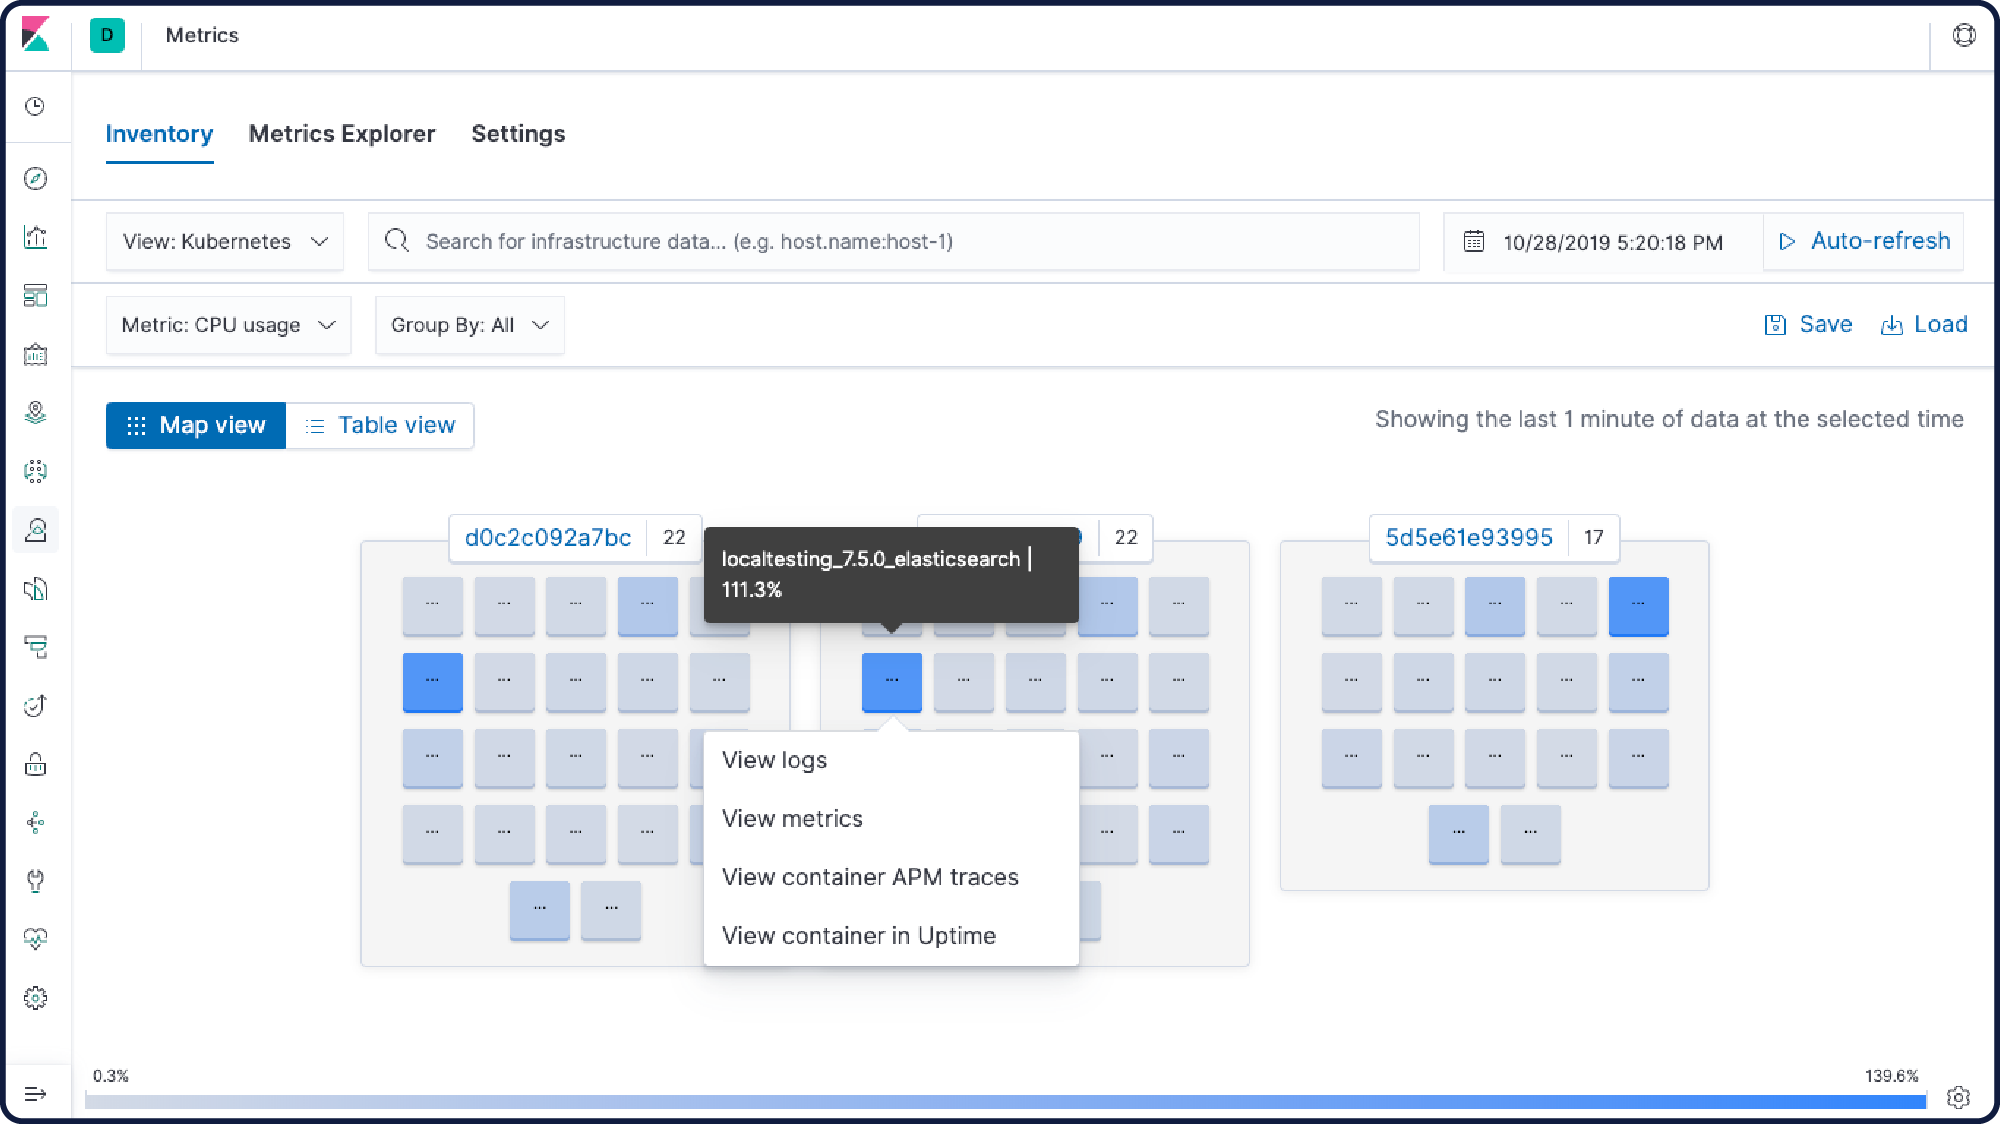
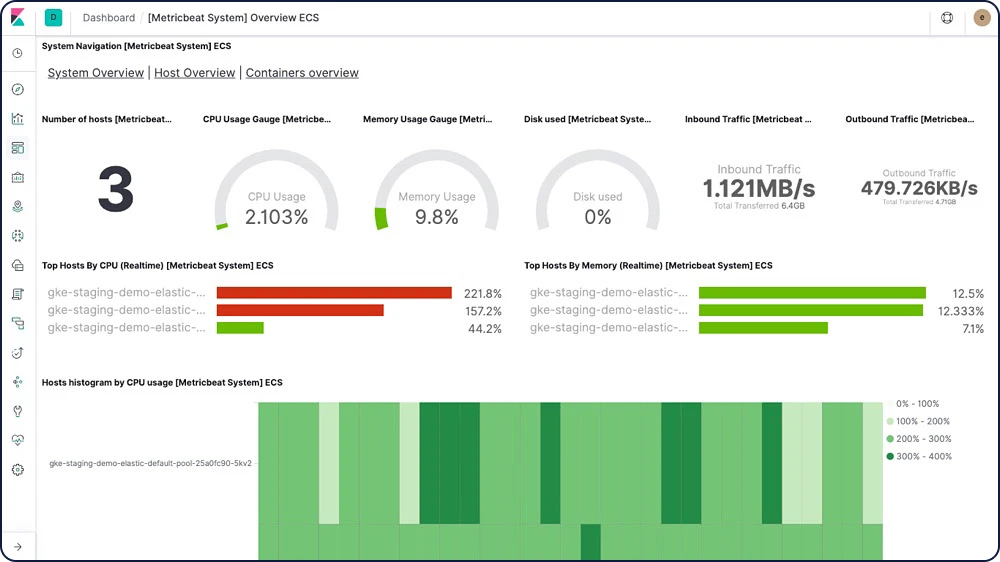
Elastic Metrics
With Elastic Metrics, easily track high-level metrics, like CPU usage, system load, memory usage, and network traffic, to help you assess the overall health of your servers, containers, and services.
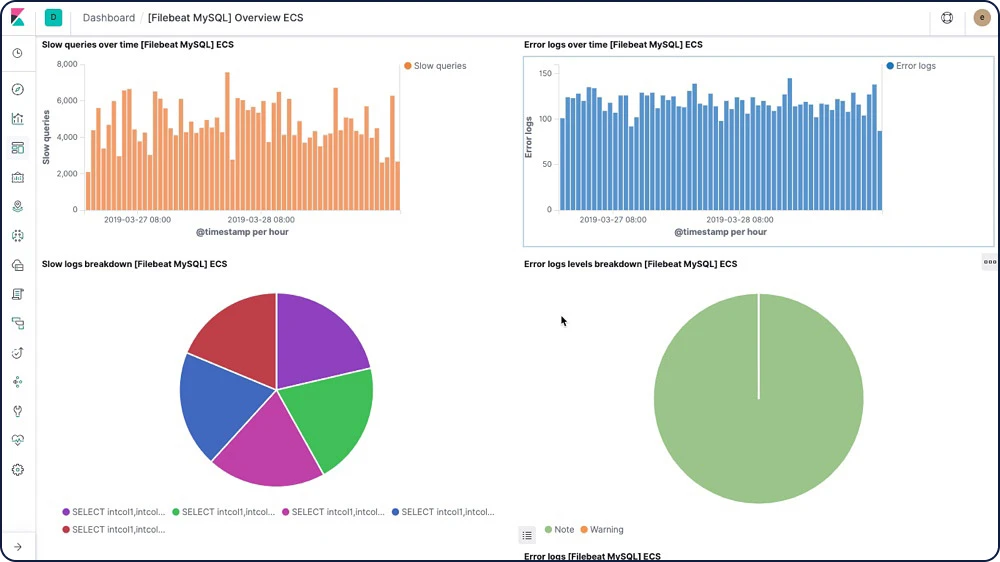
Metric shipper (Metricbeat)
Metricbeat is a lightweight shipper that you can install on your servers to periodically collect metrics from the operating system and from services running on the server. From CPU to memory, Redis to NGINX, Metricbeat is a lightweight way to send system and service statistics.
Metrics dashboards
Example Metricbeat dashboards make it easy for you to start monitoring your servers in Kibana. Get started quickly with these preconfigured dashboards, and then customize them to meet your needs.
Alerting integration for Metrics
Create threshold alerts for your metrics with real-time feedback, directly in the Metrics app in Kibana, and get notified the way that you choose — documents, logs, Slack, simple webhooks, and more.
Machine learning integration for Metrics
Find common infrastructure issues with one-click anomaly detection directly from the Metrics UI.
Metrics app
After you have metrics streaming to Elasticsearch, use the Metrics app in Kibana to monitor them and identify problems in real time.
Explore and visualize
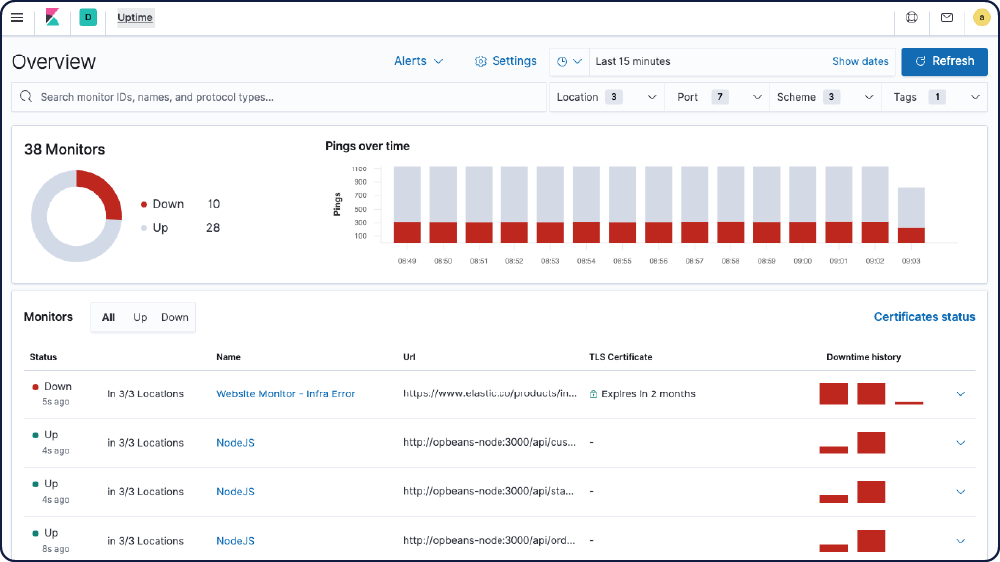
Elastic Uptime
With Elastic Uptime powered by open source Heartbeat, your availability data works in concert with rich context provided by logs, metrics, and APM — making it simpler to connect the dots, correlate activity, and solve problems quickly.
Uptime monitor (Heartbeat)
Heartbeat is a lightweight daemon that you install on a remote server to periodically check the status of your services and determine whether they are available. Heartbeat ingests the server data that will then be displayed in the Uptime dashboard and app in Kibana.
Uptime dashboards
Example Heartbeat dashboards make it easy for you to visualize the status of your services in Kibana. Get started quickly with these preconfigured dashboards, and then customize them to meet your needs.
Alerting integration for Uptime
Easily create threshold-based alerts from your availability data directly in the Uptime app, and get notified the way that you choose -- documents, logs, Slack, simple webhooks, and more.
Certificate monitoring
Check or get notified when your SSL or TLS certificates are expiring and keep your services available directly in the Uptime app.
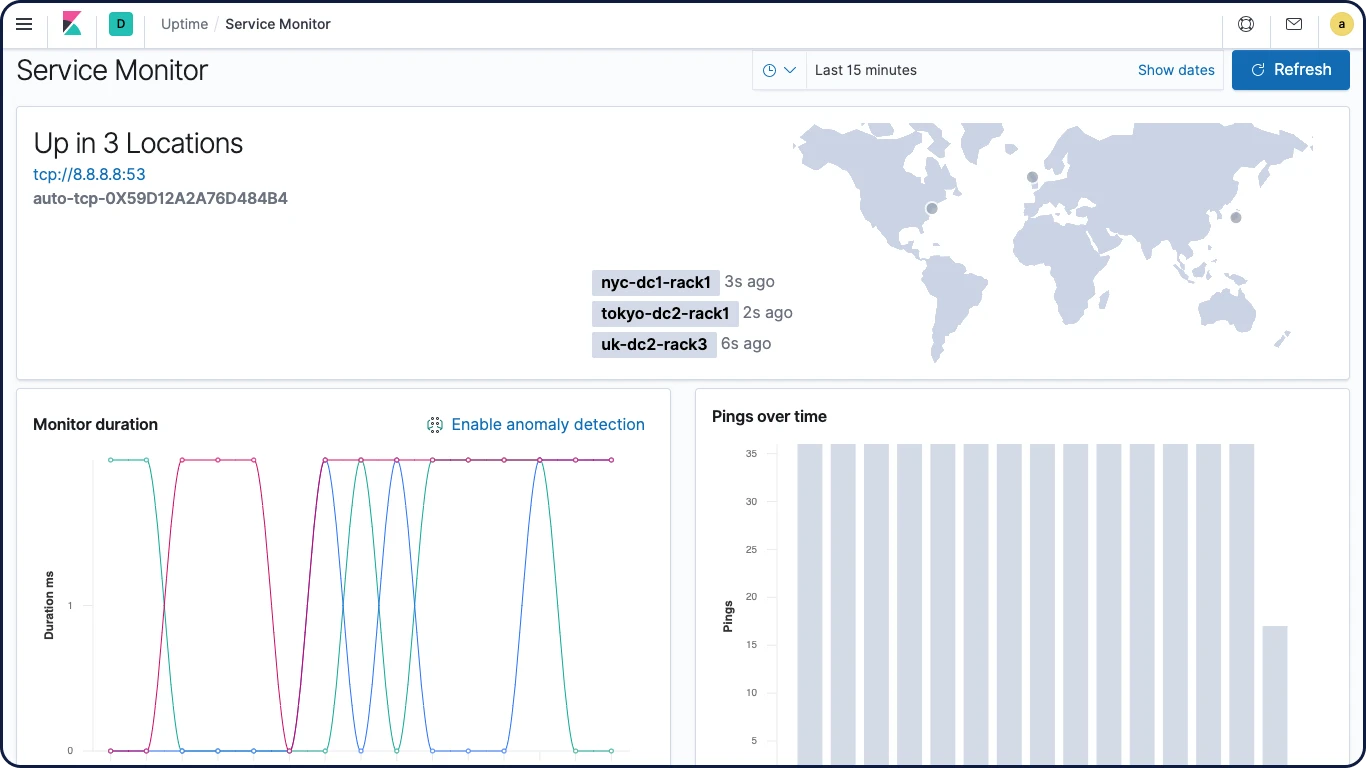
Synthetic monitoring
Simulate the user experience across multi-step journeys — like the checkout flow for an ecommerce store. Capture detailed status info each step of the way to identify problematic areas and create exceptional digital experiences.
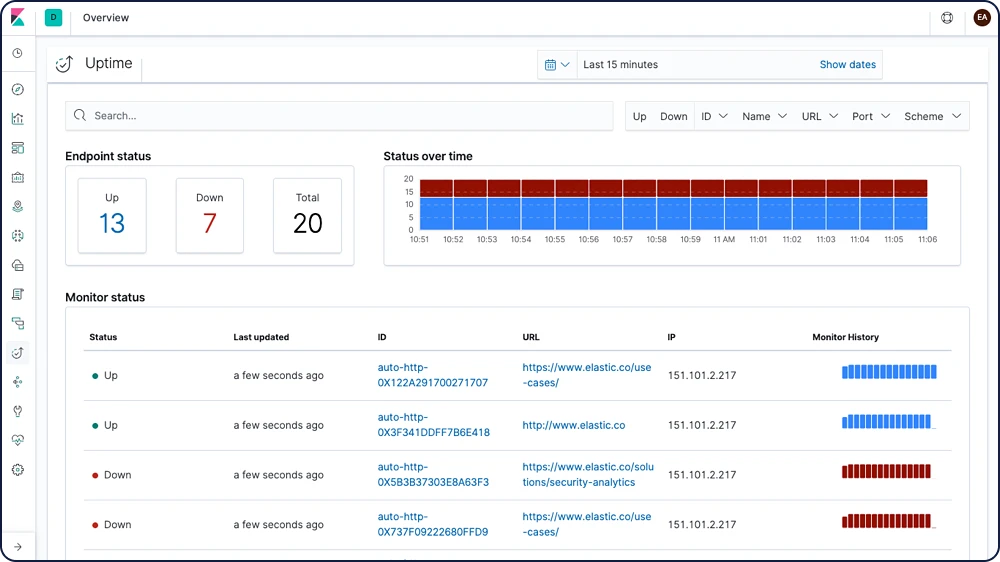
Uptime app
The Uptime app in Kibana is intended to help you quickly identify and diagnose outages and other connectivity issues within your network or environment. Easily monitor hosts, services, websites, APIs, and more from this helpful interface.
Explore and visualize
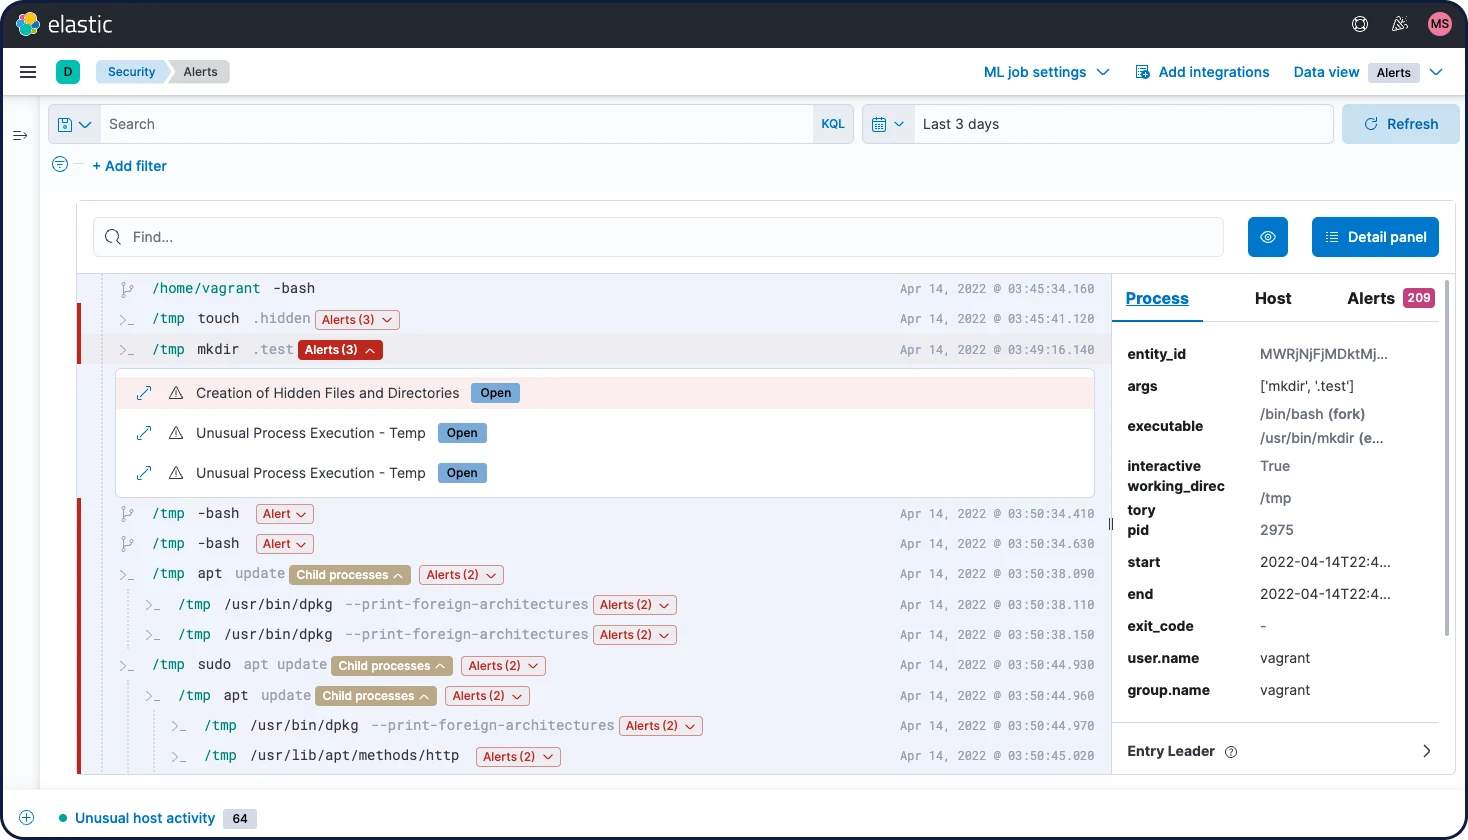
Elastic Security
Elastic Security equips security teams to prevent, detect, and respond to threats. It stops ransomware and malware at the host, automates the detection of threats and anomalies, and streamlines response with intuitive workflows, built-in case management, and integrations with SOAR and ticketing platforms.
Elastic Common Schema
Uniformly analyze data from diverse sources with the Elastic Common Schema (ECS). Detection rules, machine learning jobs, dashboards, and other security content can be applied more broadly, searches can be crafted more narrowly, and field names are easier to remember.
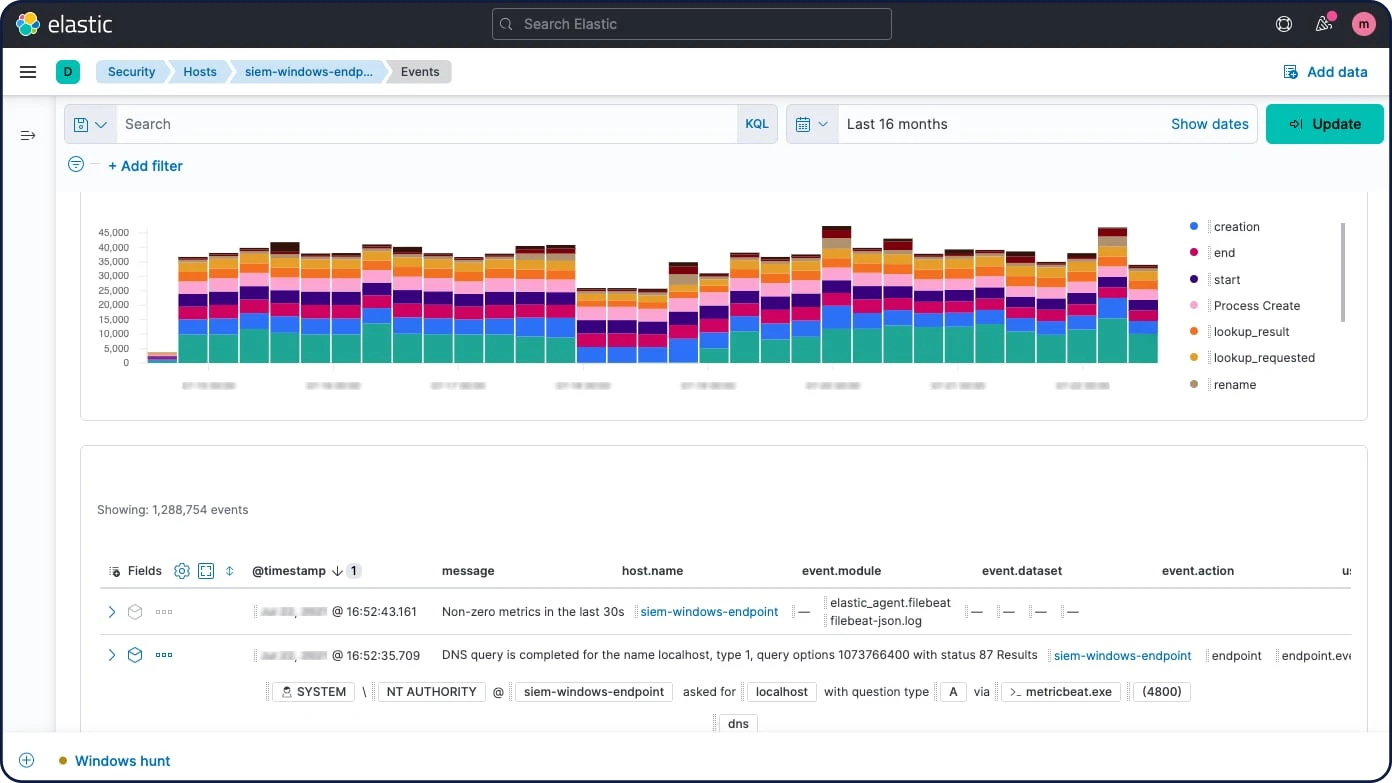
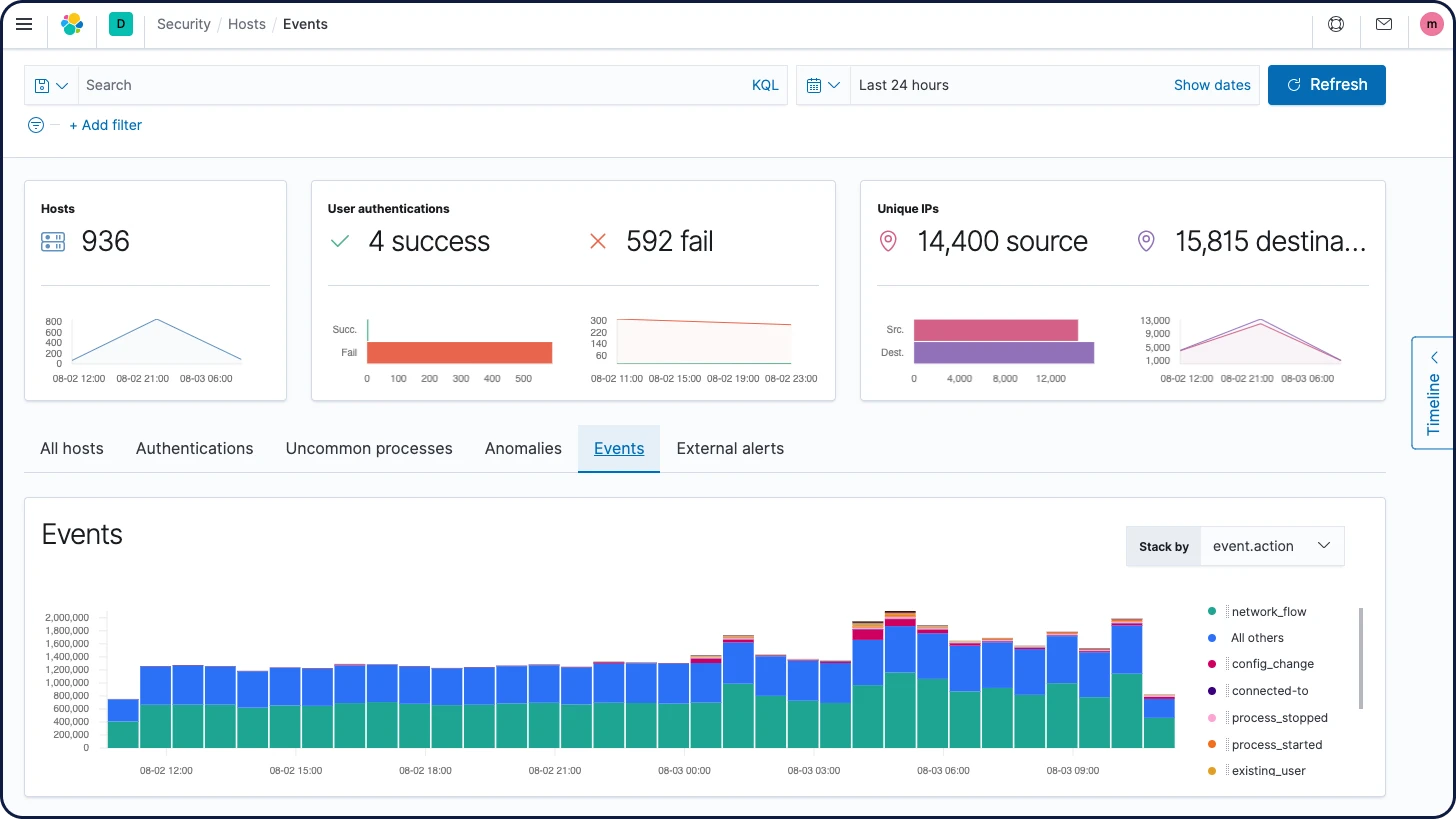
Host security analysis
Elastic Security enables interactive analysis of endpoint data from Elastic Agent and Elastic Beats, plus technologies like Carbon Black, CrowdStrike, and Microsoft Defender for Endpoint. Explore shell activity with Session View and processes with Analyzer.
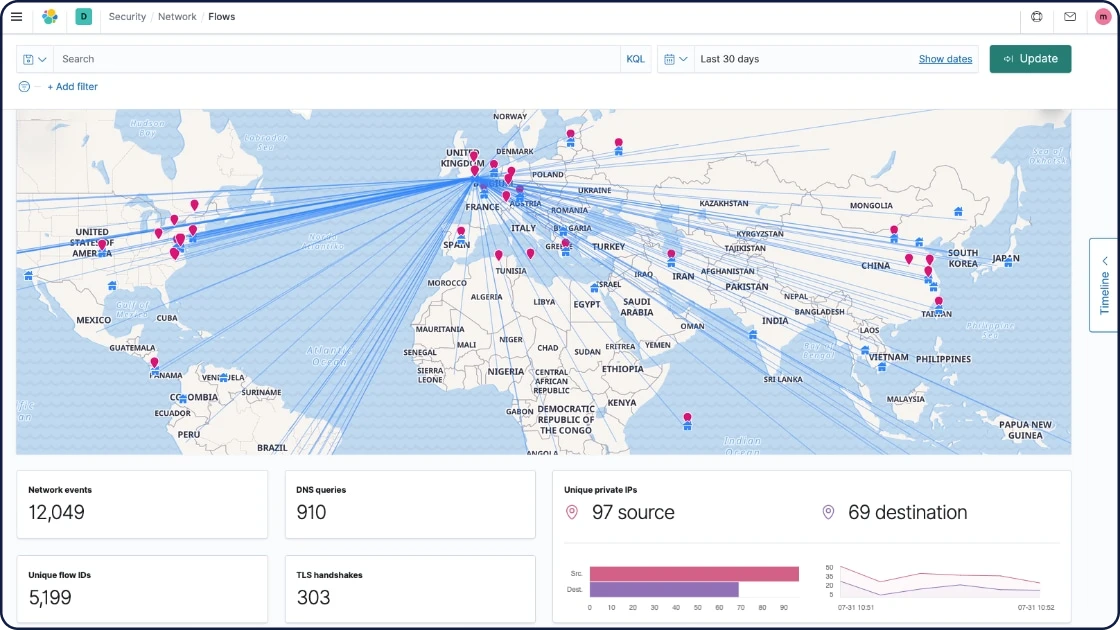
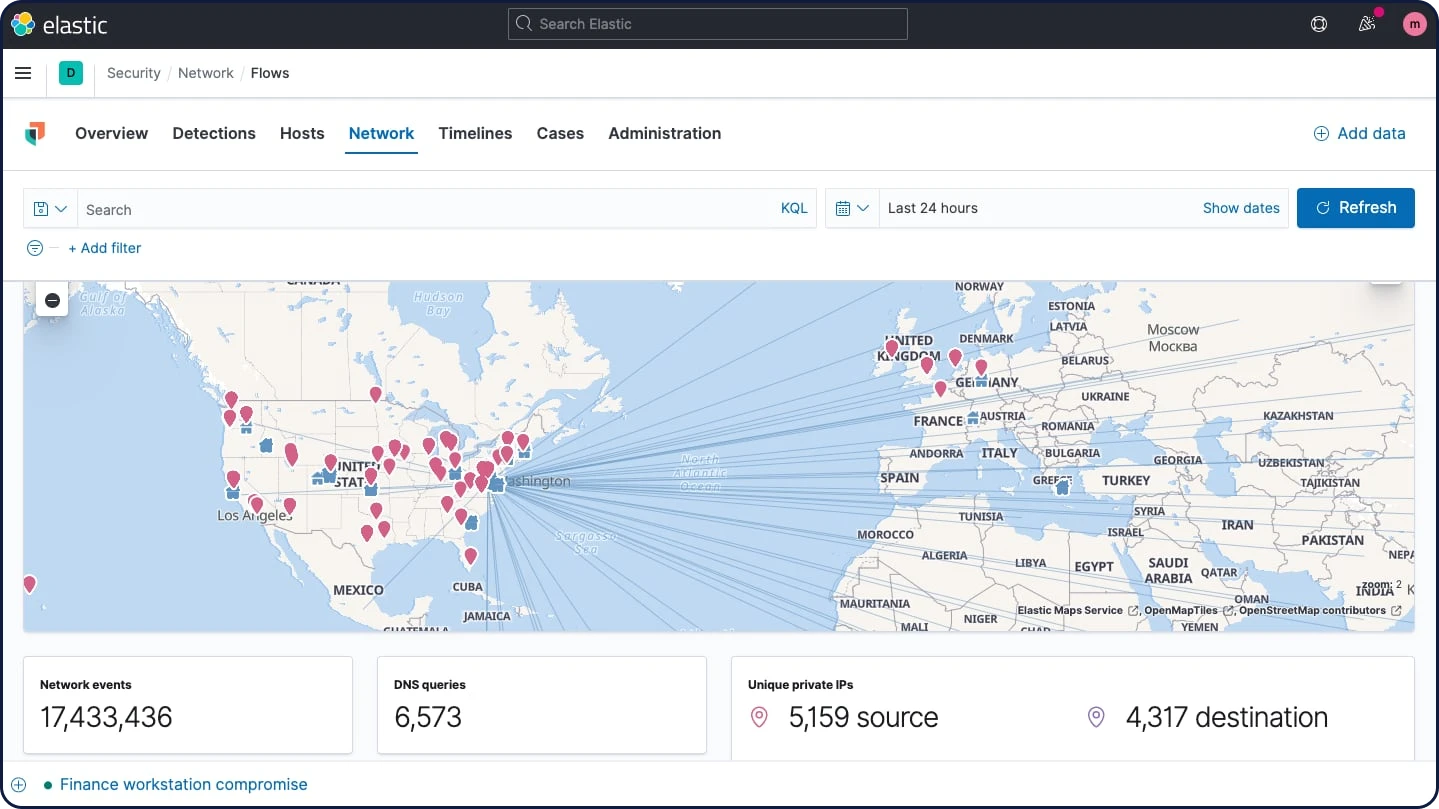
Network security analysis
Elastic Security enables network security monitoring with interactive maps, graphs, event tables, and more. It supports numerous network security solutions, including OSS technologies like Suricata and Zeek, devices from vendors like Cisco ASA, Palo Alto Networks, and Check Point, and cloud services like AWS, Azure, GCP, and Cloudflare.
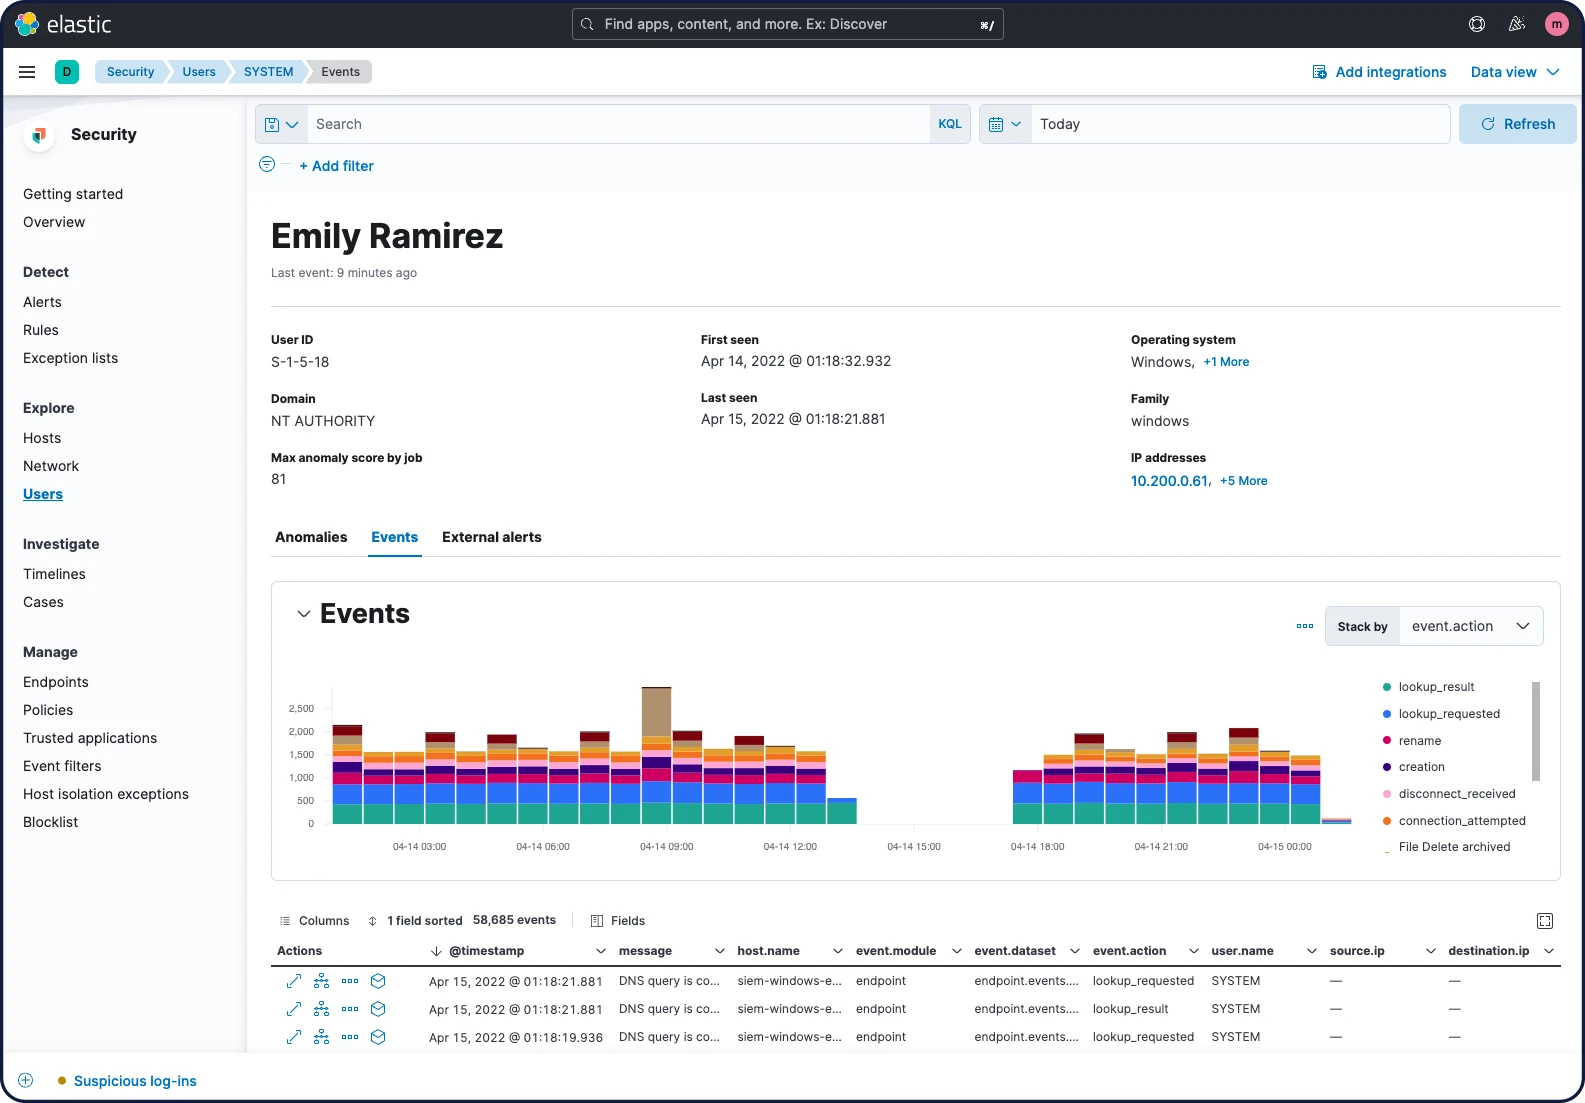
User security analysis
Elastic Security excels with entity analytics. The solution provides visibility into user activity, helping practitioners address insider threats, account takeover, privilege abuse, and related vectors. Environment-wide collection supports security monitoring, with user data presented on curated visualizations and tables. User context is presented within the flow of a hunt or investigation, with further details quickly accessible.
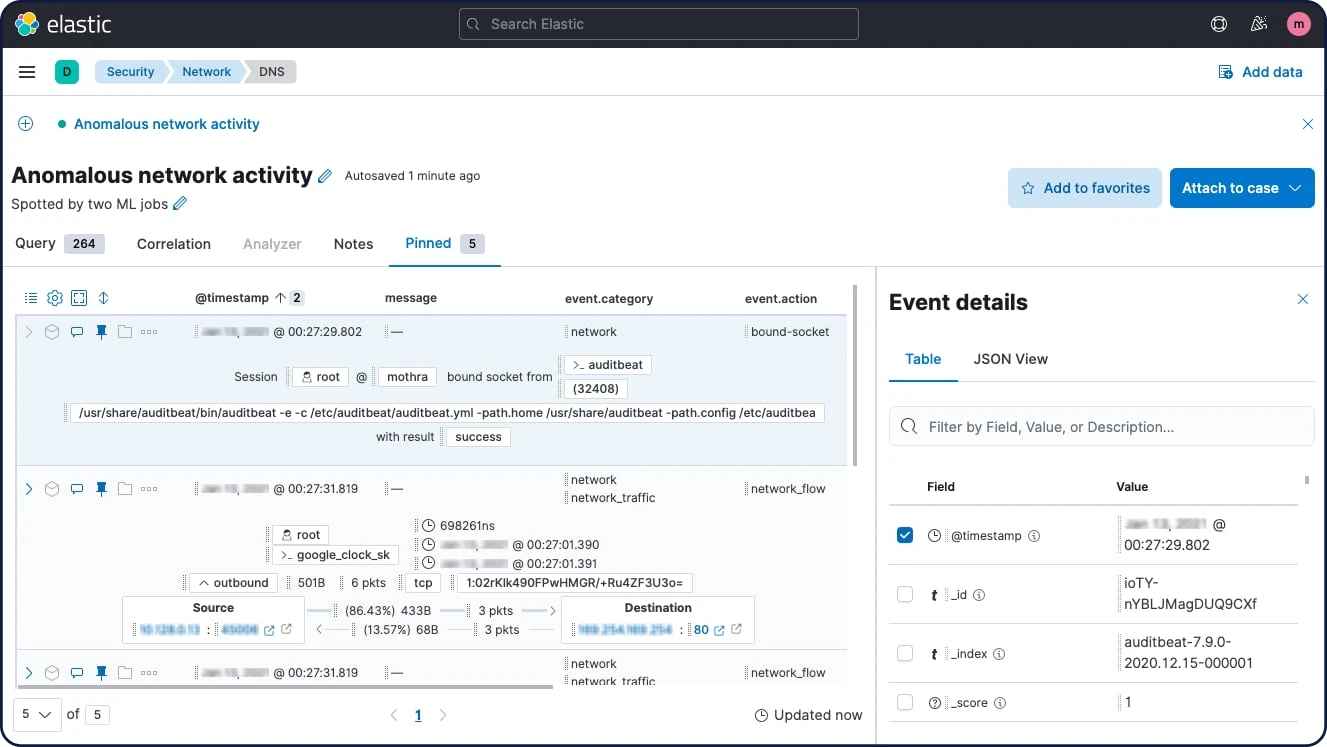
Timeline event explorer
Timeline event explorer lets analysts view, filter, correlate, and annotate events, gather data to reveal the root-cause and scope of attacks, align investigators, and package information for immediate and long-term reference.
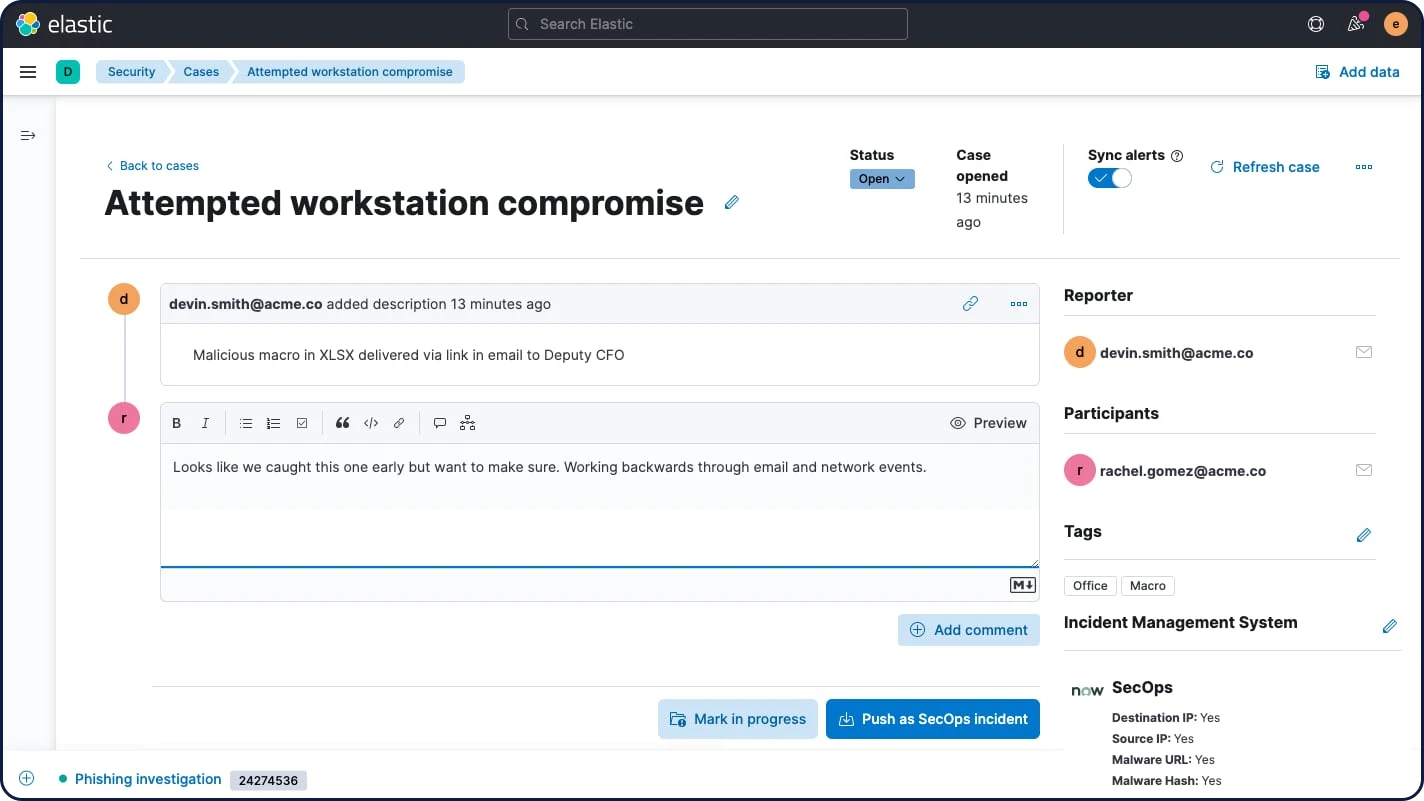
Case management
Built-in case management workflows enhance control over detection and response. Elastic Security allows analysts to easily open, update, tag, comment on, close, and integrate cases with external systems. An open API and prebuilt support for IBM Resilient, Jira, Swimlane, and ServiceNow enable alignment with existing workflows.
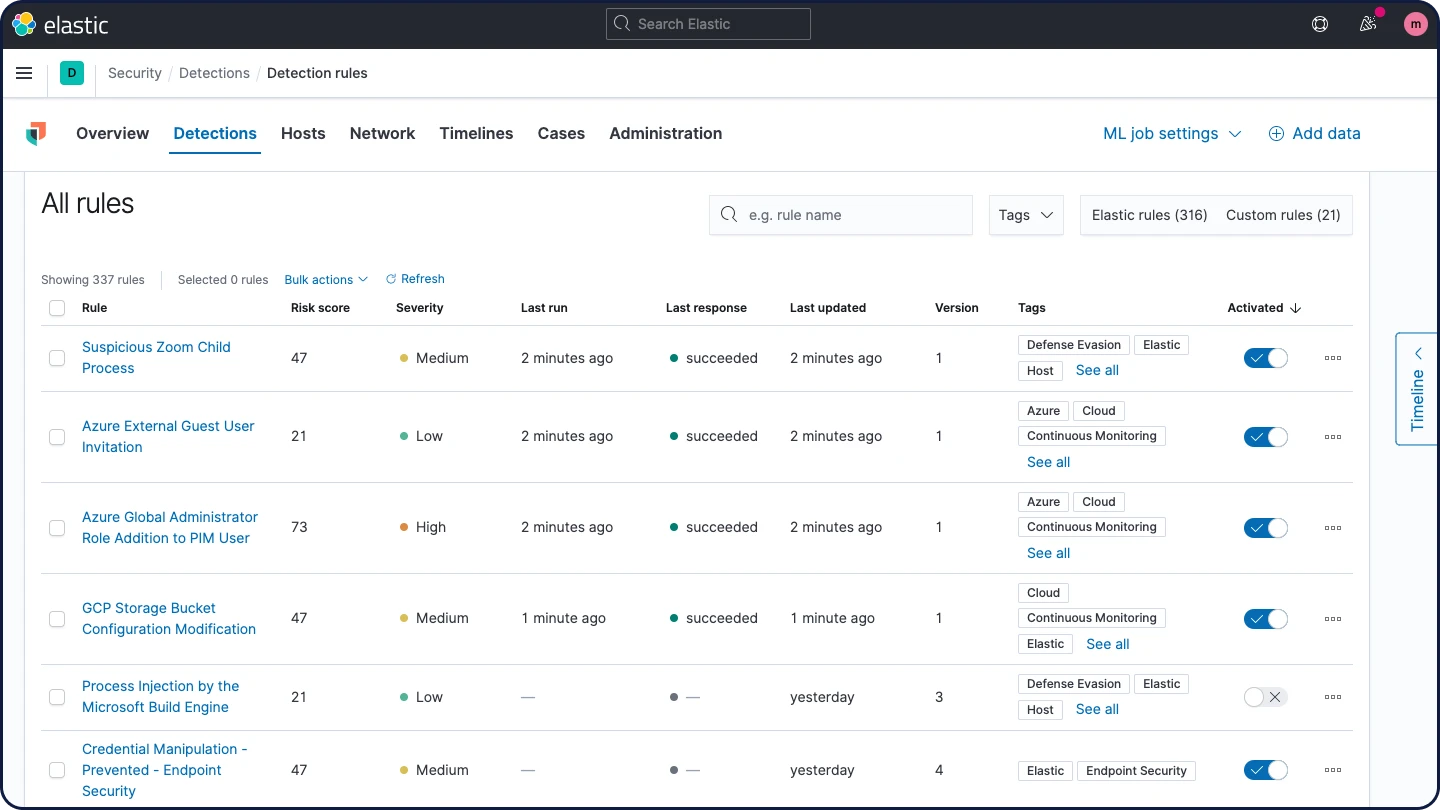
Detection engine
The detection engine performs technique-based threat detection and alerts on high-value anomalies. Prebuilt rules developed and tested by Elastic Security research engineers enable rapid adoption. Custom rules can be created for any data formatted for Elastic Common Schema (ECS).
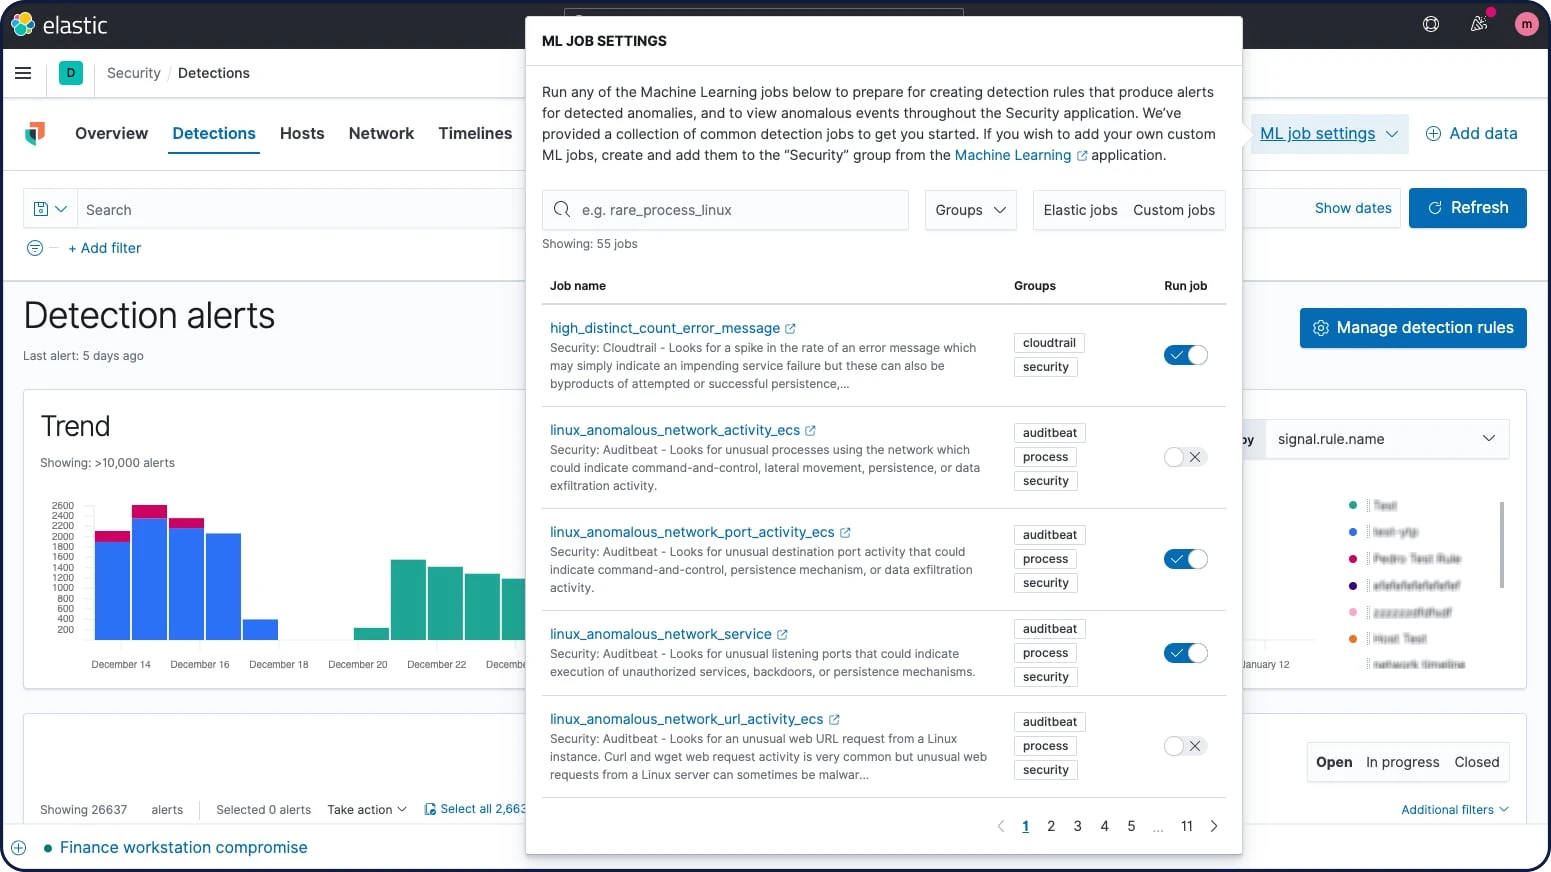
Machine learning anomaly detection
Integrated machine learning automates anomaly detection, enhancing detection and hunting workflows. A portfolio of prebuilt machine learning jobs enables rapid adoption. Alerting and investigation workflows leverage ML results.
Behavioral ransomware prevention
Elastic Security prevents ransomware with behavioral analysis performed on Elastic Agent. The capability stops ransomware attacks on Windows systems by analyzing data from low-level system processes, and is effective across an array of widespread ransomware families.

Malicious behavior protection
Malicious behavior protection on Elastic Agent stops advanced threats at the endpoint, providing a new layer of protection for Linux, Windows, and macOS hosts. Malicious behavior protection buttresses existing malware and ransomware prevention with dynamic prevention of post-execution behavior, stopping advanced threats in their tracks.
Anti-malware
Signatureless malware prevention puts an immediate stop to malicious executables on Linux, Windows, and macOS hosts. The capability is delivered with Elastic Agent, which also collects security data and enables host-based inspection and response. Kibana-based administration streamlines deployment and administration.
Host memory protection
Memory protection on Elastic Agent stops many of the techniques used for process injection via shellcode, stopping sub-techniques such as thread execution hijacking, asynchronous procedure call, process hollowing, and process doppelgänging.
Memory threat protection
Osquery central management
Elastic Security enables users to easily deploy osquery on every endpoint, streamlining hunting and host inspection across Linux, Windows, and macOS hosts. The solution provides direct access to rich host data, retrievable with a prebuilt or custom SQL query for analysis in Elastic Security.
Host-based network activity analysis
Collect network activity from an unlimited number of hosts with Elastic Agent. Analyze it to reveal traffic within and beyond the network perimeter that firewalls can’t see, helping security teams address malicious behavior like watering hole attacks, data exfiltration, and DNS attacks. The Network Packet Analyzer integration includes a free commercial license for Npcap, the widely deployed packet sniffing library for Windows, enabling network visibility on every host, no matter the OS.
Cloud workload session auditing
Secure hybrid cloud workloads and cloud-native applications with a lightweight agent powered by eBPF. Spot runtime threats automatically with prebuilt and custom detection rules and machine learning models. Investigate with a terminal-like view that surfaces rich context.
KSPM data collection and CIS posture findings
Gain visibility into your security posture across multi-cloud environments. Review findings, benchmark findings against CIS controls, and follow remediation guidance to drive rapid improvement.