Filebeat
Lightweight shipper for logs
Whether you’re collecting from security devices, cloud, containers, hosts, or OT, Filebeat helps you keep the simple things simple by offering a lightweight way to forward and centralize logs and files.
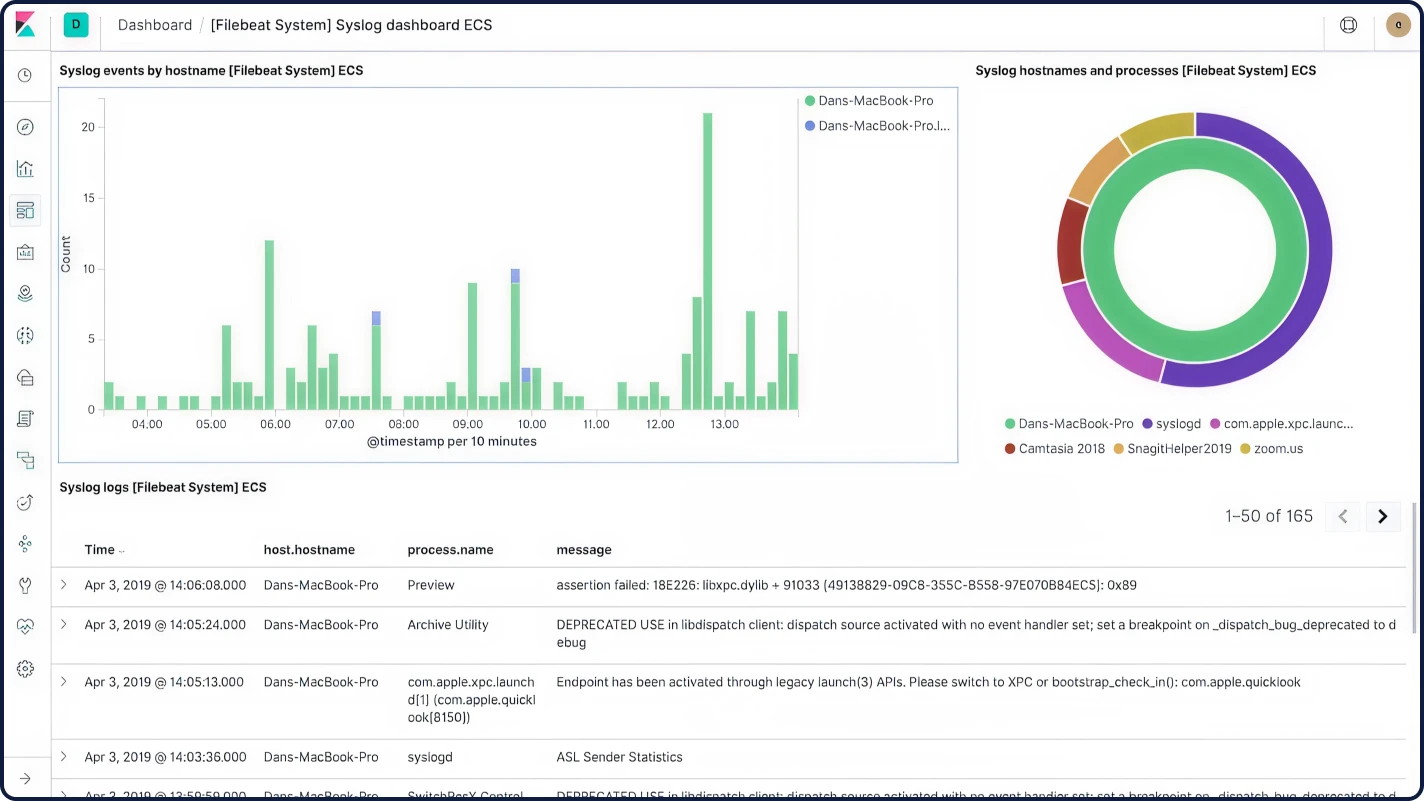
Aggregate, “ tail -f ” & search
After you start Filebeat, open the Logs UI and watch your files being tailed right in Kibana. Use the search bar to filter by service, app, host, datacenter, or other criteria to track down curious behavior across your aggregated logs.
It’s robust and doesn’t miss a beat
In any environment, application downtime is always lurking on the edges. Filebeat reads and forwards log lines and — if interrupted — remembers the location of where it left off when everything is back online.
Filebeat keeps the simple things simple
Filebeat ships with modules for observability and security data sources that simplify the collection, parsing, and visualization of common log formats down to a single command. They achieve this by combining automatic default paths based on your operating system, with Elasticsearch Ingest Node pipeline definitions, and with Kibana dashboards. Plus, a few Filebeat modules ship with preconfigured machine learning jobs.
It’s container- and cloud-ready
Containerizing everything or running in a cloud environment? Container monitoring and cloud monitoring with the Elastic Stack is simple. Deploy Filebeat in a Kubernetes, Docker, or cloud deployment and get all of the log streams — complete with their pod, container, node, VM, host, and other metadata for automatic correlation. Plus, Beats Autodiscover features detect new containers and adaptively monitor them with the appropriate Filebeat modules.
It won’t let you overload your pipeline
Filebeat uses a backpressure-sensitive protocol when sending data to Logstash or Elasticsearch to account for higher volumes of data. If Logstash is busy crunching data, it lets Filebeat know to slow down its read. Once the congestion is resolved, Filebeat will build back up to its original pace and keep on shippin'.

Ship to Elasticsearch or Logstash. Visualize in Kibana.
Filebeat is part of the Elastic Stack, meaning it works seamlessly with Logstash, Elasticsearch, and Kibana. Whether you want to transform or enrich your logs and files with Logstash, fiddle with some analytics in Elasticsearch, or build and share dashboards in Kibana, Filebeat makes it easy to ship your data to where it matters most.