Monitoring
Track what's happening in your Elastic Stack
The Elastic Stack is the engine powering critical systems across your organization, business, and team. Keep a pulse on how it's performing to make sure you're getting the very most out of it. Elastic Stack monitoring features provide you visibility into how your Elastic Stack is running.
Getting started with Elasticsearch: Store, search, and analyze with the open source Elastic Stack.
Watch videoIntro to ELK: Get started with logs, metrics, data ingestion and custom visualizations in Kibana.
Watch videoGetting started with Elastic Cloud: Launch your first deployment.
Learn moreYour Elastic Stack at a glance
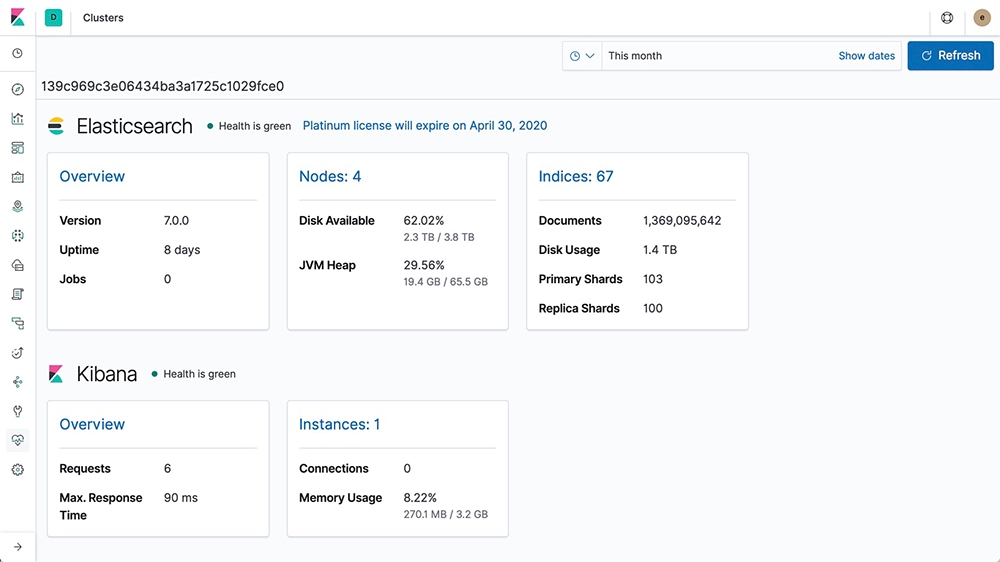
Our monitoring features provide a way to keep a pulse on the performance of Elasticsearch, Kibana, Beats, and Logstash. Its collection of dashboards help you assess their status at various levels providing you with all the information you need to keep your Elastic Stack optimized.
Bonus: Key monitoring features ship for free.
Be proactive with cluster alerts
Automatically be notified to changes in your cluster — cluster state, license expiration and other metrics across Elasticsearch, Kibana, and Logstash — using the power of alerting.
Comes with multi-stack support & analysis
Simplify your workflow with a centralized monitoring cluster to record, track, and compare the health and performance of multiple Elastic Stack deployments from a single place.