What is Kubernetes Monitoring?
Kubernetes monitoring definition
Kubernetes monitoring is a system of reporting that helps DevOps and IT teams identify issues and proactively manage complex Kubernetes clusters. Effective Kubernetes monitoring allows for real-time management of your entire containerized infrastructure. It tracks uptime and cluster resource utilizations like memory, CPU, and storage. It also tracks cluster component interactions.
Kubernetes monitoring allows cluster operators to monitor functionality. It reports when the number of pods required isn’t running, when resource utilization approaches critical limits, and when a pod or node cannot join a cluster due to a failure or configuration error.
Kubernetes monitoring gives you insight into your cluster’s internal health, resource counts, and performance metrics. It can also enable you to quickly discover and resolve issues through proactive alerts and machine learning-based anomaly detection. Learn more about how the right Kubernetes monitoring tool can help you understand the status and health of your Kubernetes clusters — and applications running on them — by viewing logs, metrics, and traces they generate through a unified lens.
What is Kubernetes?
Kubernetes (K8s) is an open-source container orchestration system for automating software deployment, scaling, and managing containerized applications. Originally developed by Google in 2014, the project is now maintained by Cloud Native Computing Foundation (CNCF). Kubernetes eliminates many of the manual processes involved in managing containerized applications. Container orchestration combines individual containers into a cohesive, coordinated whole.
Kubernetes can be deployed on a variety of cloud platforms, as well as self-managed systems, to make IT and DevOps teams more efficient. Many cloud service providers, such as AWS, Google, and Azure, additionally provide some form of managed Kubernetes services to their users. By orchestrating containers across multiple hosts, Kubernetes allows you to:
- Maximize the resources needed to run apps
- Automate application deployments and updates
- Rapidly scale containerized applications
- Manage services to guarantee applications are running as intended
Why is monitoring Kubernetes important?
Kubernetes monitoring involves many smaller components, including hosts, containers, containerized apps, and your Kubernetes platform itself. When issues arise, it can be difficult to pinpoint causes. Proper Kubernetes monitoring allows you to see where problems are happening — or are about to happen — and take action.
Kubernetes monitoring solutions may also provide actionable reporting and insights into clusters, deployments, pods, nodes, and containers. You can also configure alerts to ensure your teams are able to respond quickly to any security or performance events. The data gained allows you to optimize the health, performance, and security configurations of your clusters. This leads to resource utilization and reduced costs.
Kubernetes monitoring allows you to:
- Ensure resources are consumed optimally by teams or applications
- Automatically utilize new resources when a new node joins a cluster
- Redeploy workloads to available nodes when hosts go down
- Provisioning updates and rollbacks more efficiently
Kubernetes monitoring methods
To monitor Kubernetes you need to have a:
- Metrics server running in the cluster
- Kube-state-metrics turned on
- Collection mechanism deployed
- Kubernetes monitoring tool that can handle Kubernetes metrics and logs
To get full visibility into your entire environment, a comprehensive observability tool can monitor Kubernetes data as well as application traces, metrics, and logs. - Agent deployed to collect metrics and logs
Many Kubernetes monitoring solutions use a DaemonSet approach because they’re relatively easy to provision. A DaemonSet is a specialized pod that ensures that a copy of its workload runs on all nodes within the cluster. Developers can create DaemonSets that run a monitoring agent on each node in a cluster to collect performance metrics.
What are key metrics in Kubernetes monitoring use cases?
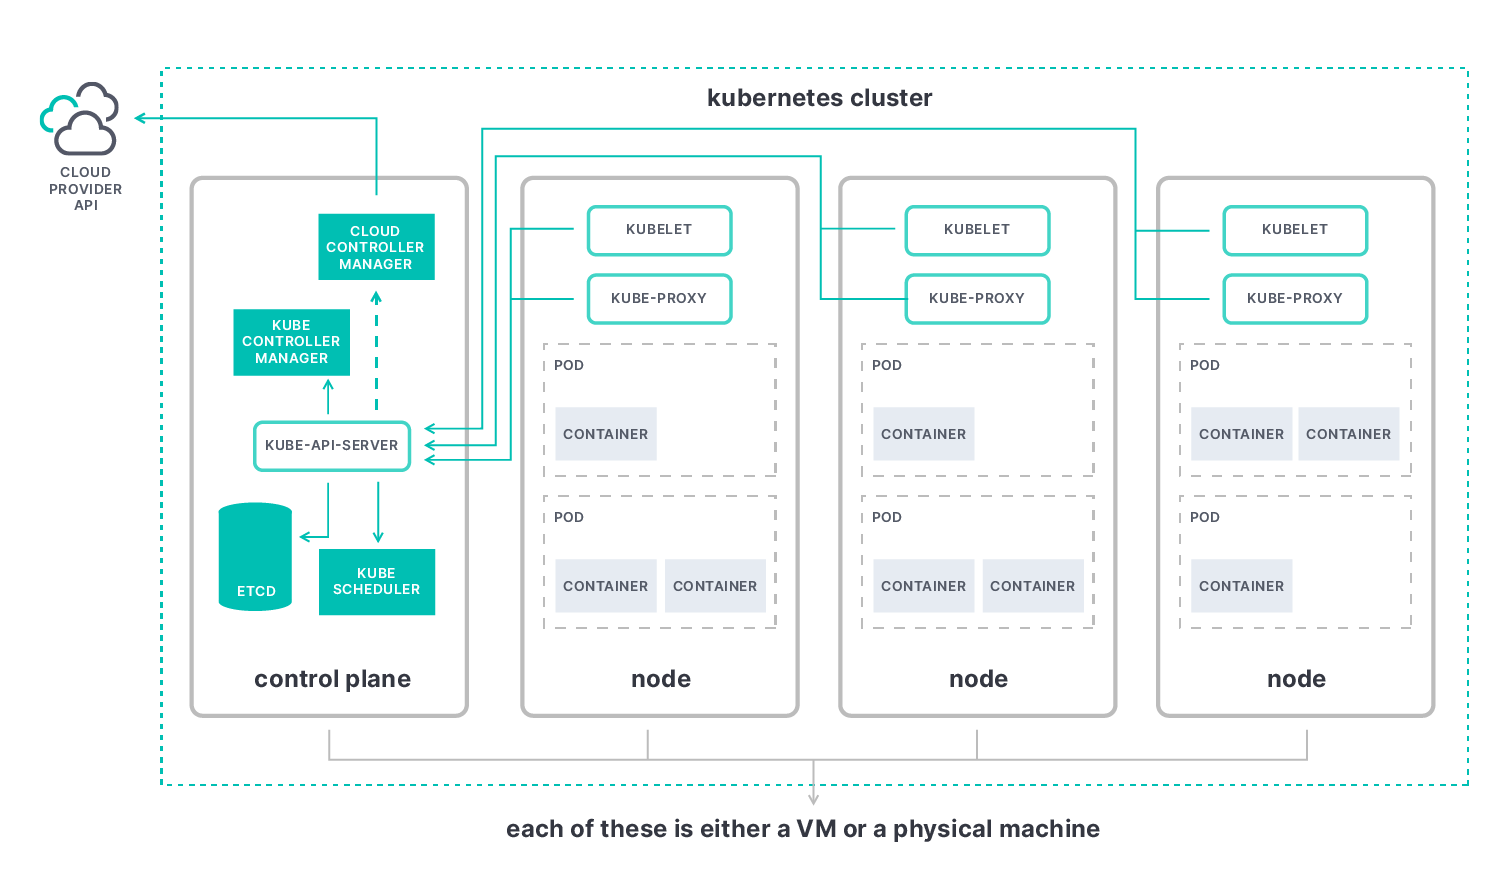
The key metrics in Kubernetes monitoring are the control plane, nodes, pods, and containers.
- Kubernetes control plane metrics help you understand the cluster’s performance as a whole. At its core is the kube-apiserver, which allows you to observe elements such as:
- Etcd: A consistent and highly-available key value store used as Kubernetes' backing store for all cluster data.
- Kube-scheduler: A scheduling process that decides where to place new pods by adding them to a queue to assess each available node before binding them to an appropriate one.
- Kube-controller-manager: A component that combines all controllers into a single process and runs them together to reduce complexity.
- Cloud-controller-manager: The controller that interacts with the cloud provider resources and allows you to link your cluster into the cloud provider's API.
- Kubernetes node metrics monitor the performance of your entire Kubernetes cluster. This includes the number of resources used, the number of applications running on each node, and whether your nodes are working properly. Look for node resource usage metrics like disk and memory utilization, CPU, and network bandwidth. Each node contains the following elements:
- Kubelet: An agent that runs on each node in the cluster. It makes sure that containers are running in a pod.
- Kube-proxy: A network proxy that runs on each node in your cluster, implementing part of the Kubernetes Service concept.
- Container runtime: A software that runs containers, also known as a container engine.
- Kubernetes container metrics allow you to assess where you are compared to the resource limits you’ve configured, including metrics for container CPU usage, container memory utilization, and network usage.
- Kubernetes pod metrics can tell you if all the pods in a deployment are running properly. Application metrics tell you about the performance and availability of applications running inside your Kubernetes pods, including elements like uptime and response time, responsiveness, and latency.
Kubernetes monitoring challenges
Migrating traditional applications to Kubernetes can be time-consuming. Though Kubernetes can simplify application deployment in containers and across clouds, its complexity brings its own set of challenges.
Kubernetes container orchestration offers dynamic automation power. Therefore, it requires equally dynamic monitoring systems to inspect individual components and enable alerts. One of the unique monitoring challenges posed by applications running in dynamic containerized environments is their complexity. How do you diagnose and resolve issues with hundreds of microservices on thousands of containers, running in ephemeral and disposable pods?
Kubernetes monitoring best practices
Kubernetes monitoring best practices are consistent whether your nodes are deployed in the same location, across clouds, or in a hybrid cloud. Metric collection should happen the same way across the entire cluster. Here are a few helpful best practices to consider in Kubernetes monitoring:
- Use namespaces to organize your cluster, simplify container management, and minimize risk.
- Upgrade to the latest version of Kubernetes for new features, bug fixes, and security patches.
- Make sense of Kubernetes alerts by setting up automated monitoring.
- Set up role-based access control (RBAC) to manage permissions and access to users and service accounts.
- Set up push notifications to cluster administrators and define the teams responsible for resolving specific issues.
- Use labels to organize your clusters and define and manage objects.
- Reduce errors by setting up a streamlined Git-based workflow.
The most successful Kubernetes monitoring solutions meet the following requirements:
- Monitor all layers of your technology stack. All the host systems — Kubernetes core components, nodes, pods, and containers within the cluster — and all of the applications and services should be tracked.
- Automatically detect and monitor services as they appear dynamically.
- Provide a way to collect and correlate data so that you can group and explore related metrics, logs, traces, and other observability data.
- Integrate with open standards, like Prometheus and OpenTelemetry, to gather additional metrics.
Here are some best practices for observing and securing application and service workflows on Kubernetes using Elasticsearch and OpenTelemetry.
Kubernetes vs. Docker
Kubernetes is different from Docker because it operates containerized applications at scale. Docker is a set of software development tools that allow you to build, share, and run individual containers.
Docker employs a client-server architecture with simple commands and automation through a single API. It provides an easy way to package and distribute containerized applications.
Container images built with Docker can run on a platform that supports containers, like Kubernetes or Docker Swarm. Kubernetes is better than Docker for running, managing, scheduling, and orchestrating vast volumes of containers across multiple servers and clusters. Kubernetes is favored by most larger businesses to monitor their health and efficiently balance loads.
Crucially, Kubernetes comes with an API and command line tool that allows you to automate operations. Kubectl greatly simplifies container management. Kubernetes is a platform for running and managing containers from many container runtimes, including Docker container runtimes. The ability to automatically manage a range of elements makes Kubernetes particularly flexible. Its reliability saves IT teams time, streamlining your overall workflow.
Kubernetes monitoring dashboard
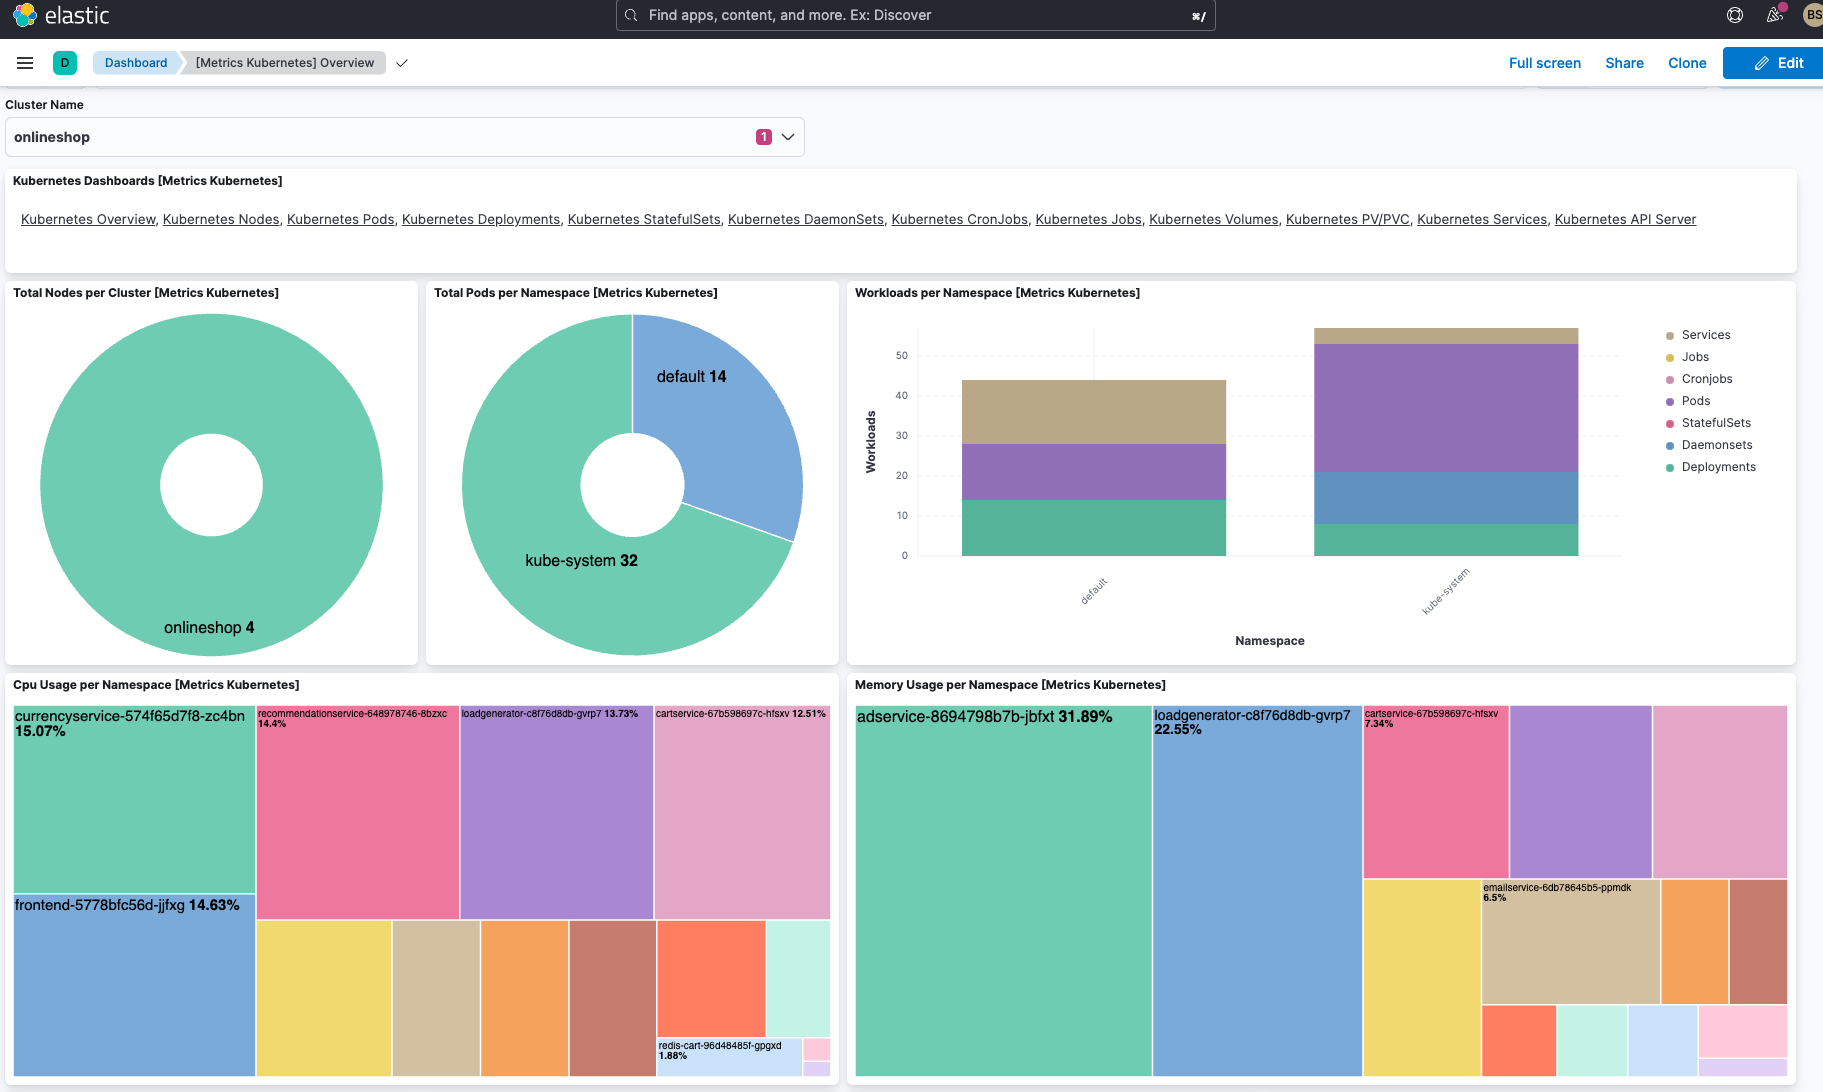
Web-based Kubernetes has a straightforward dashboard that offers an overview of resources and nodes both individually and across clusters. It is a simple way to deploy containerized applications, manage resources, and troubleshoot.
Elastic's out-of-the-box dashboard, shown below, includes all of the cluster's namespaces and defined storage classes. An overview listing all the nodes, namespaces, and persistent storage volumes also lives there. It’s complete with detailed, aggregated node metrics.
You can see persistent volume claims for each clustered application and a complete view of all Kubernetes resources running in the cluster. It also displays every application running in a selected namespace, current pod memory usage, and the number of ready pods for a deployment or ReplicaSet.
Monitoring Kubernetes with Elastic
With Elastic Observability, you can bring logs, metrics, and traces from your Kubernetes cluster and the workloads running on it into one unified platform. This allows you to effectively identify issues with your application services. Metrics and logs from Kubernetes clusters can be used with Elastic's machine learning-based anomaly detection to reduce your time analyzing data.
Elastic's Kubernetes monitoring solution gives you real-time visibility into your Kubernetes ecosystem with an unrivaled set of features. Built on the Elastic Stack, the observability solution allows you to deploy and operate your Kubernetes architectures seamlessly. By unifying your logs, metrics, and APM traces at scale in a single view, you can effectively govern the complexity of highly distributed cloud-native applications. You also get actionable observability for your cloud-native tech stack and cloud monitoring. This enables you to proactively detect and resolve issues in sprawling hybrid and multi-cloud ecosystems.
Kubernetes monitoring glossary
Here are a few key Kubernetes terms for your reference.
Clusters
A set of worker machines, called nodes, that run containerized applications. Every cluster has at least one worker node.
Node
A node is a worker machine in Kubernetes.
- Master (node)
Legacy term, used as a synonym for nodes hosting the control plane. - Worker (node)
Worker nodes host the Pods that are the components of the application workload.
Pod
The smallest and simplest Kubernetes object. A Pod represents a set of running containers on your cluster
Container
A lightweight and portable executable image that contains software and all of its dependencies
Controller
In Kubernetes, controllers are control loops that watch the state of your cluster, then make or request changes where needed. Each controller tries to move the current cluster state closer to the desired state.
Kubelet
An agent that runs on each node in the cluster. It makes sure that containers are running in a Pod.
Kube-proxy
A network proxy that runs on each node in your cluster, implementing part of the Kubernetes Service concept.
Etcd
A consistent and highly-available key value store used as Kubernetes' backing store for all cluster data.
Ingress
An API object that manages external access to the services in a cluster, typically HTTP. Ingress may provide load balancing, SSL termination, and name-based virtual hosting.