Kubernetes monitoring at scale
Get real-time visibility into your Kubernetes ecosystem across EKS, GKE, AKS, on-prem, and air-gapped environments. Elastic pairs Kubernetes monitoring with the industry's richest log analytics and fastest metrics engine — with full-stack observability that’s AI-driven, scalable, and open by design.
Kubernetes monitoring everywhere you already work
Dashboards, alerts, SLOs, ML jobs, agent skills for AI-led investigations and remediation, and an MCP app — ready the moment you connect. Agentic AI identifies anomalies, investigates incidents, and automates remediation so you can plan capacity and resolve issues faster.

High-cardinality performance at a fraction of the cost
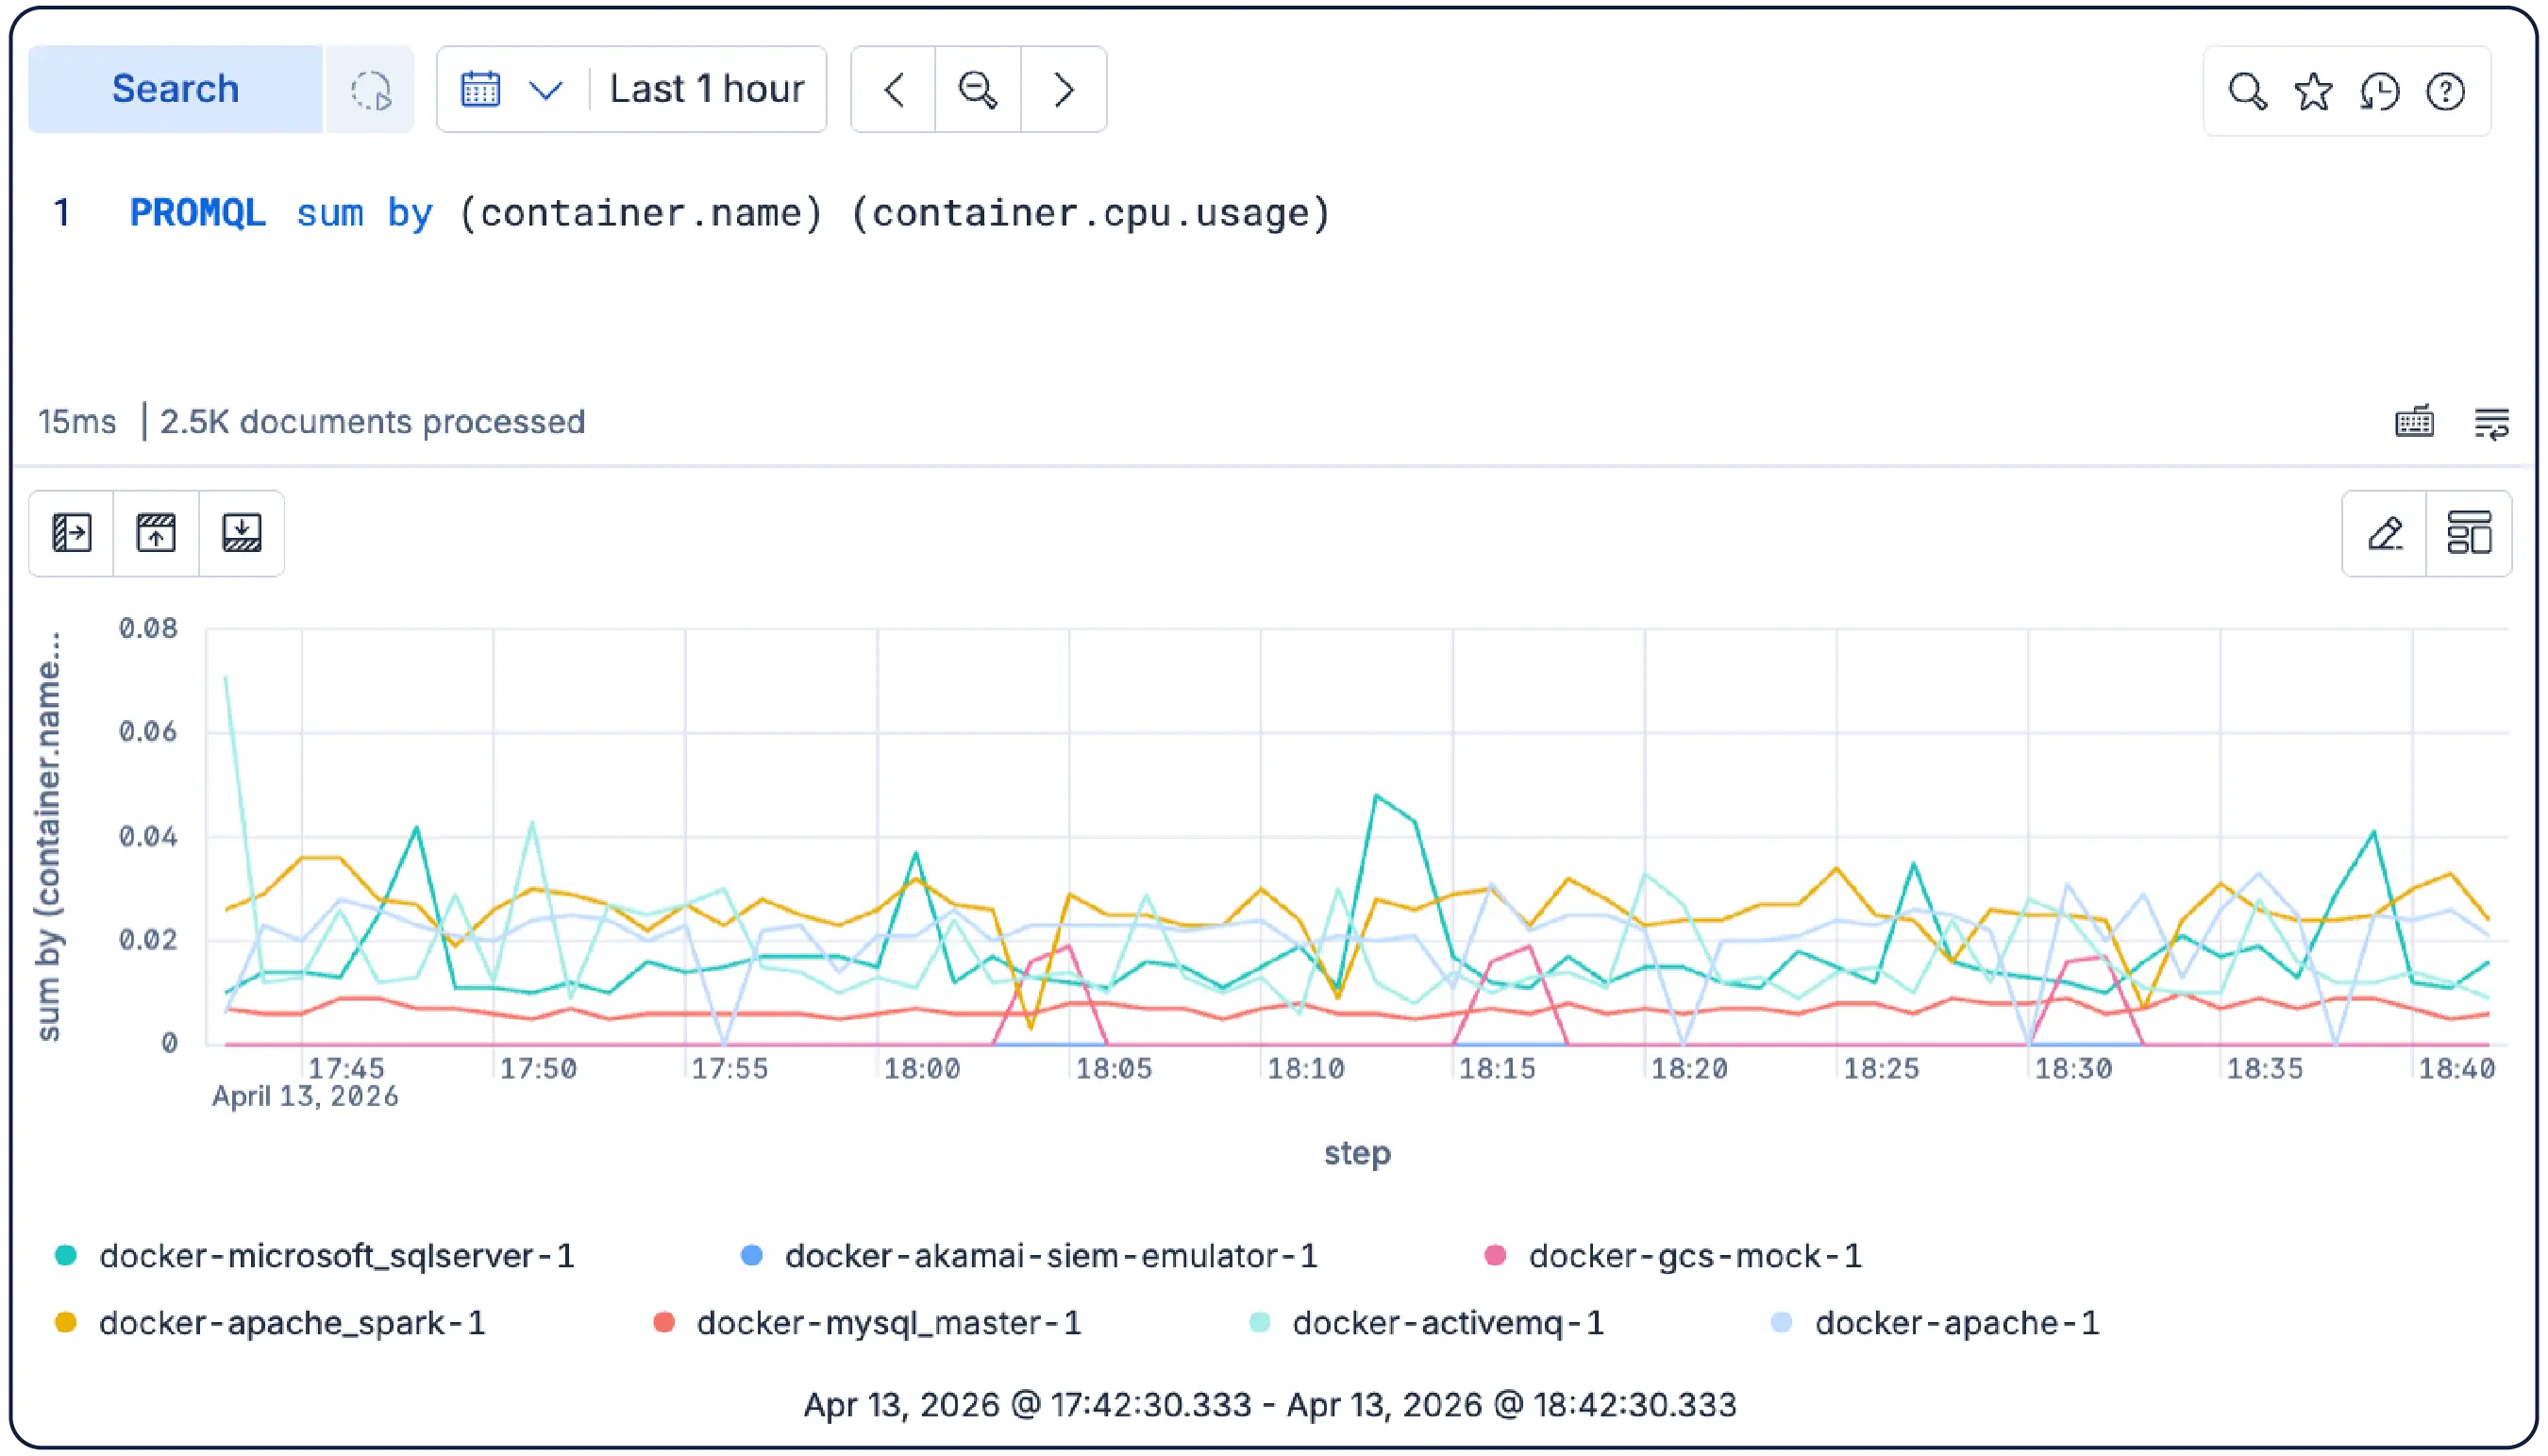
Elastic Observability eliminates the two reasons SREs are looking for a better infrastructure monitoring solution: Datadog's custom metric bill, and the manual correlation work that Grafana's fragmented stack forces during every incident. Because we're OpenTelemetry-first and Prometheus-native, you can keep the workflows you love without sacrificing performance or retention.


Kubernetes monitoring in action
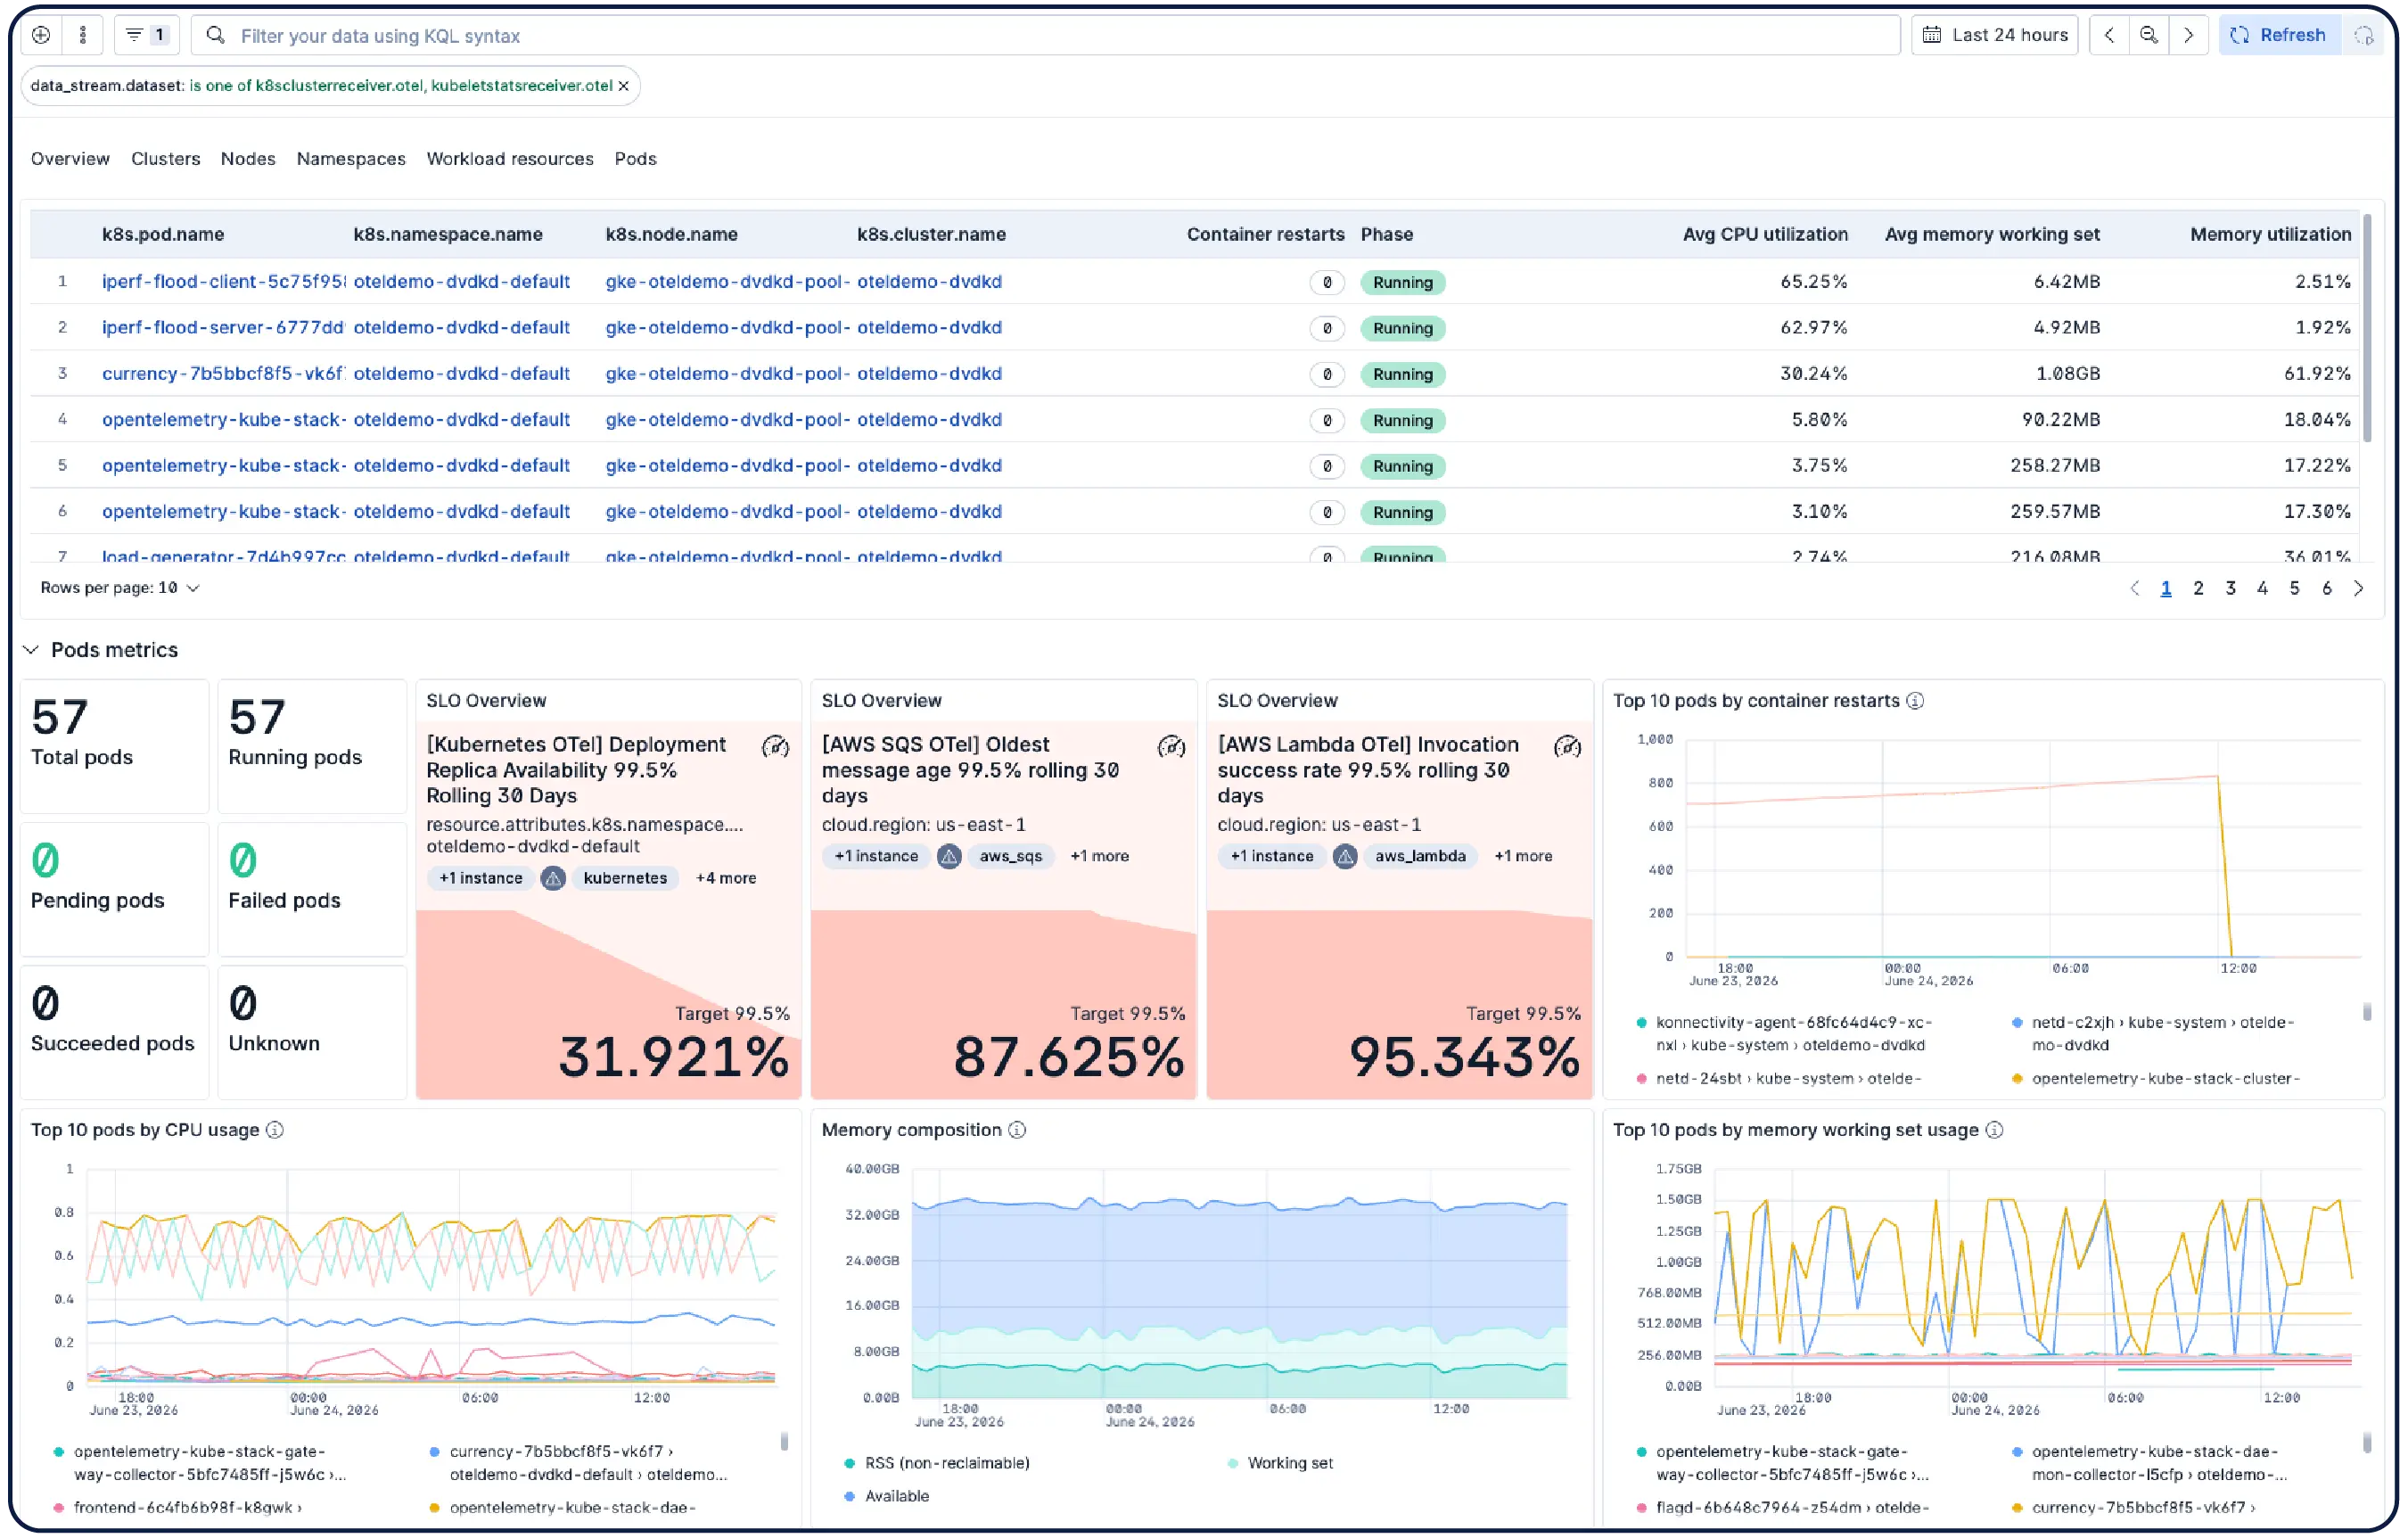
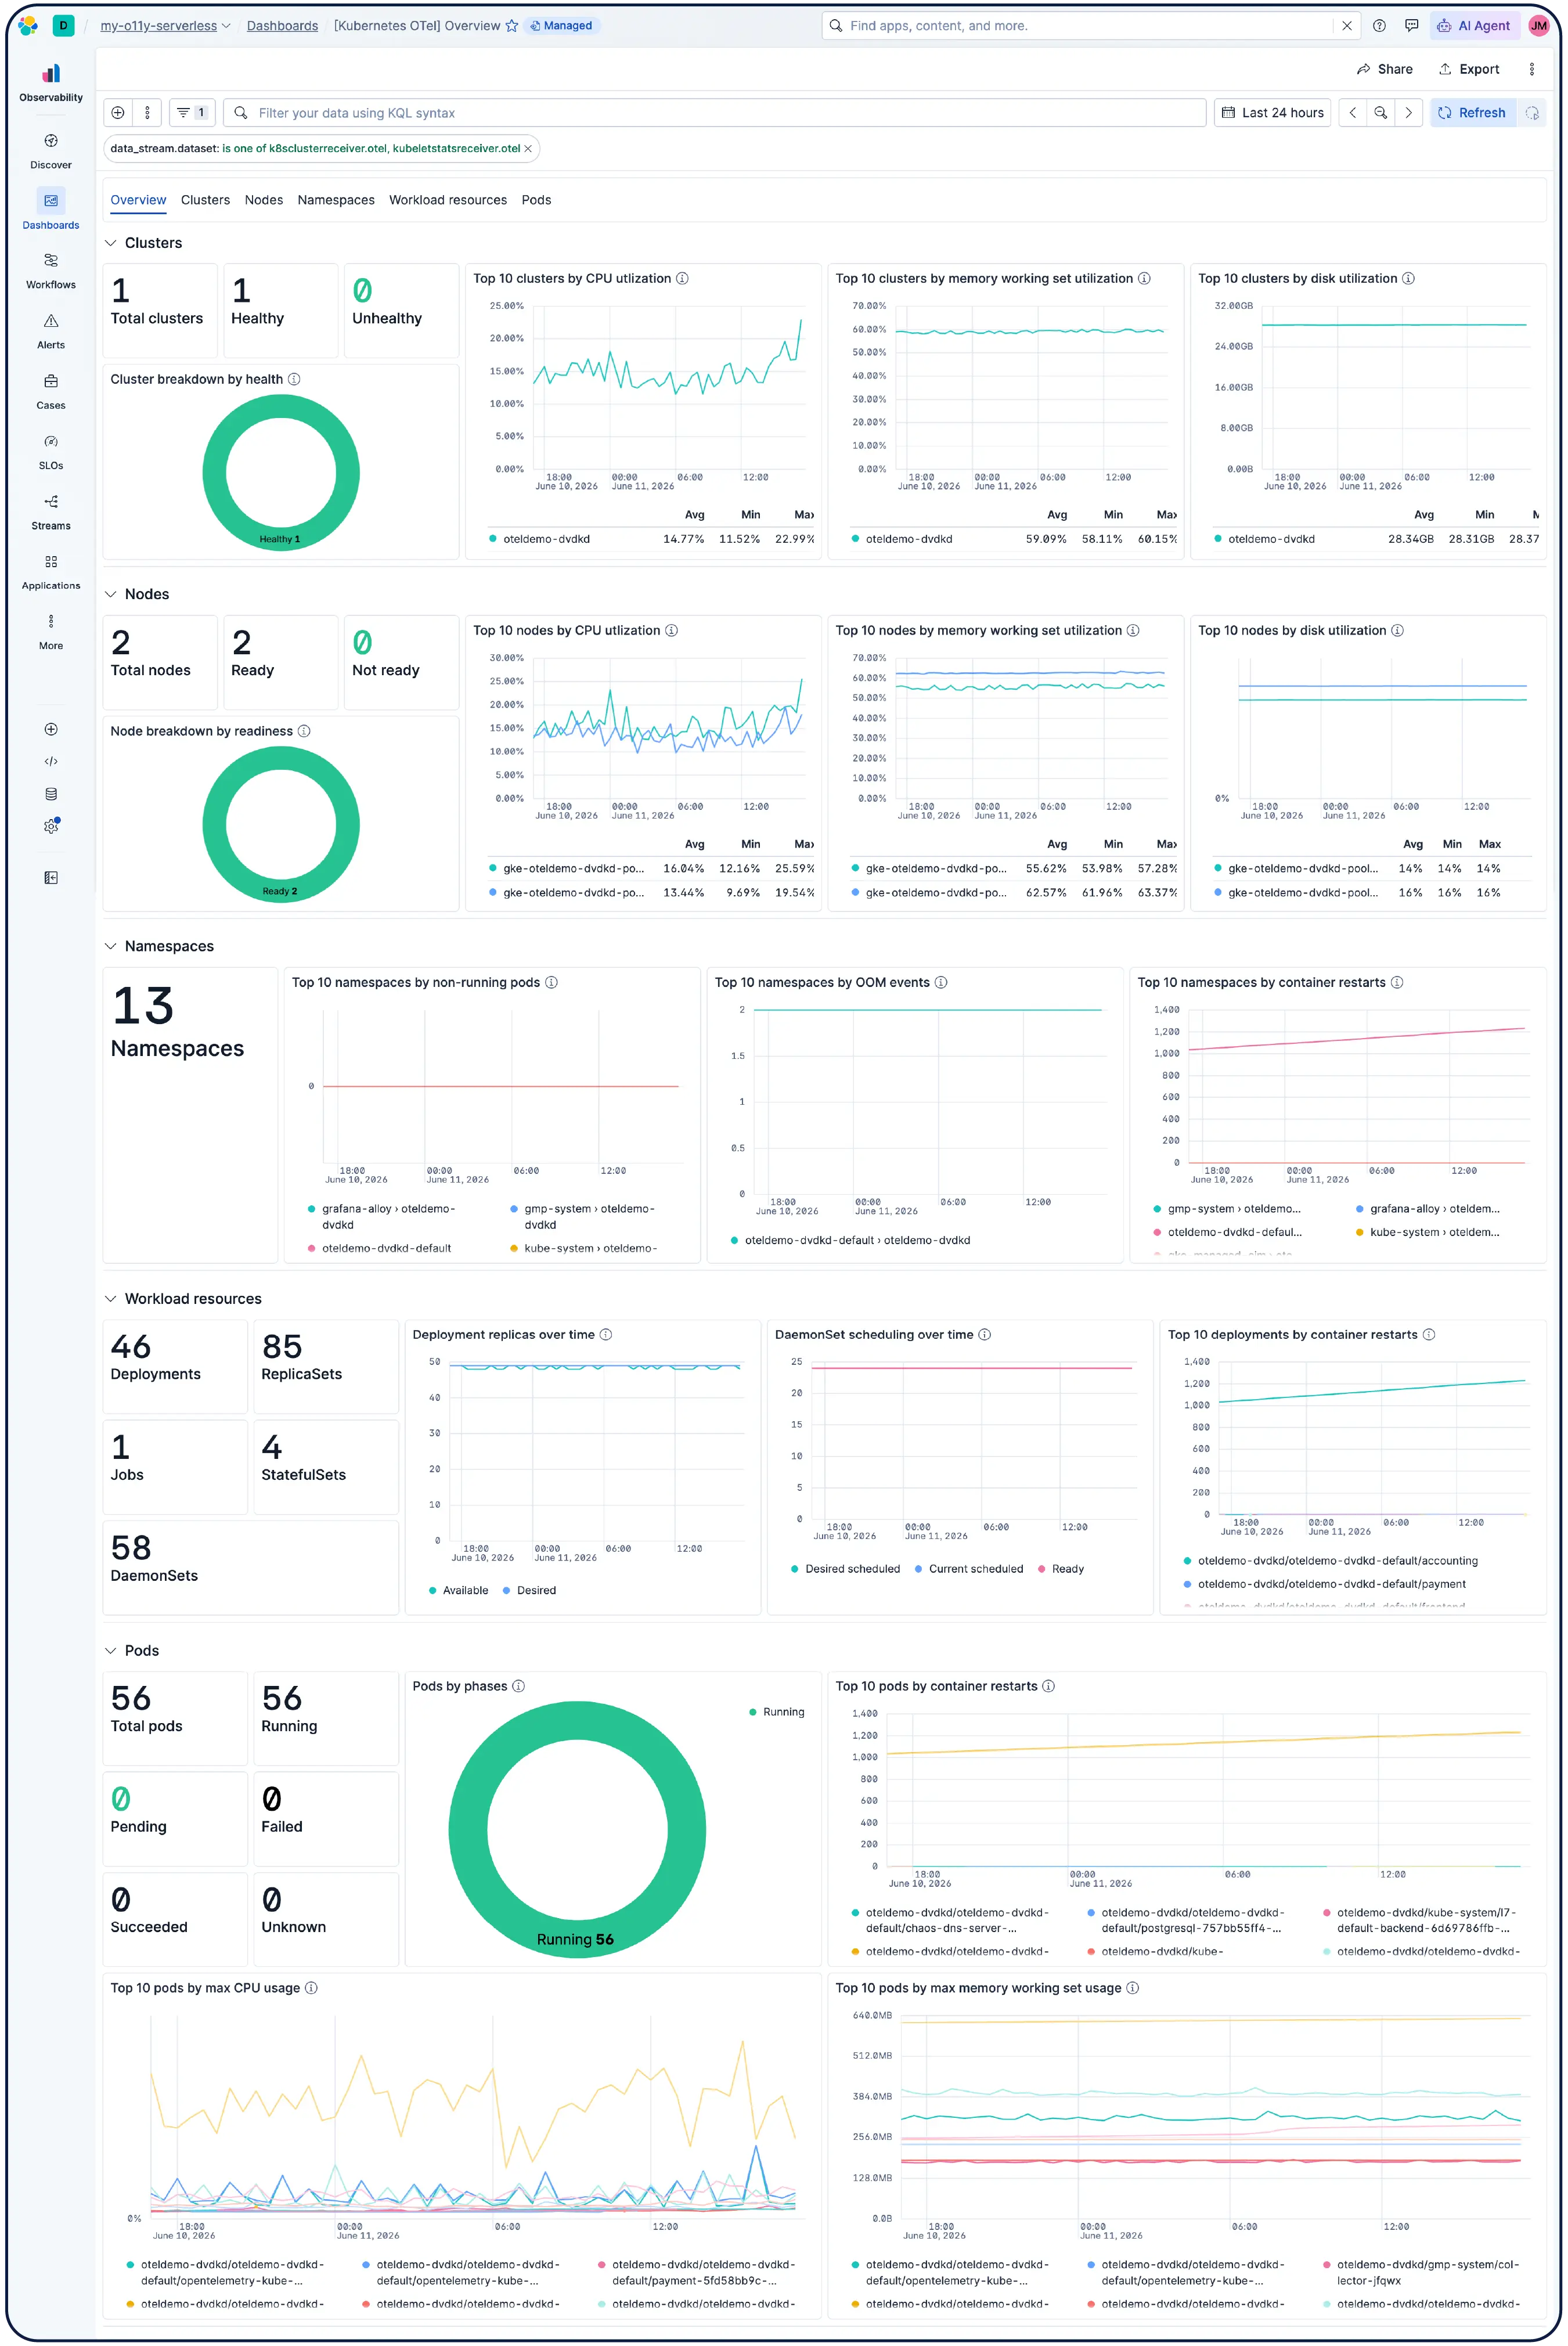
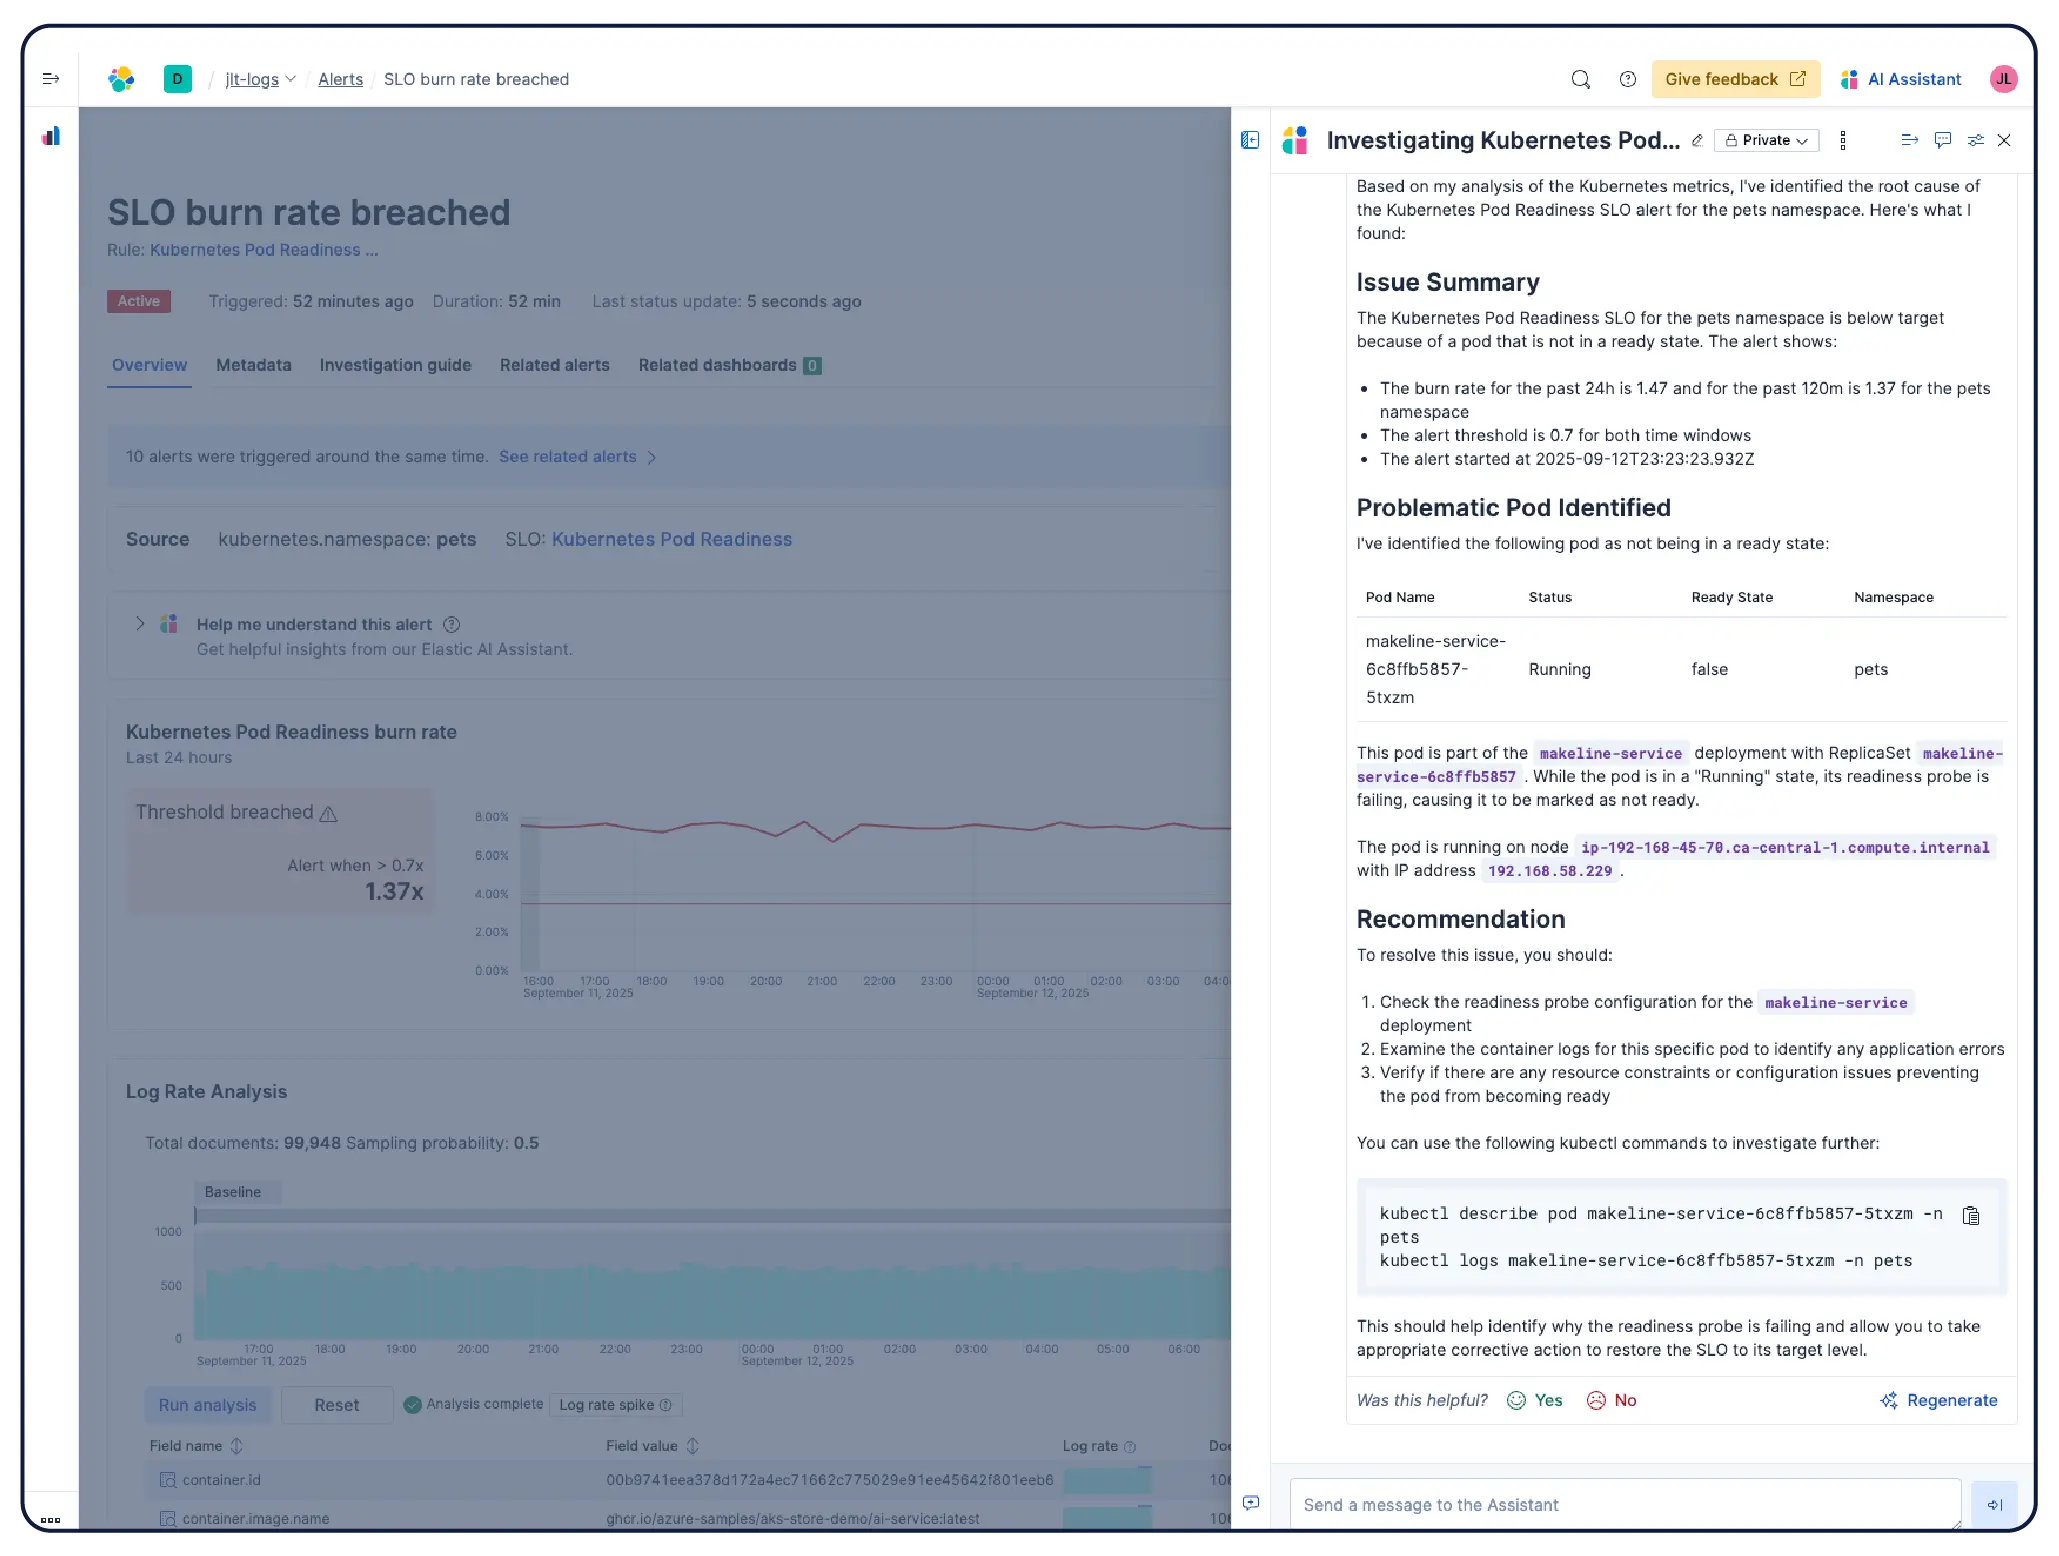
Monitor your infrastructure at scale. AI-led investigations correlate signals across app, Kubernetes, and cloud layers to surface root cause and suggest remediation — without manual digging.
Elastic automatically builds a continuously updated model of your Kubernetes environment — nodes, pods, services, and dependencies. Track SLOs and error budgets, and use agentic AI to navigate from symptom to root cause without having to dig through dashboards.
Scale Kubernetes without the struggle
Other monitoring platforms make you choose between the data you need and the cost you can afford. Elastic gives you both. Get full visibility into every layer of your Kubernetes cluster — nodes, control plane, and workloads — without the operational overhead or tradeoffs.
Elastic
Other vendors
Predictable pricing with long-term retention at full resolution — no cardinality penalties, no forced roll-ups.
Per-host billing is standard. Every autoscaling event is billed at peak node count for the entire month, not average usage.
Columnar on-disk storage means no in-memory cardinality ceiling. Scale to high-cardinality Kubernetes and cloud environments without OOM walls.
In-memory indexing means cardinality spikes hit billing or performance limits at exactly the wrong moment.
Full-text search across all pod and node logs. Find any string in any log, at any scale — no predefined labels required.
Most vendors index log labels only. If you didn't define the label before the incident, you can't search for it during one.
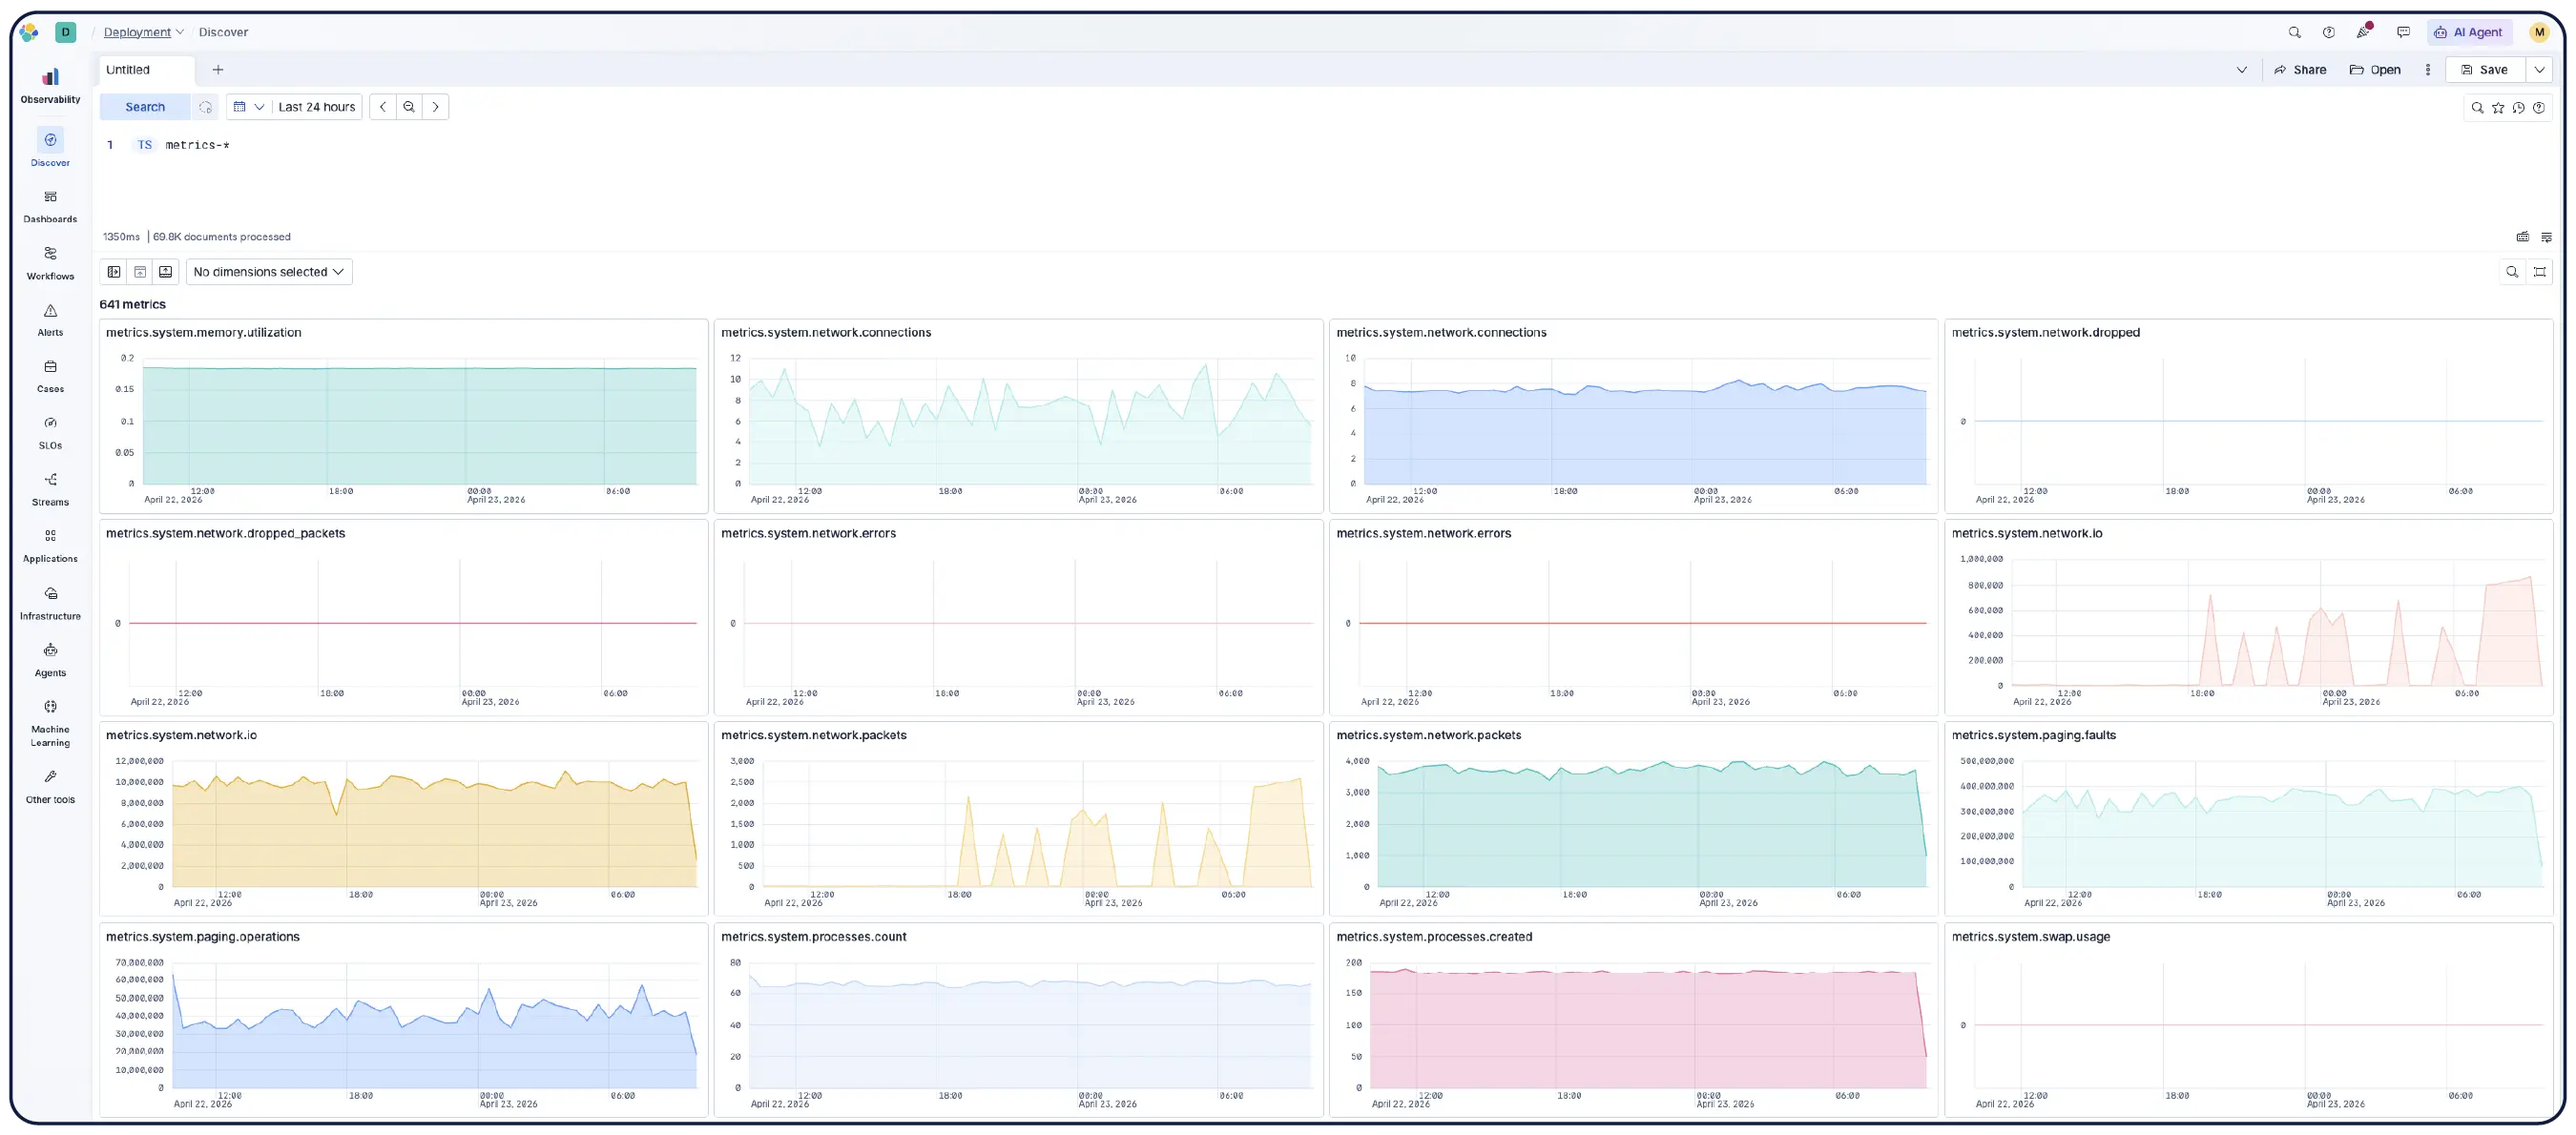
ES|QL queries logs, metrics, and traces in one statement. Correlate a spike in pod CPU with the log line that caused it — without switching tools or languages.
Separate query languages per signal type — one for logs, another for metrics, another for traces — means context-switching at exactly the moment you can't afford it.
Logs, metrics, and traces ingest natively in OpenTelemetry format. Keep your existing instrumentation or use Elastic’s fully upstreamed distribution for production-grade support.
OTel instrumentation is routed through proprietary back ends or billed as custom metrics above a base allocation — penalizing the open standard your team already adopted.
100+ ML jobs run on Kubernetes metrics and logs automatically. Easy to use for beginners, fully customizable for experts.
Anomaly detection requires manual monitor configuration or is limited to predefined patterns.
Elastic Cloud, self-managed, or hybrid — EKS, GKE, AKS, on-prem, air-gapped. One platform wherever your clusters run.
Many vendors are SaaS-only. If your clusters run on-prem or in a regulated environment, you're out of options before the evaluation starts.
Schema-neutral, open source, and built on open standards — OTel-first, Prometheus-native, PromQL supported. Store your data in your preferred format and query as is. No translation, no lock-in.
Proprietary agents and back ends are the norm. Switching vendors means reinstrumenting your entire stack.
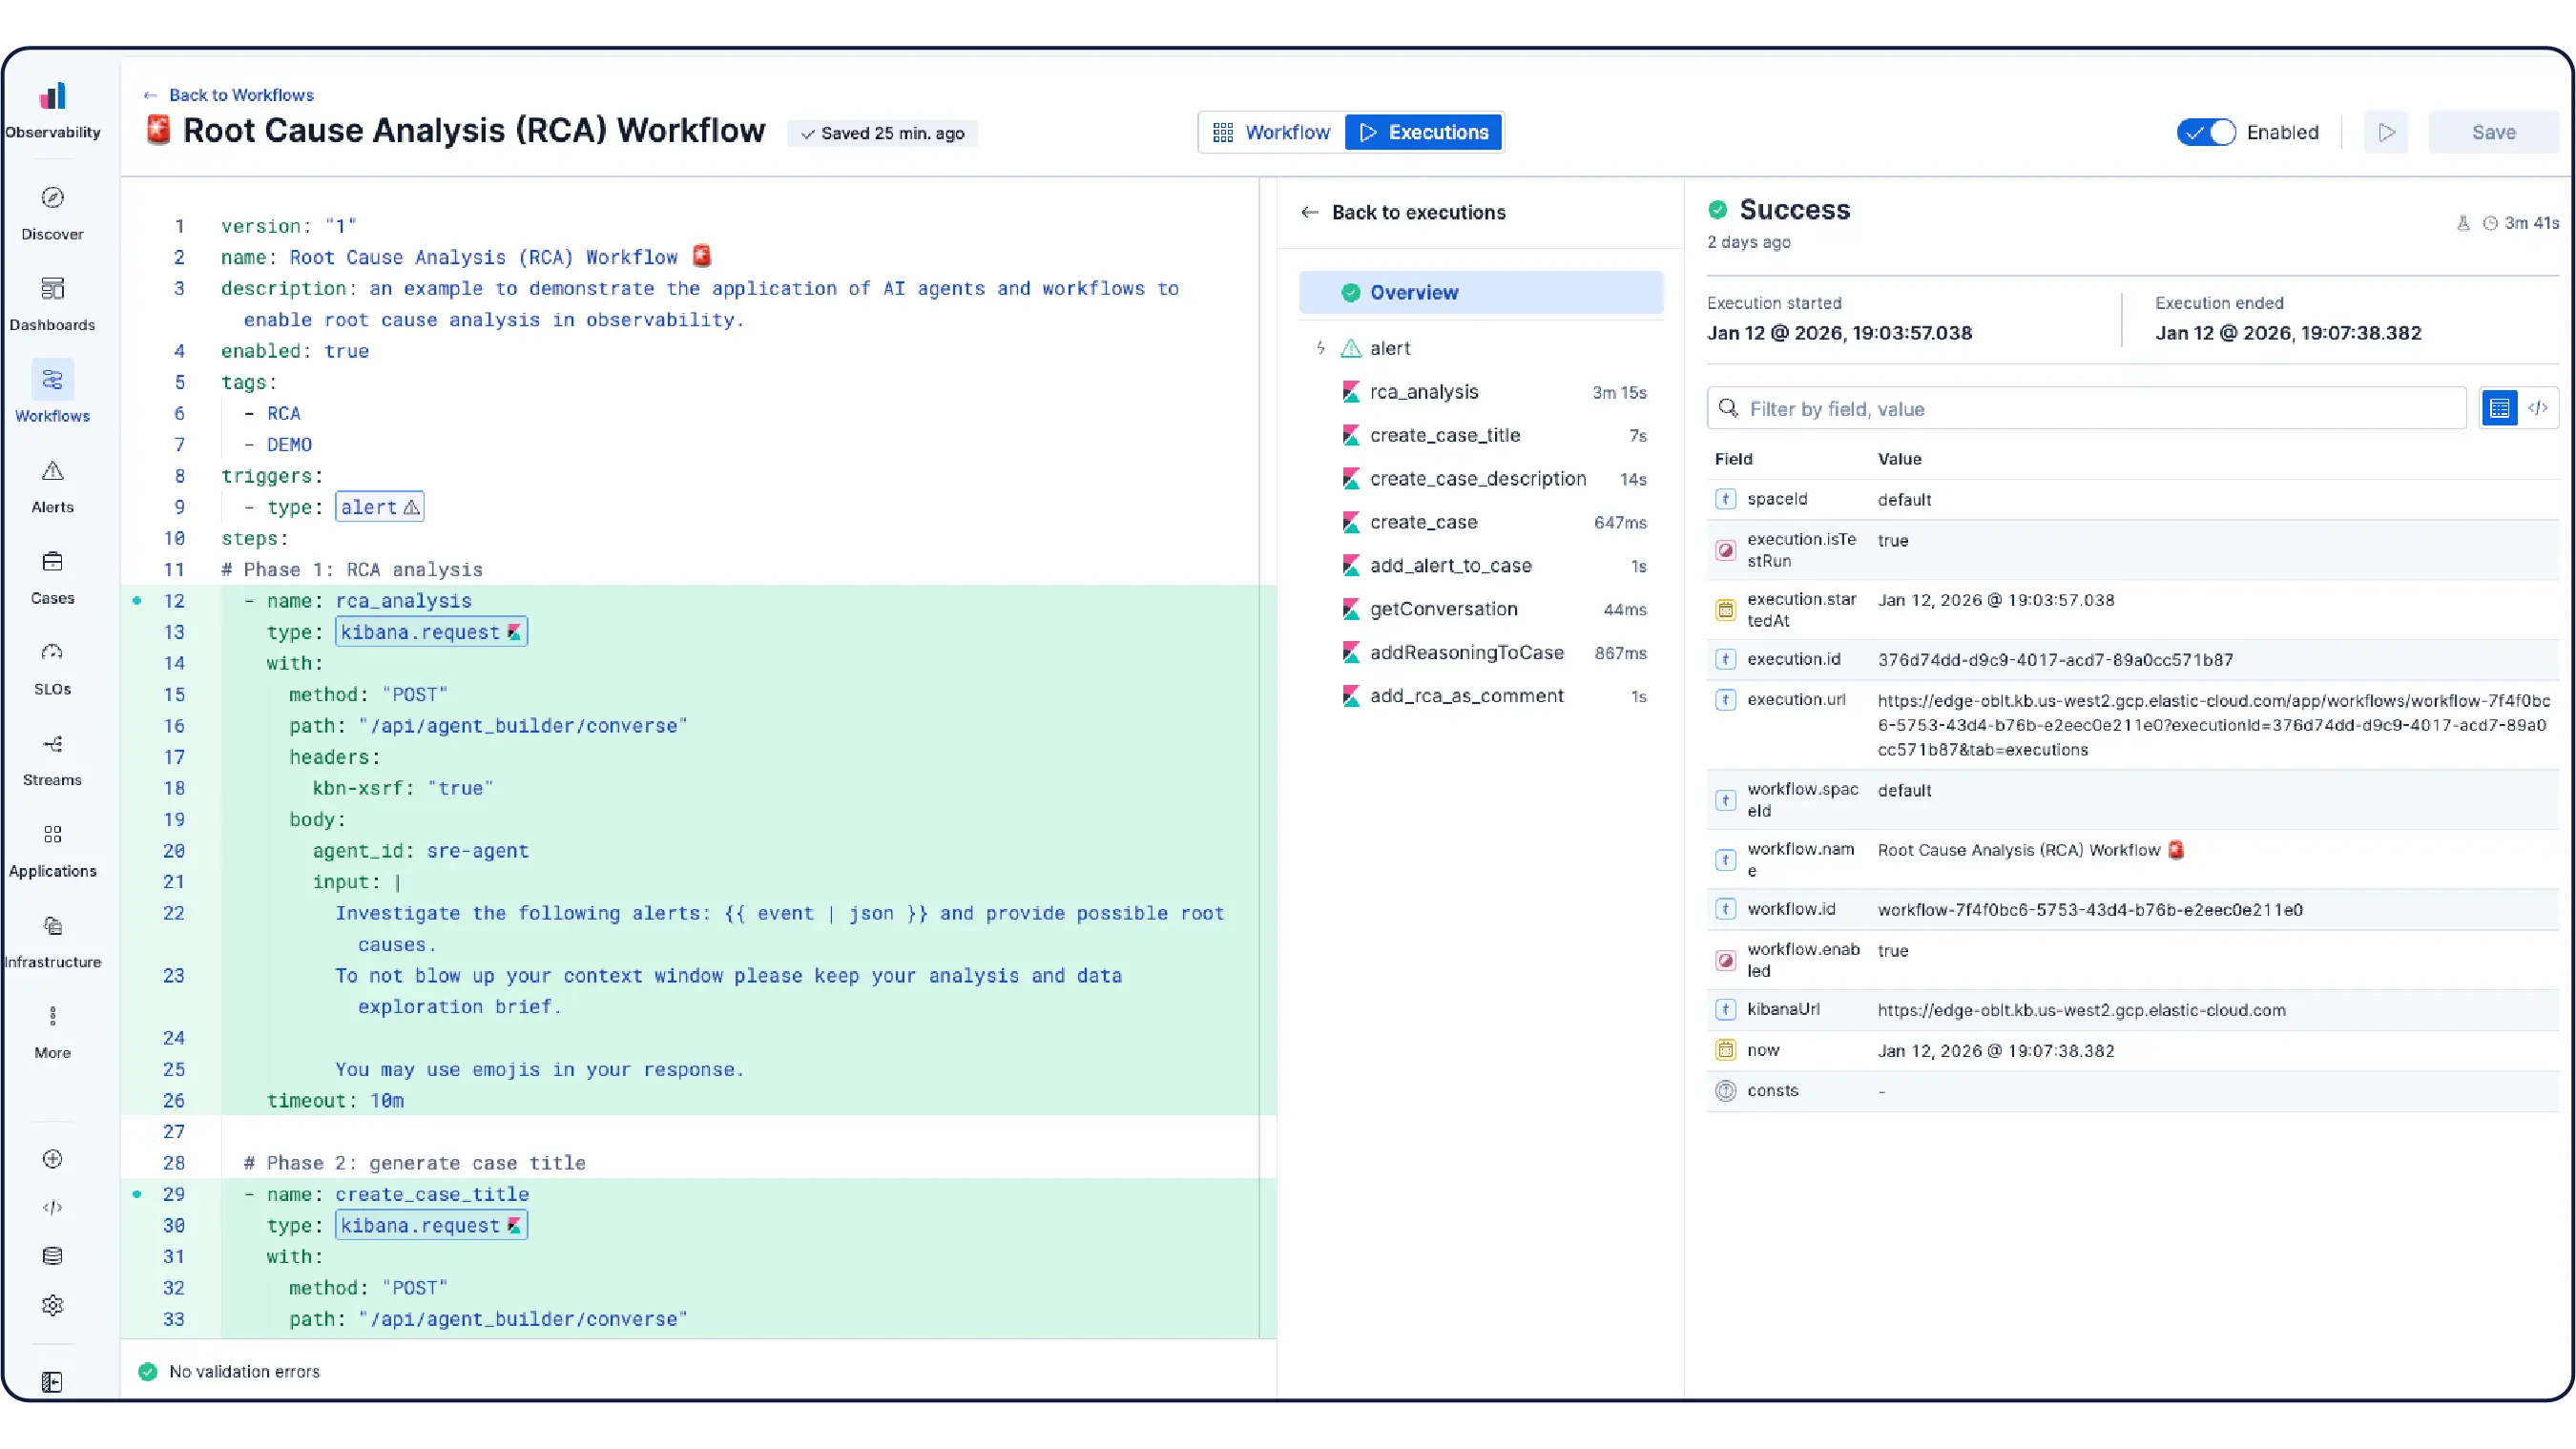
AI analyzes your metrics, logs, and traces to quickly surface root causes and guide remediation — no manual dashboard-diving required.
AI often operates across fragmented back ends rather than a unified high performance datastore, limiting what it can correlate and how fast it can act.
See why companies like yours choose Elastic Observability
Customer spotlight

Comcast ingests 400 terabytes of data daily with Elastic to monitor services and accelerate root cause analysis, ensuring a top-notch customer experience.
Customer spotlight

Zooplus uses Elastic to monitor 2,500 microservices, 20,000 containers, 600 AWS accounts with 70 AWS services, and 40 Kubernetes clusters.
Customer spotlight

Informatica cut costs and reduced MTTR by migrating its entire logging workload to Elastic for 100+ applications and 300+ Kubernetes clusters.
Join the chat
Connect to Elastic's global community and participate in open conversations and collaboration.


.jpg)

Frequently asked questions
What is Kubernetes monitoring?
What is Kubernetes monitoring?
Kubernetes monitoring tracks the health and performance of your cluster — nodes, pods, namespaces, and the workloads running on them — using metrics, logs, and traces. When something breaks, you need to find the root cause fast across a dynamic, ephemeral environment where services come and go constantly.
Which Kubernetes distributions does Elastic support?
Which Kubernetes distributions does Elastic support?
Elastic supports KS, AKS, GKE, and self-managed clusters with dynamic auto-discovery across all of them.
Why does the Elastic Kubernetes monitoring integration ship with so much included?
Why does the Elastic Kubernetes monitoring integration ship with so much included?
Because the hardest part of Kubernetes monitoring isn't connecting your cluster — it's the hours spent building dashboards, writing alert rules, configuring ML jobs, and maintaining everything as your cluster changes. Elastic ships all of that with the integration so you're monitoring from day one, not day thirty.
How does agentic AI help with Kubernetes incidents?
How does agentic AI help with Kubernetes incidents?
Instead of manually correlating dashboards across pods, services, and cloud layers, Elastic's AI agents analyze your telemetry automatically to investigate issues, surface root cause, and execute remediation — drawing on ML models and context from your runbooks and knowledge bases.
How does Elastic handle high-cardinality Kubernetes metrics?
How does Elastic handle high-cardinality Kubernetes metrics?
Elastic handles high-cardinality Kubernetes metrics through its Time Series Data Stream (TSDS) architecture, which uses columnar on-disk storage instead of an in-memory inverted index. Unlike Prometheus-based back ends that OOM when pod and namespace label cardinality spikes, Elastic imposes no in-memory cardinality ceiling. Metrics ingest natively via Prometheus remote write or OpenTelemetry with no schema conversion, and automatic downsampling controls long-term storage costs without sacrificing query precision.
Does Elastic support kube-state-metrics?
Does Elastic support kube-state-metrics?
Elastic's OpenTelemetry-native collector handles Kubernetes state metrics out of the box so kube-state-metrics are not required.
How does Elastic's Kubernetes monitoring pricing compare to competitors?
How does Elastic's Kubernetes monitoring pricing compare to competitors?
Elastic Observability uses consumption-based pricing with no per-host fees and no high-water mark billing. Datadog’s per-host pricing bills autoscaling events at peak node count for the entire month, not average usage. Custom metrics cost extra and can account for up to 52% of the average bill. Elastic's model means ephemeral workloads and high-cardinality Prometheus environments don't produce end-of-month surprises.
What does migration look like from Datadog or Grafana?
What does migration look like from Datadog or Grafana?
Migration is easy with our migration tool (currently in tech preview), which automatically converts your dashboards and alerting rules. Native PromQL and OTel support means your existing ingest architecture carries over. Most teams are fully operational the next day.
Does Elastic Kubernetes monitoring include security?
Does Elastic Kubernetes monitoring include security?
Yes. Elastic's Kubernetes Security Posture Management (KSPM) integration evaluates your cluster configuration against CIS Benchmarks guidelines and generates findings with step-by-step remediation instructions. It supports EKS and self-managed clusters, evaluates every four hours automatically, and is available to all Elastic Cloud users, so the same platform monitoring your performance is also checking your security posture. In addition, Elastic Defend for Containers (D4C) integration provides cloud-native runtime protection for Kubernetes environments, using eBPF to monitor process and file activity inside running containers.