Infrastructure monitoring built for high-cardinality metrics
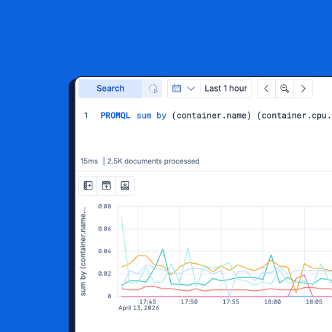
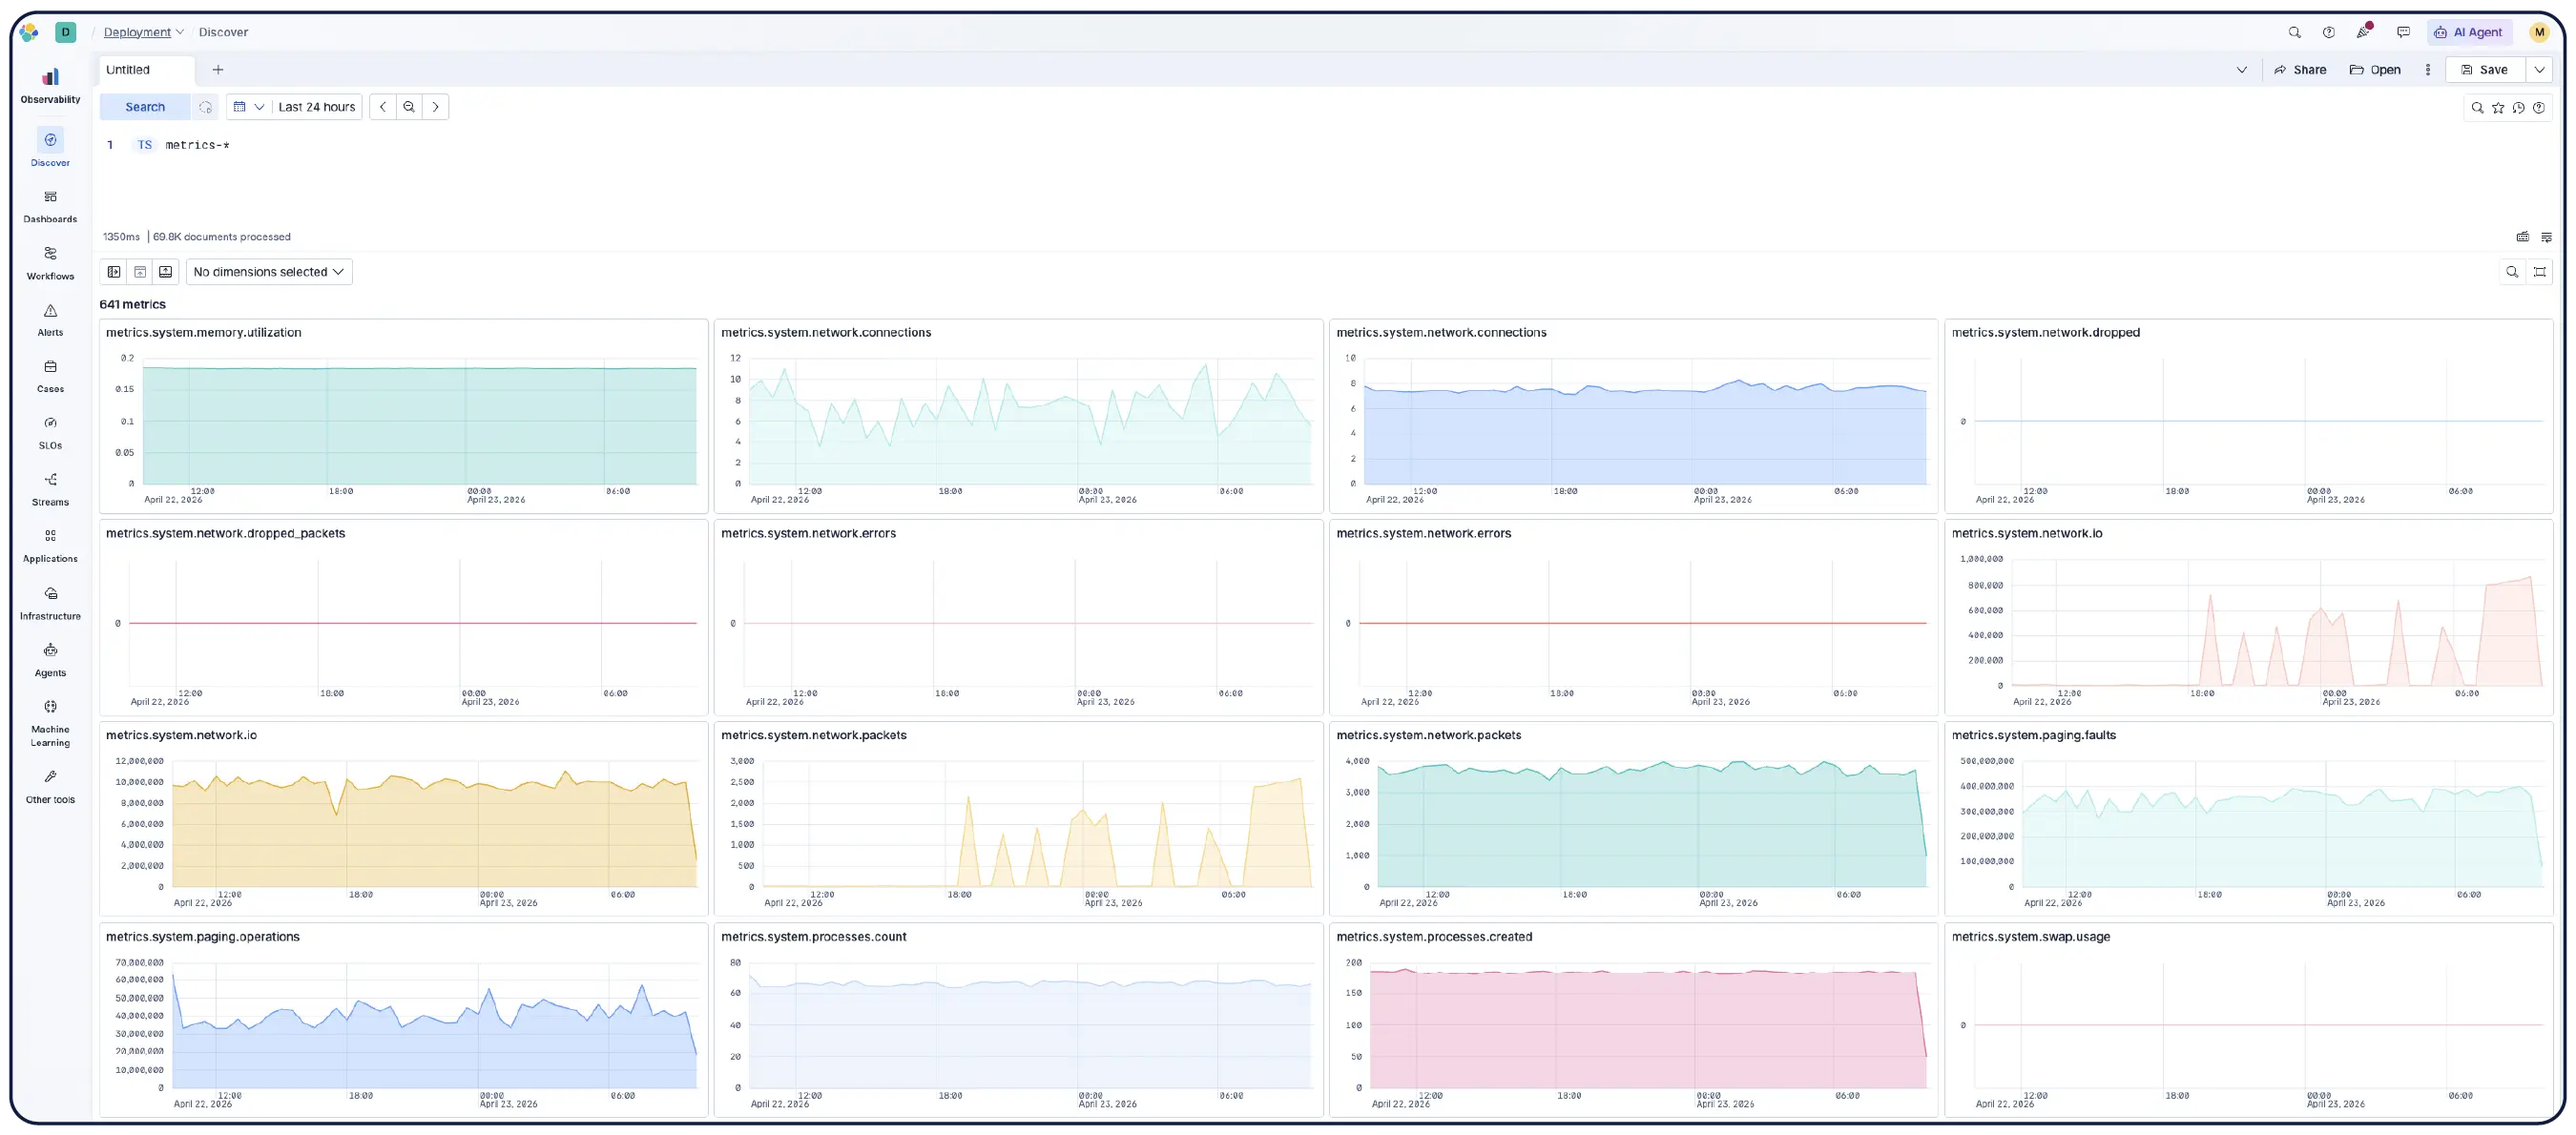
Get complete infrastructure visibility without compromise. Elastic’s metrics platform handles high-cardinality OpenTelemetry (OTel) and Prometheus data at full resolution, enabling you to detect and resolve issues with AI-driven investigations, faster and cheaper than the alternatives.
Guided Demo
From cloud to bare metal
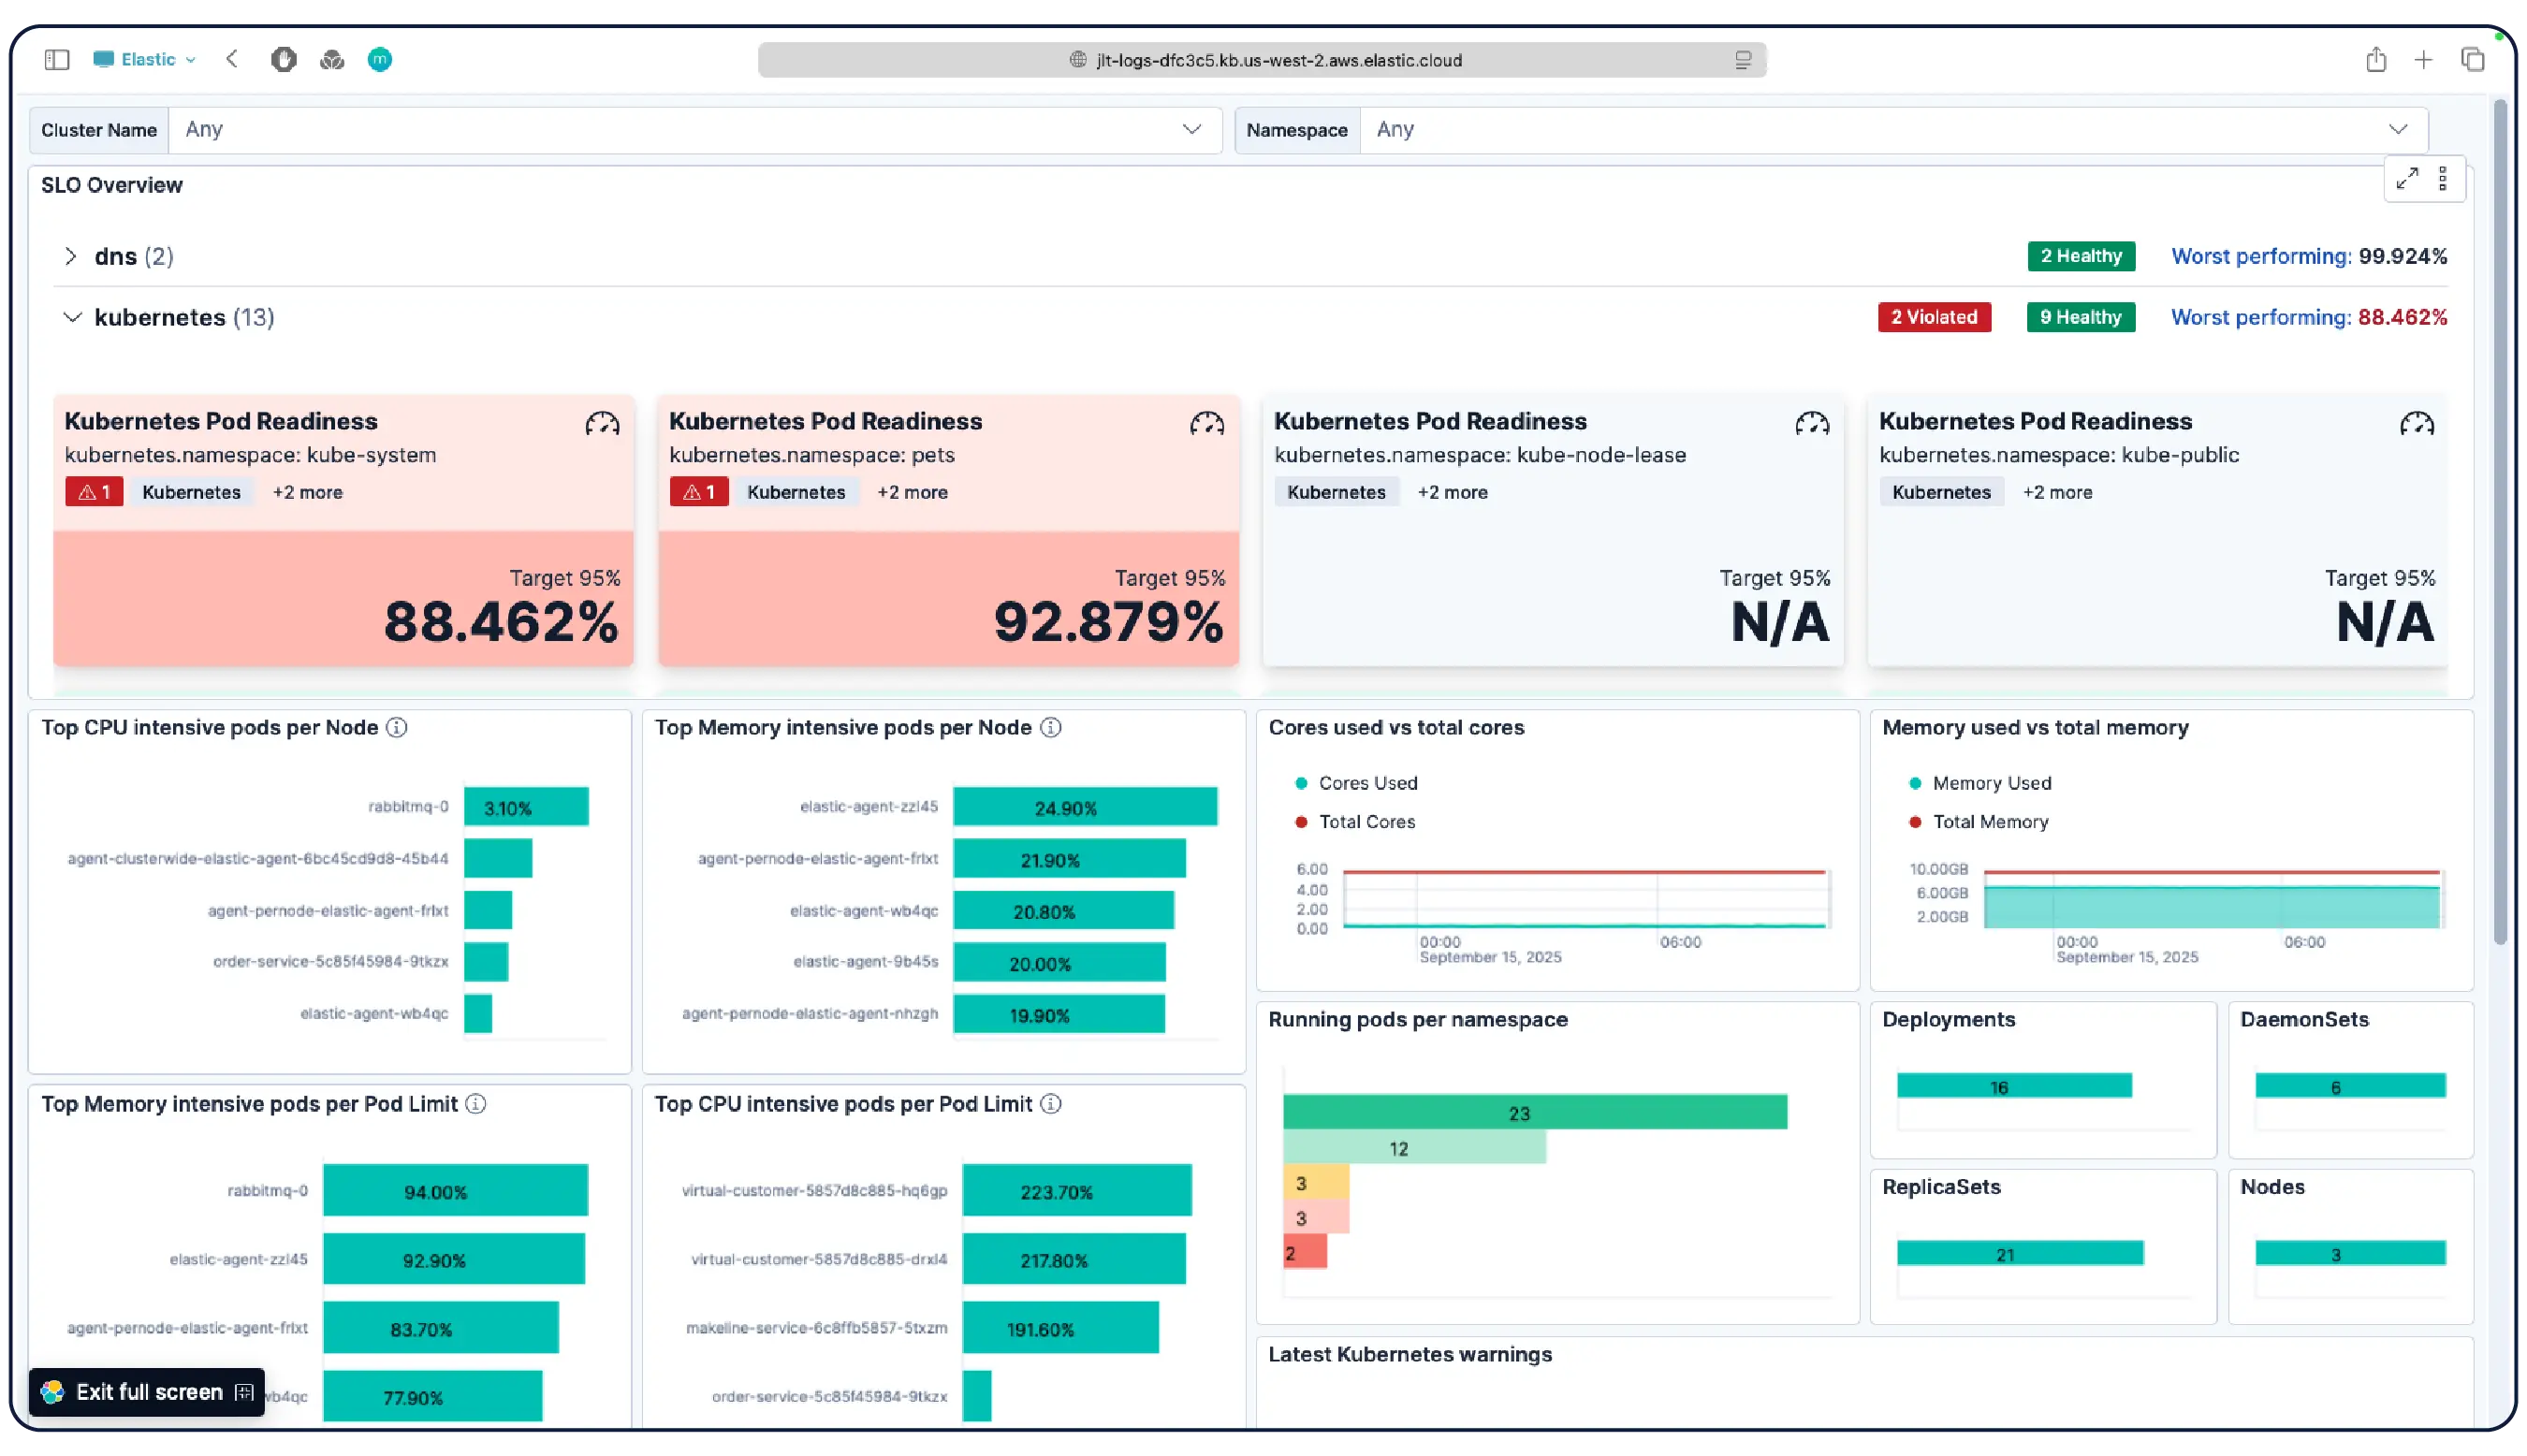
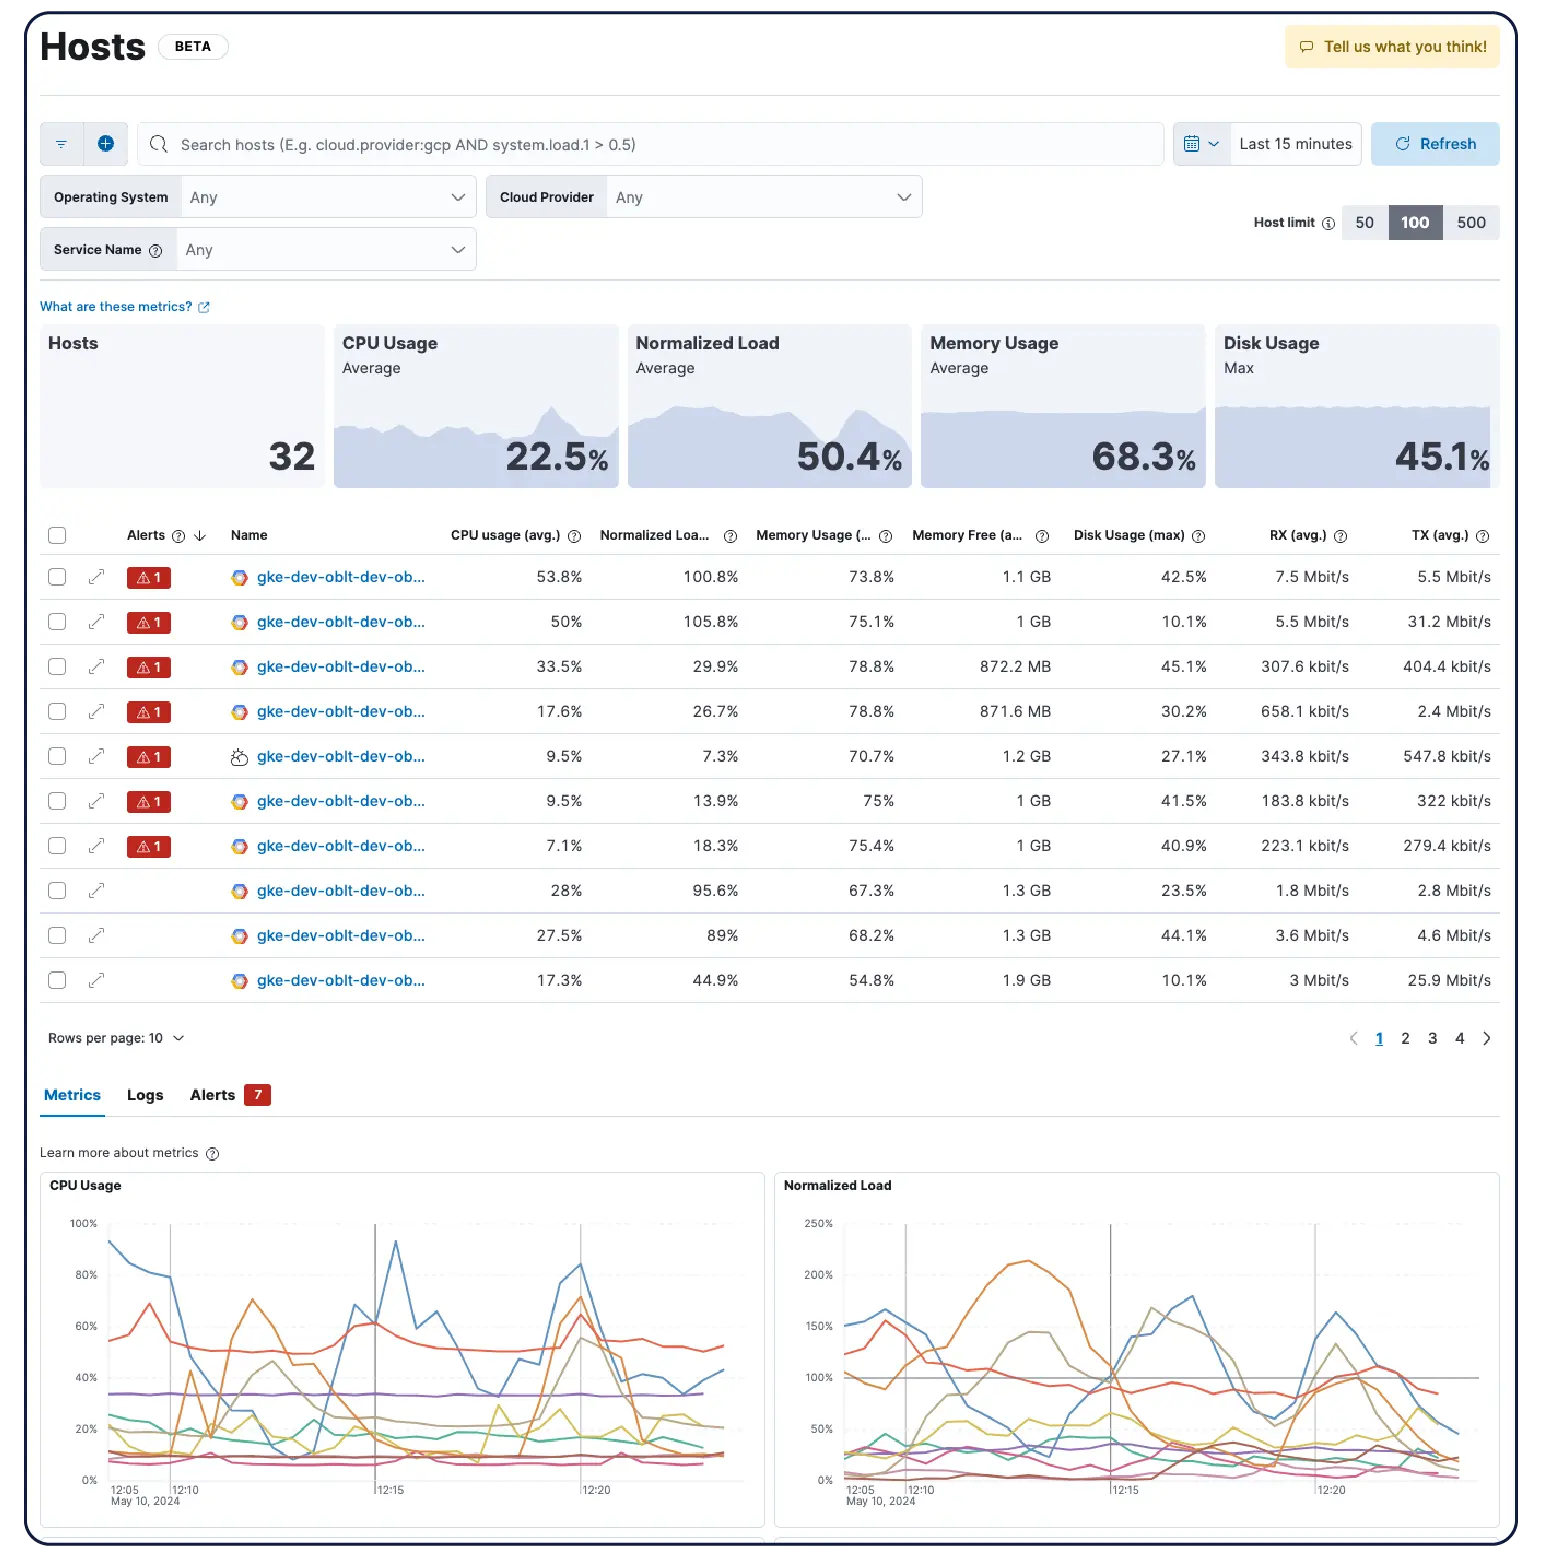
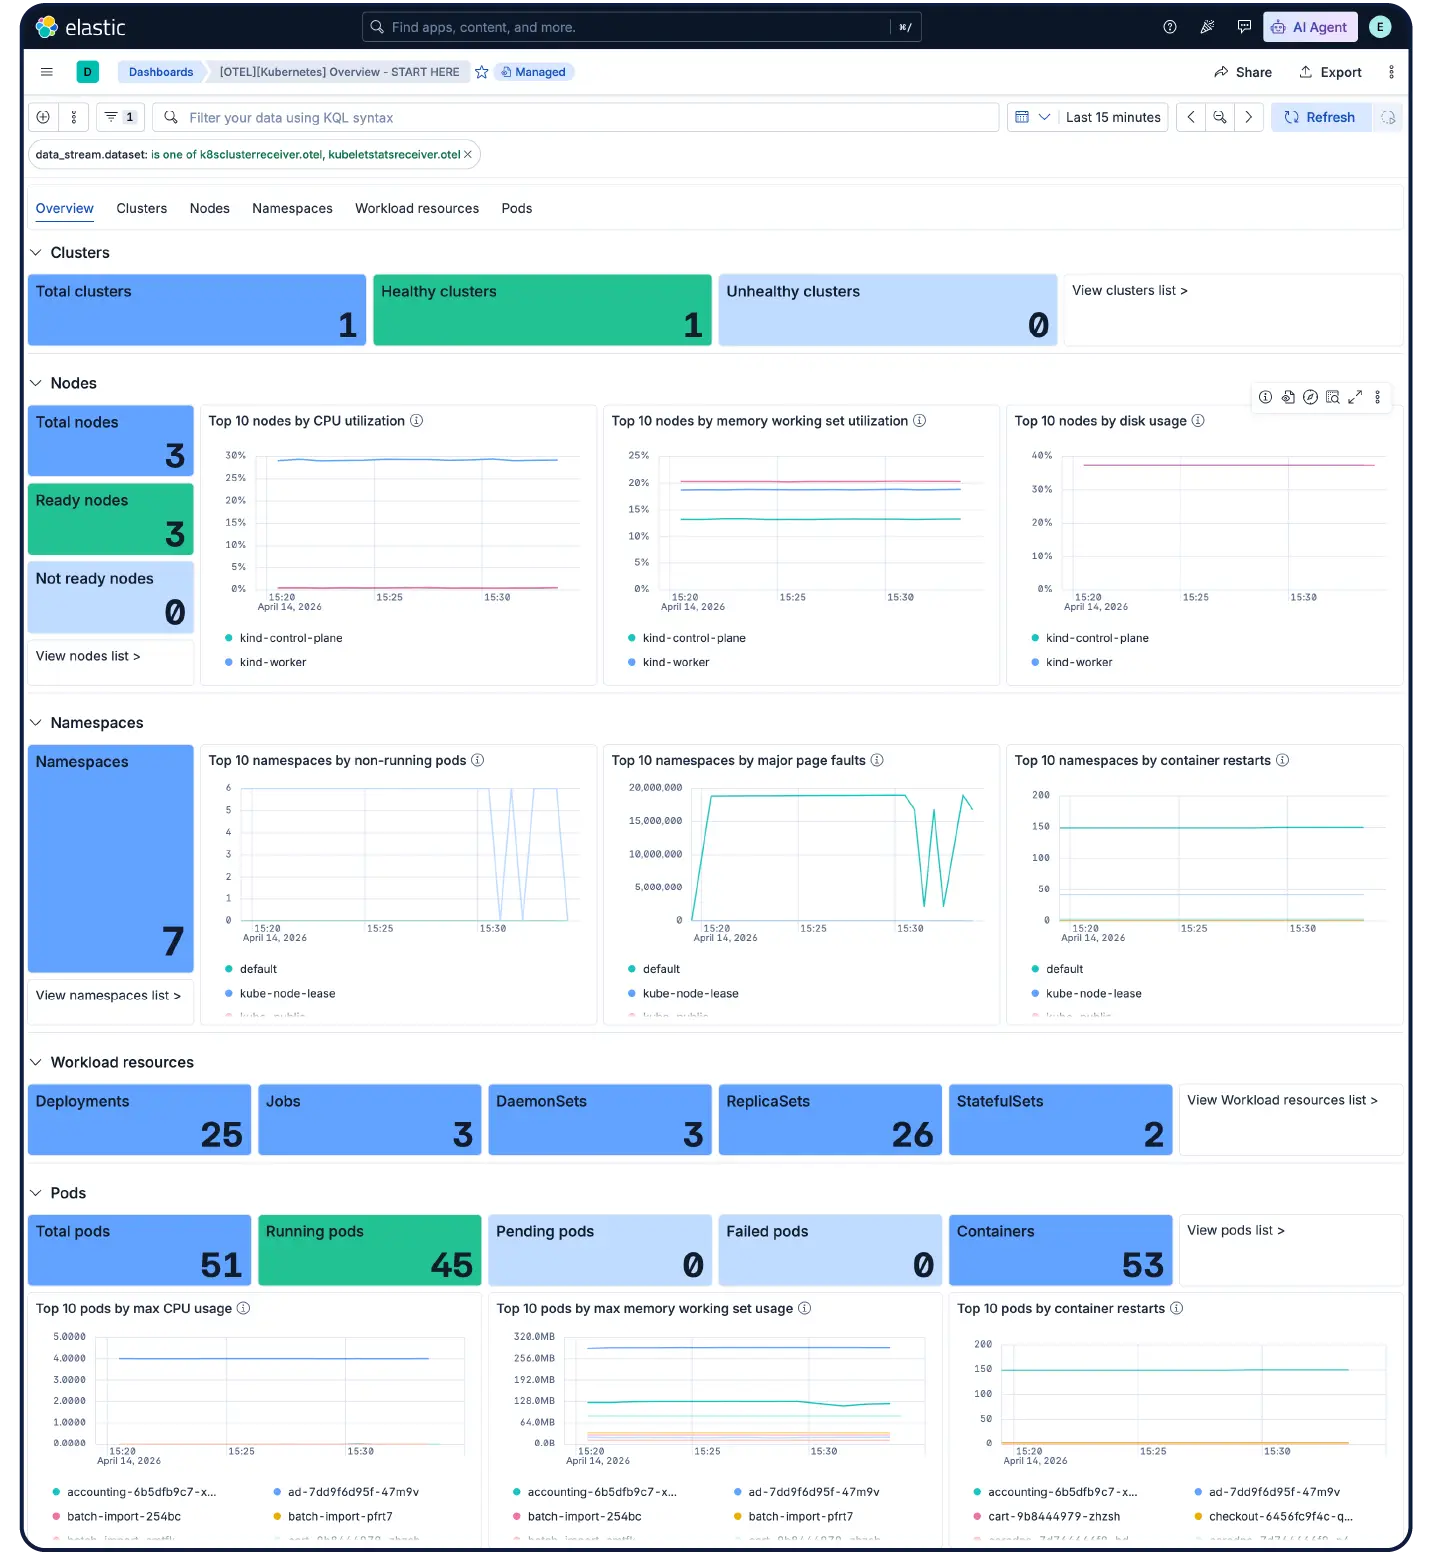
Whether you're running Kubernetes clusters, VMs, or on-prem servers, Elastic delivers scalable, full fidelity infrastructure observability across your entire environment. Our 450+ prebuilt integrations, lightweight agents, and OTel collectors make ingest painless — whether your data is coming from AWS, Azure, GCP, Prometheus, or your own data center.
Bring your infrastructure into focus
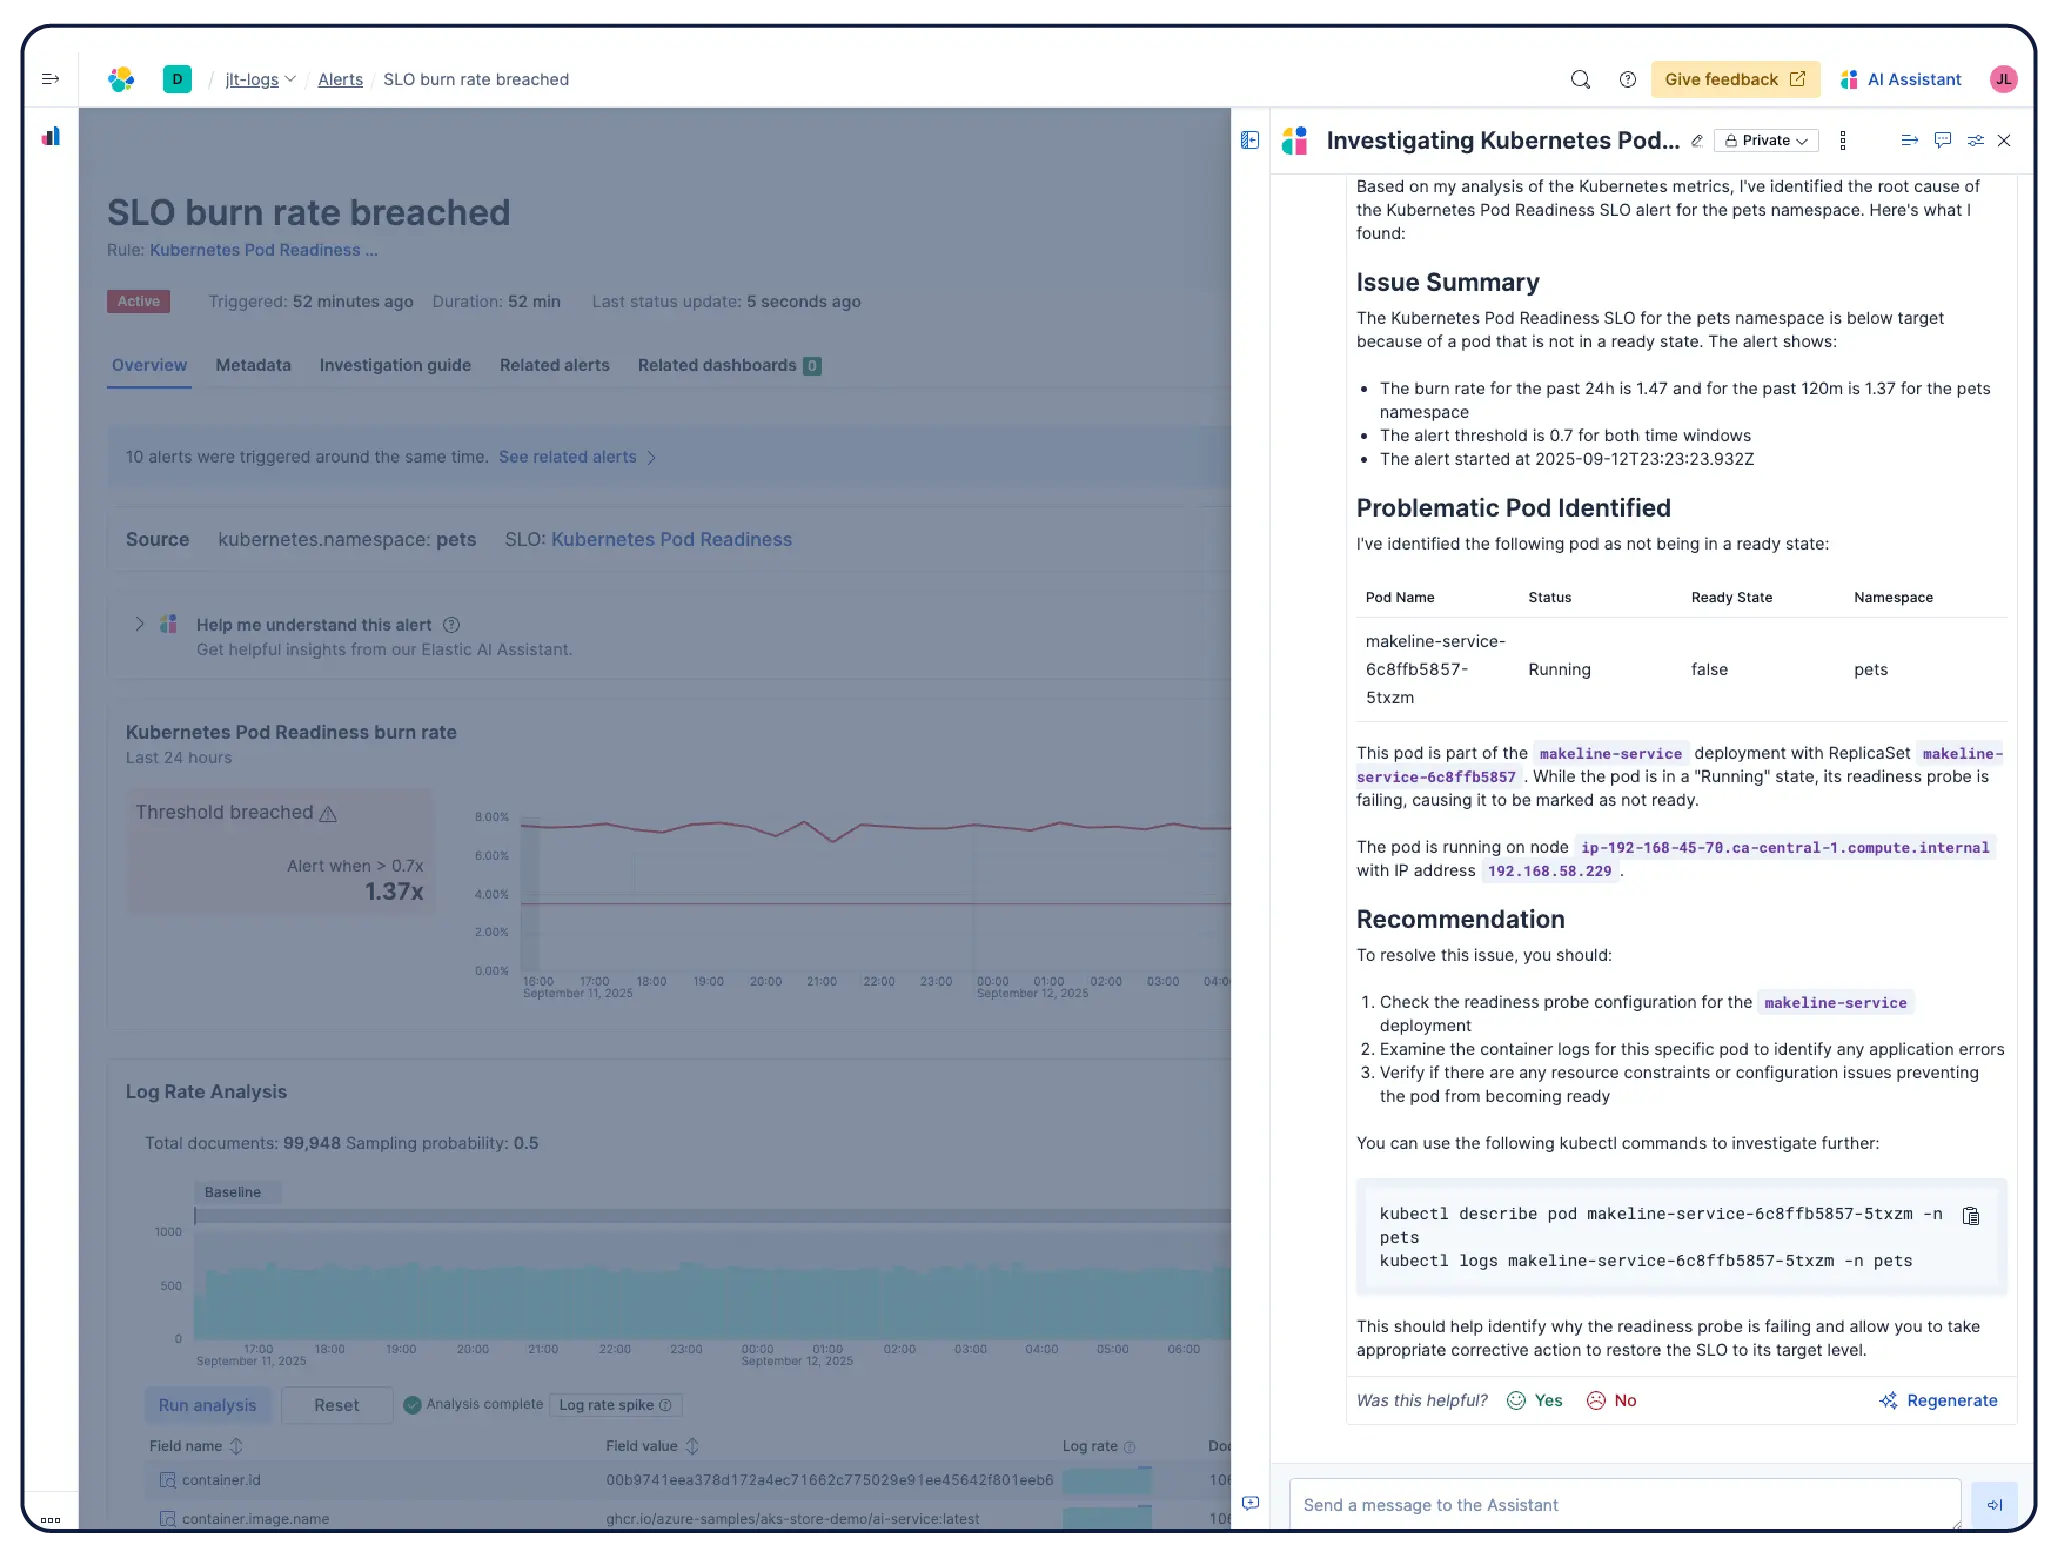
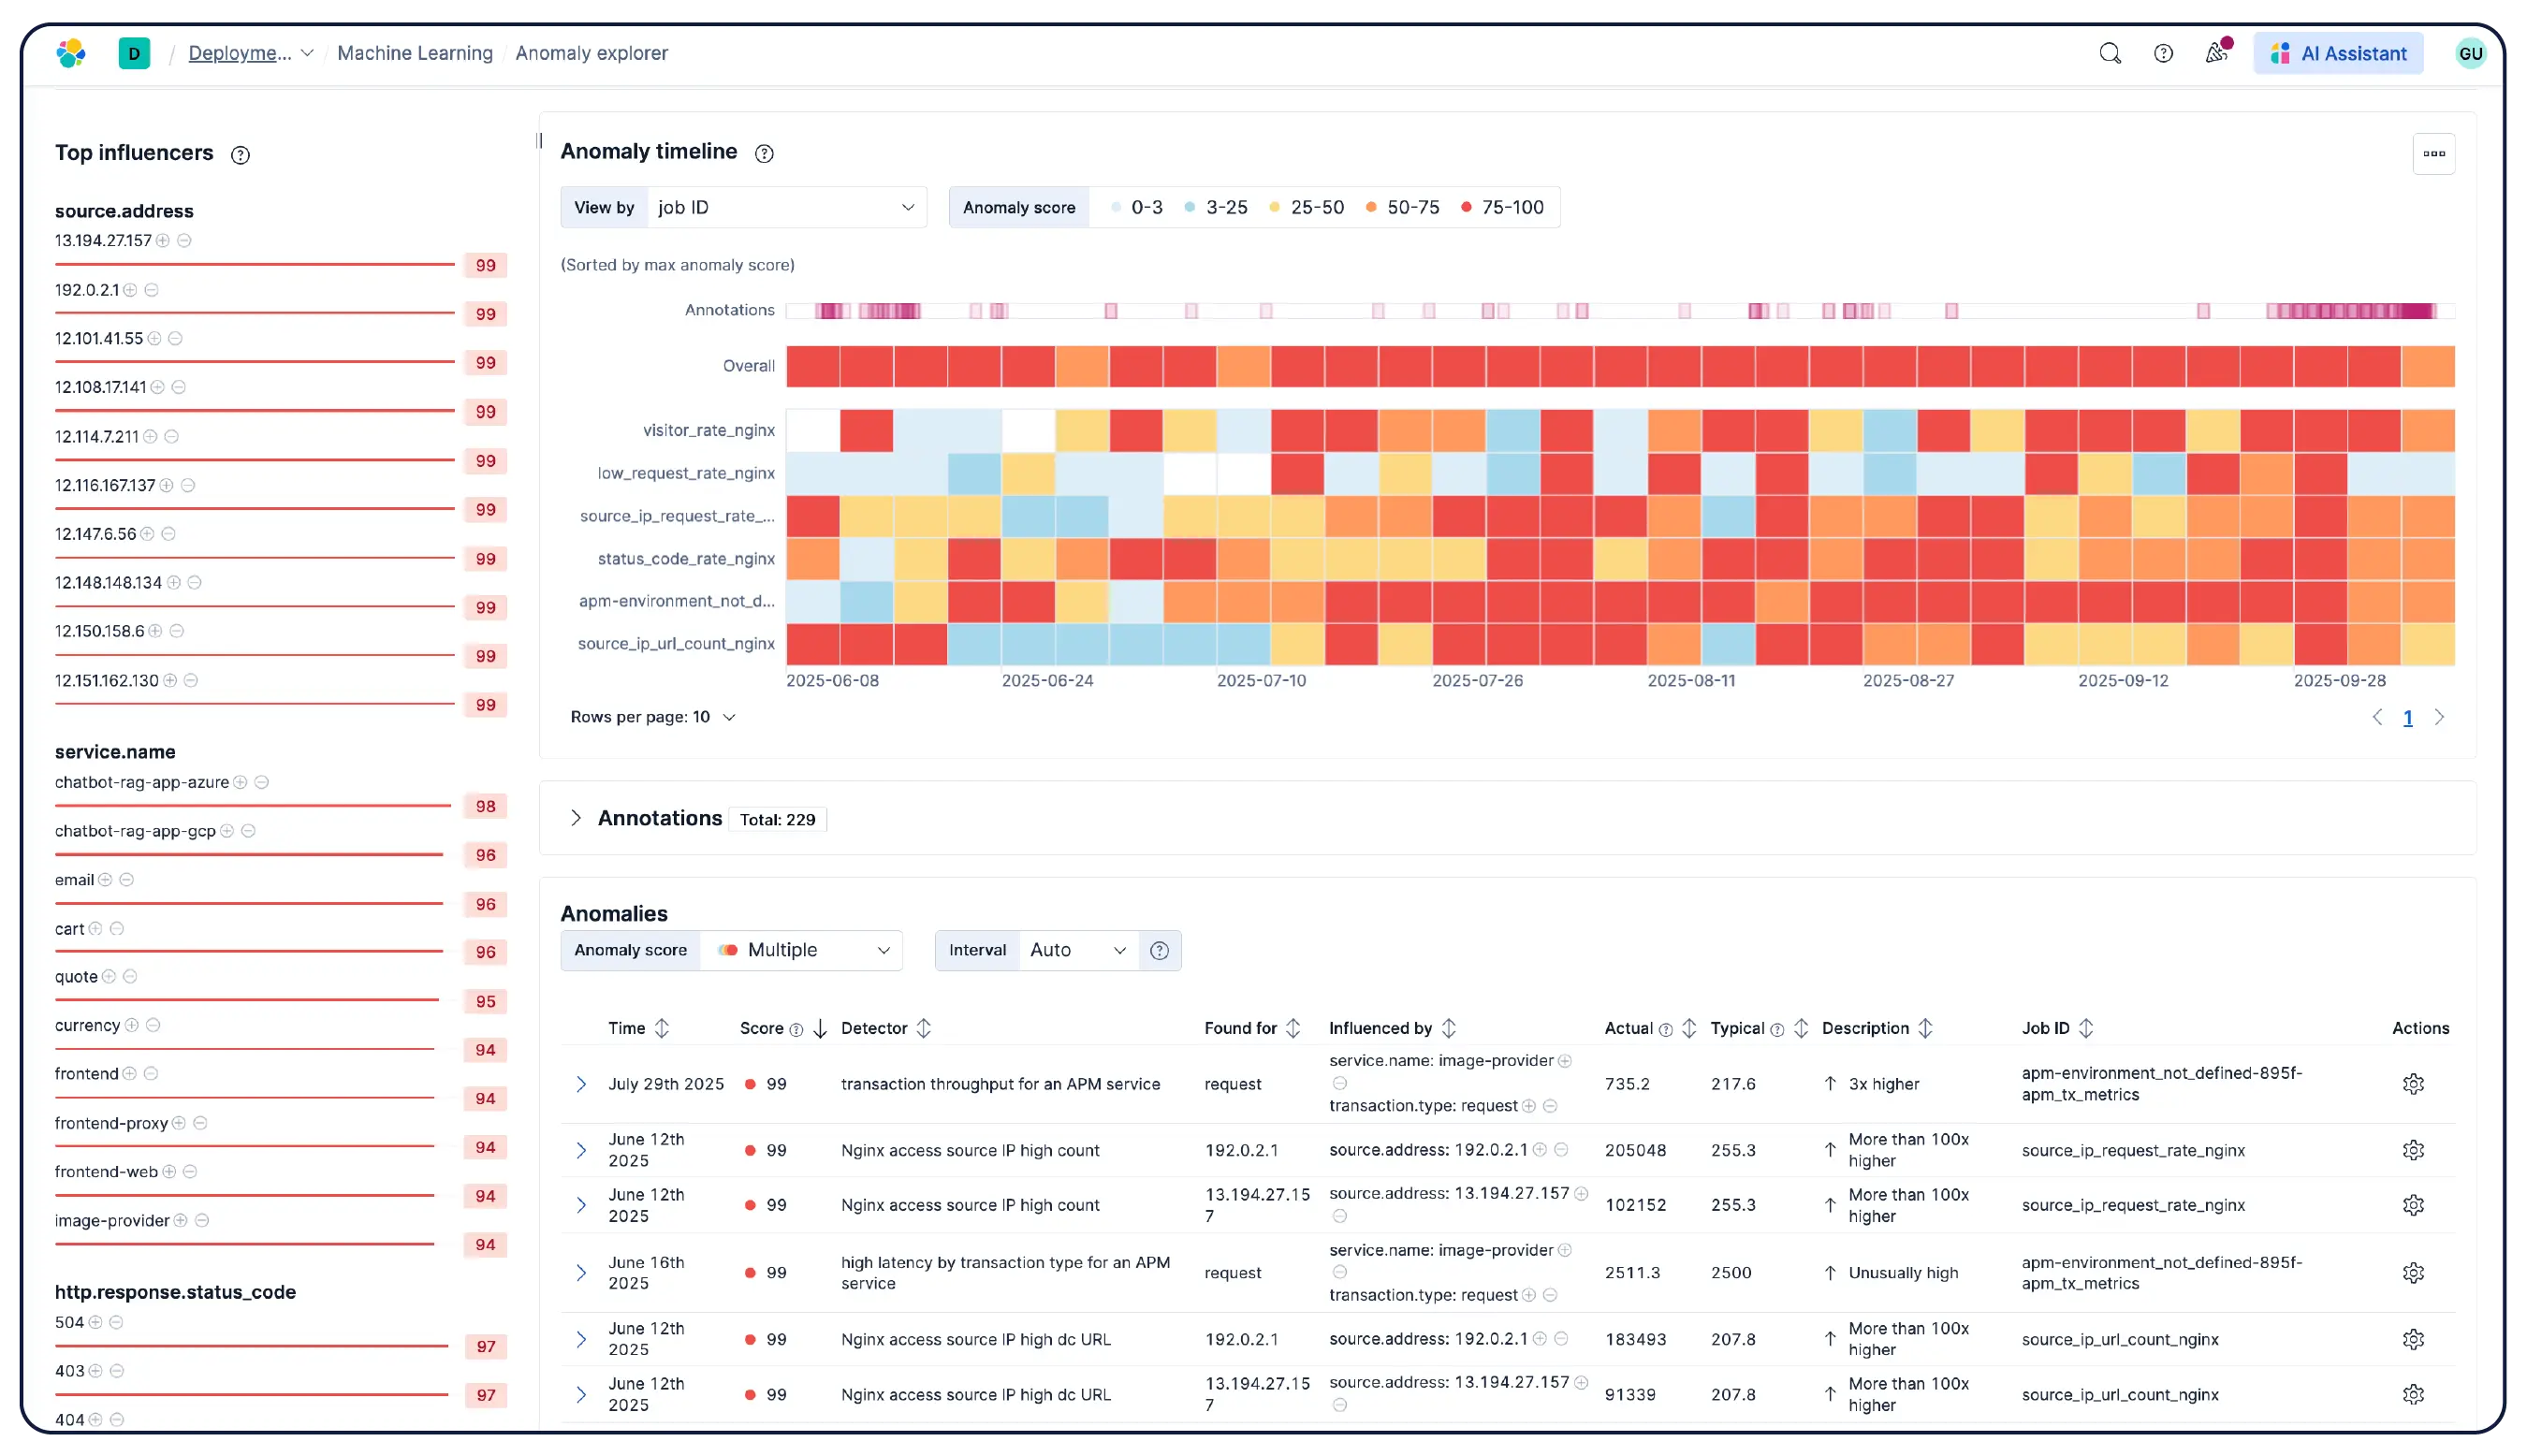
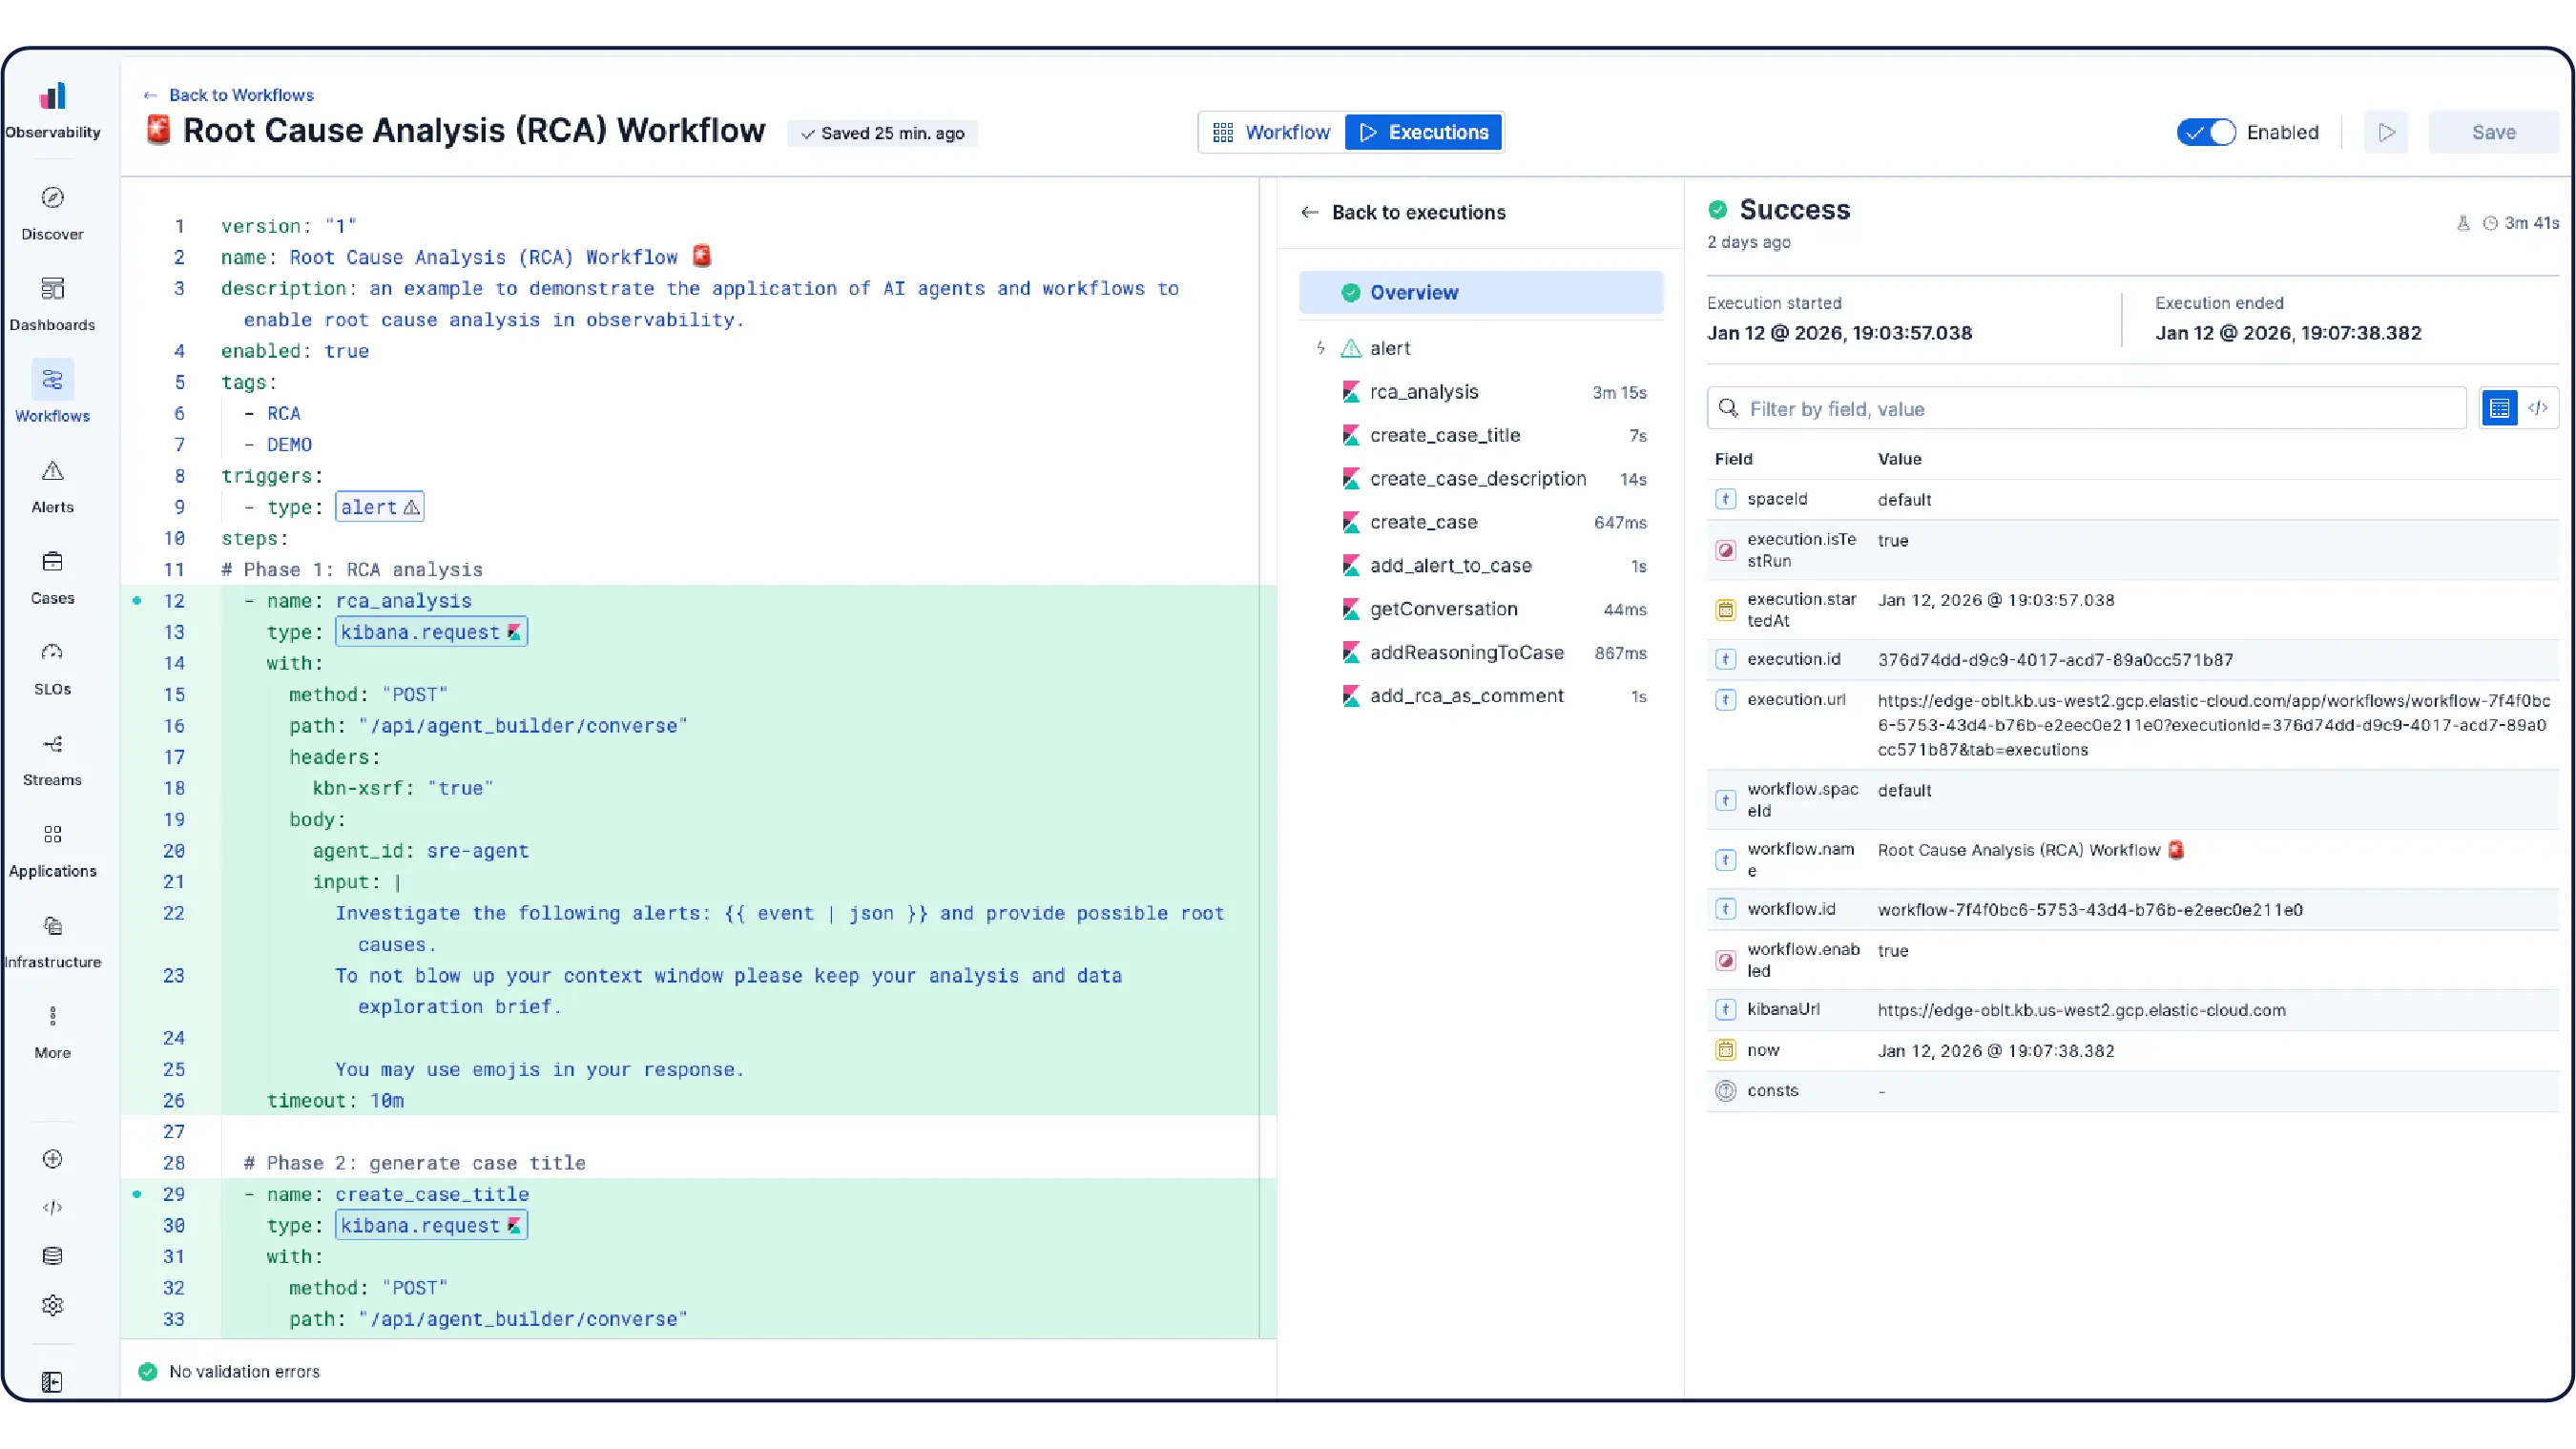
Elastic gives you rich contextual visibility into your infrastructure, highlights anomalies, uncovers trends, and executes remediation — all powered by AI — so you can plan capacity and resolve issues faster.
See why companies like yours choose Elastic Observability
Get log analytics at scale to turn messy logs into operational answers.
Customer spotlight

Comcast ingests 400 terabytes of data daily with Elastic to monitor services and accelerate root cause analysis, ensuring a top-notch customer experience.
Customer spotlight

Discover reduced storage costs by 50% and improved data retrieval times by implementing a centralized logging platform with Elastic.
Customer spotlight
Informatica cut costs and reduced MTTR by migrating its entire logging workload to Elastic for 100+ applications and 300+ Kubernetes clusters.


