Prometheus monitoring at scale with the Elastic Stack
Tools. As engineers we all love great tools that help our teams work productively, resolve problems faster, be better. But tools can tend to grow in number, require additional maintenance, and most importantly, create silos. Each team has certain responsibilities and is constantly searching for tools that can address specific requirements in the best possible way. As a result, teams become efficient as a single unit, but the byproduct of such performant autonomy is a lack of insight into other parts of the organization. Multiply this by the number of teams, and you’ll quickly see isolated clusters that dismiss a holistic view of how your business is doing.
Prometheus is a great example of such a tool. It has quickly grown to become the go-to tool for container systems monitoring and alerting. Its primary strength lies in efficient monitoring and storage of server-side metrics. Prometheus is fully open source and has a vibrant community that extends its coverage to many third party systems in a form of exporters. Like most specialized tools, Prometheus is intended to be simple and easy to operate. This simplicity comes with tradeoffs that are particularly relevant in cases of large-scale deployments and cross-team collaboration. In this blog we’ll examine some of these trade-offs and see how Elastic Stack can help resolve them.
Long-term data retention
Prometheus stores data locally within the instance. Having both compute and data storage on one node may make it easier to operate, but also makes it harder to scale and ensure high availability. As a consequence, Prometheus is not optimized to be a long-term metrics store. Depending on the size of your environment your optimal retention rate for time series in Prometheus can be as short as several days or even hours.
To retain Prometheus data in a scalable, durable way for extended analysis (e.g. seasonality of time series), you will need to complement Prometheus with a long term storage solution. And there are many solutions to choose from, such as other specialized TSDBs or columnar databases optimized for time series. These solutions, while being efficient for storing metrics, share one drawback, they’re specialized for only one type of data - metrics. Metrics are hugely important to help understand how your systems are behaving, however, they represent only one part of what makes systems observable.
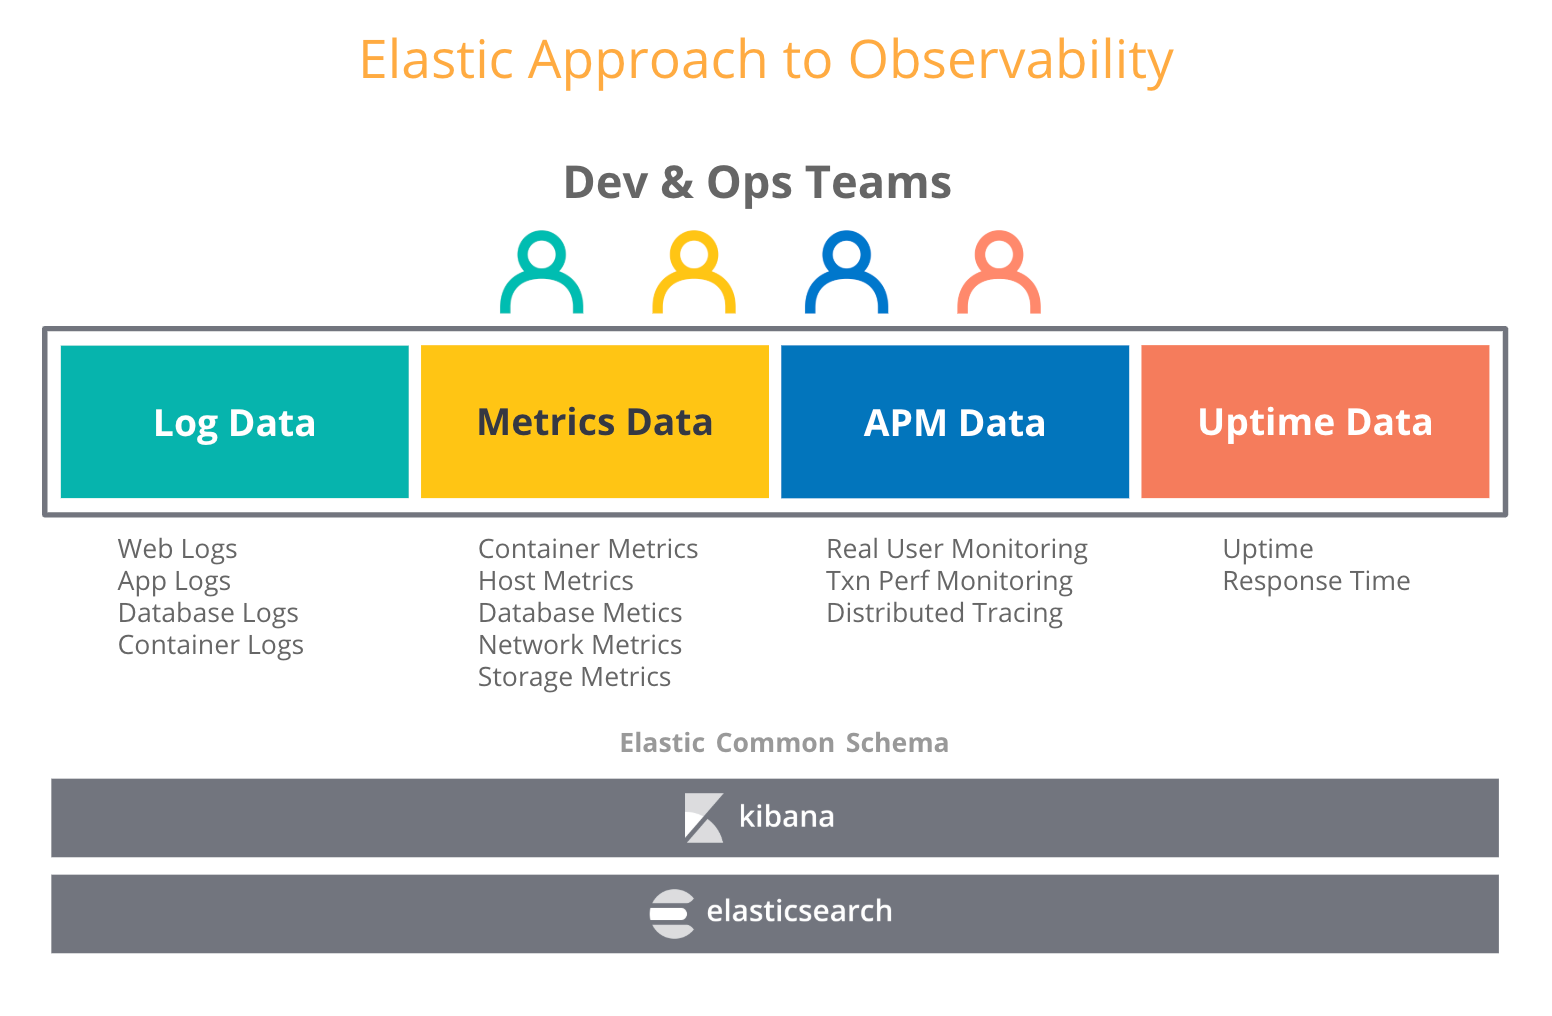
When users think about observability, they try to combine other types of operational data, such as logs and traces, with metrics. In our blog about observability in Elastic Stack, we talk about an increasing number of use cases where users that have adopted Elastic stack for logs, have also started putting metrics, traces, and uptime data into Elasticsearch. And no wonder -- Elasticsearch treats all these data types as just another index and allows you to aggregate, correlate, analyze and visualize all your operational data however you want. Features like data rollups in Elastic make it possible to store historical time series data at a fraction of the storage cost of raw data.
So what does this mean for choosing a long term storage for Prometheus? You can choose a dedicated metric store to achieve longer retention rates for your Prometheus metrics and potentially create another silo. Or, with the Elastic Stack you can combine the best of two worlds -- run Prometheus on the edge, and retain metrics as long as you want along with your other operational data in a scalable, centralized Elasticsearch deployment. That means long term storage and increased observability.
Centralized global view for Prometheus data
In a production setup you’re probably managing multiple Kubernetes clusters. Each cluster runs one or more Prometheus instances that can see health of nodes, pods, services and endpoints. Missing anything?
One Prometheus instance can cover a subset of resources in your environment. If you want to ask a question that requires querying metrics from multiple clusters there’s no straightforward way of doing that with Prometheus.

Using Elastic as a centralized store can help you consolidate data from hundreds of Prometheus instances and achieve a global view of data coming from all resources. The Prometheus module for Metricbeat can automatically scrape metrics from Prometheus instances, push gateways, exporters, and pretty much any other service that supports Prometheus exposition format. The best part is that you don’t have to change anything in your production environment - it’s pure plug-and-play.
High cardinality dimensions
Why does "high cardinality" matter? High cardinality lets you add arbitrary context to your metrics as tags or labels. In most cases, you want to retain this metadata, as it can be incredibly useful when debugging your services. All these trace IDs, request IDs, container IDs, version numbers, etc. will always tell you more about what’s happening in your systems.

Pure TSDBs are good at dealing with low-cardinality dimensions. The claimed storage efficiency that specialized TSDBs have over Elasticsearch relies heavily on low-cardinality dimensions. The Prometheus documentation strongly encourages against high-cardinality data:
CAUTION: Remember that every unique combination of key-value label pairs represents a new time series, which can dramatically increase the amount of data stored. Do not use labels to store dimensions with high cardinality (many different label values), such as user IDs, email addresses, or other unbounded sets of values.
Is it really good advice? In a distributed environment, debugging is a very complex task. Previously, with monoliths, debugging was a straightforward process of stepping through the application code. One could easily identify which monolithic module was the culprit causing the problem by looking at a few dashboards. This is no longer the case. The infrastructure software is in the midst of a paradigm shift. Containers, orchestrators, microservices, service meshes, serverless, lambdas - all of these are incredibly promising technologies that change the way we build and operate software. Consequently it becomes more distributed and debugging it can be compared to a detective job of finding where in the system you have the code with the problem.
High cardinality is not an issue for Elastic. Nothing should restrict users to add relevant context to their data. Thanks to its indexing capabilities, Elasticsearch can let users annotate metrics the way they want, with any metadata that can assist in finding contributing factors to help identify the root cause in as short a time as possible.
Security. Everywhere.
One of the things we’ve come to expect from good tools is that at the very least they don’t introduce security risks into our environments. Two fundamental building blocks for security in any distributed deployment are encrypted communication and access control.
At the time of writing this article the Prometheus server, Alertmanager, and the official exporters don’t support TLS encryption of the HTTP endpoints. In order to deploy these components in a secure way you’ll have to use a reverse proxy such as nginx and apply TLS encryption at the proxy layer. Any role based access control (RBAC) to metrics should also be handled externally rather than by the Prometheus server itself. The good news is that TLS and RBAC are not an issue if you’re running Prometheus inside a Kubernetes cluster as it provides both. In all other cases (e.g. running hundreds of Prometheus servers in geographically distributed or hybrid deployments) addressing these security concerns with third party tools is not a trivial task.
At Elastic, we take such risks very seriously and make security an integral part of our stack. Basic security options are part of our default distribution for free, and Elasticsearch provides multiple ways of securing access to your data in a cluster as well as encrypting traffic between the cluster and data shippers. In addition to RBAC, Elasticsearch supports fine-grained attribute-based access control (ABAC) mechanism, which enables you to restrict access to documents in search queries and aggregations. With the SSL configuration settings in Metricbeat you can make sure that your operational data travels securely irrespective of how large and distributed your environments are.
Streaming Prometheus metrics to Elasticsearch
You can start streaming metrics from Prometheus to Elasticsearch already now with Metricbeat. Using the prometheus module you can scrape metrics from either Prometheus servers, exporters or push gateways in several ways:
- If you’re already running Prometheus server and would like to directly query these metrics, you can start by connecting to the Prometheus server and pulling already collected metrics using either the /metrics endpoint or the Prometheus Federation API.

- If you don’t have Prometheus server or don’t mind scraping your exporters and push gateways in parallel by multiple tools you may connect to them directly.

Run Metricbeat as close as possible to your Prometheus server. You can choose a configuration that best fits your needs from our Prometheus and Open Standards blog.
Keeping an eye on the health of your Prometheus servers
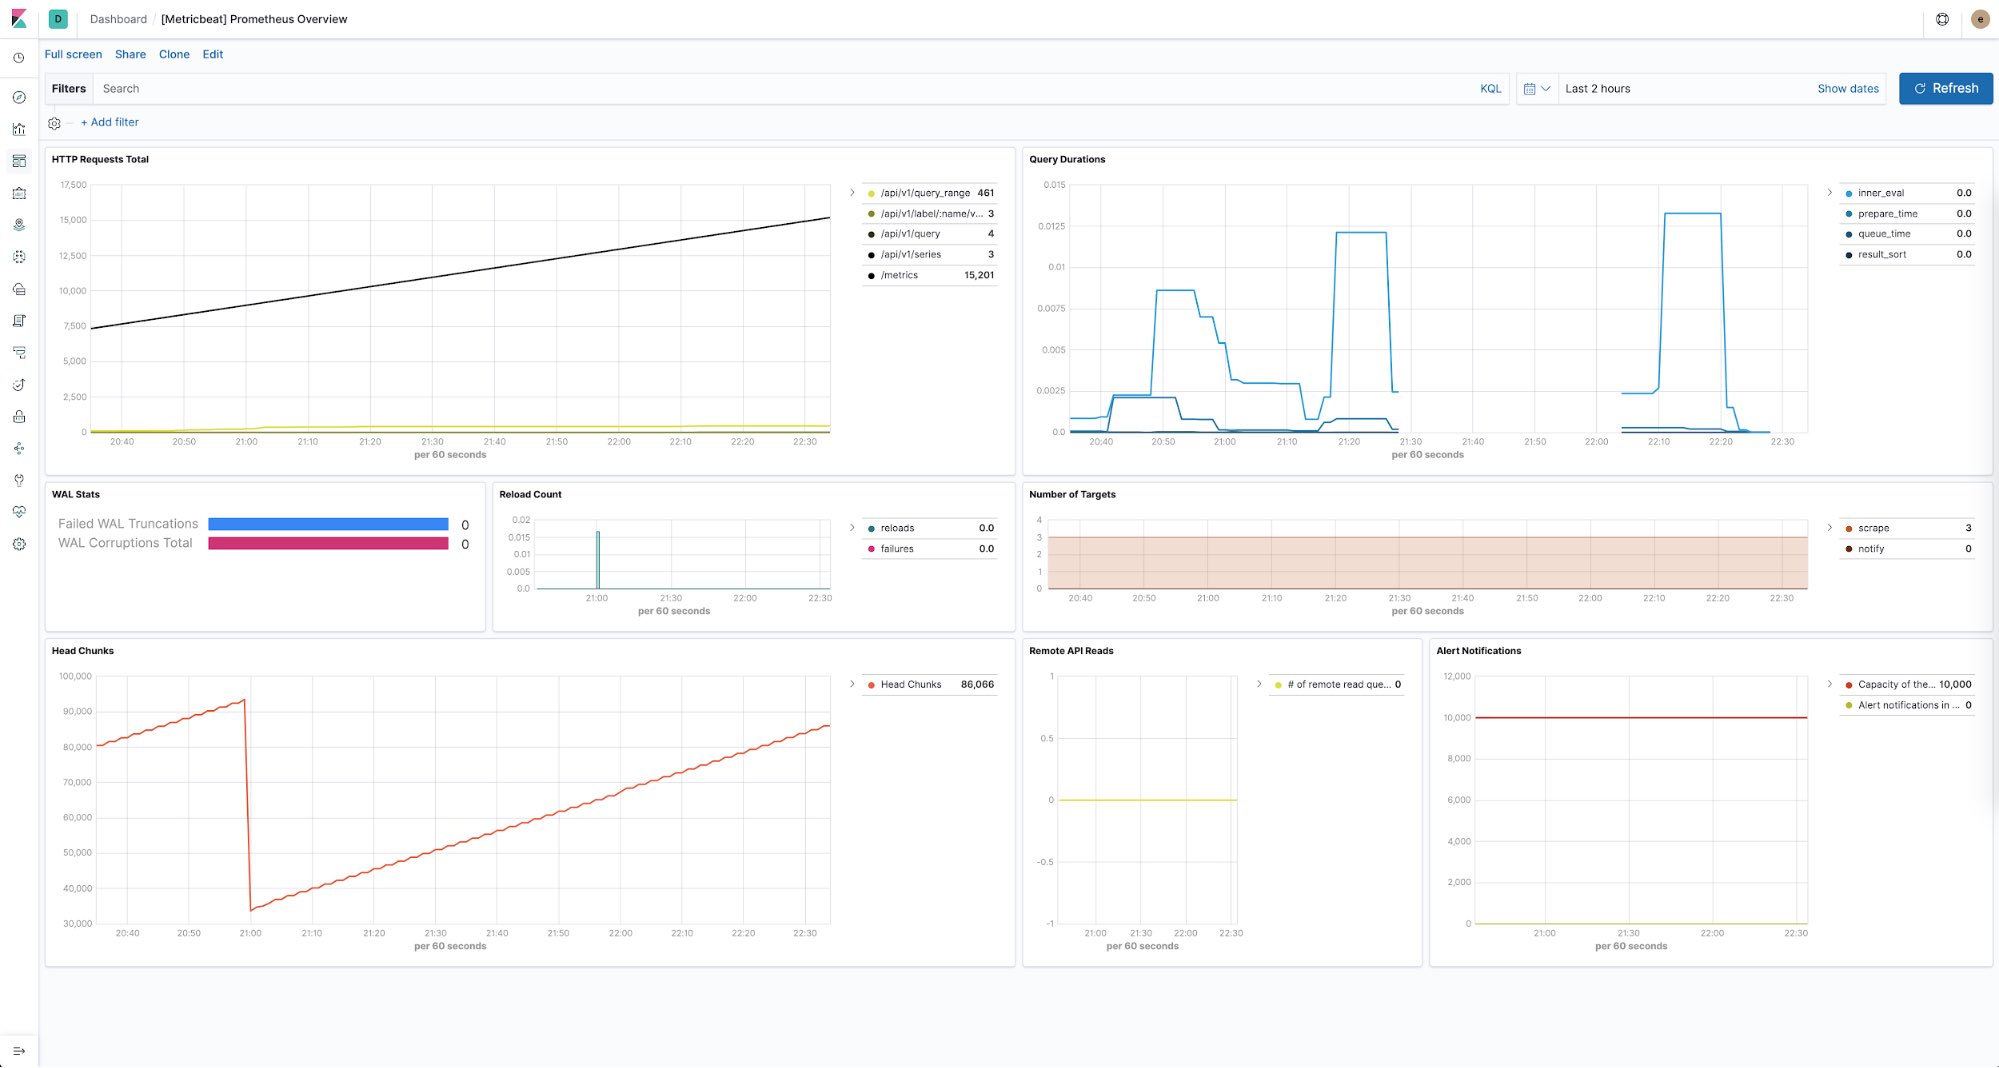
The Elastic Stack also provides a way to keep a pulse on the health of all of your Prometheus instances. You can use Metricbeat to collect and store performance metrics from each Prometheus server in your environments. With predefined dashboards provided out of the box you can easily see things like the number of HTTP requests per endpoint, duration of queries, number of discovered targets, and much more.
All things considered
At the end of the day, the goal is for you, your team, and your entire organization to be successful. All tools should be viewed as a means to an end. Every team should be free to choose whatever helps them to achieve their full potential. And when it comes to breaking down operational silos, we believe that Elastic Stack can help you build the ultimate observability platform where everyone in your org can securely access operational data, interact with it and be one team again.
You can learn more about how we work with time series data on our Elastic Metrics webpage. Try streaming your metrics to Elasticsearch Service - it’s the easiest and fastest way to get started. If you have any questions feel free to ping us on our Discuss forums.