Observability with the Elastic Stack
In my role as a Product Lead for Observability at Elastic, I get a few different reactions when I use the term 'observability'. The most common reaction by far today still is: "What is 'observability'?" But I also increasingly hear things like: "We just kicked-off an 'observability initiative', but we're still figuring out exactly how to go about it." And finally, some organizations we have been fortunate to work with already consider 'observability' an integral part of how they design and build products and services.
Given that the term is still gaining traction, I thought it would be useful to demystify how we at Elastic view 'observability', what we learned from our thought-leading customers, and how we think about it from the product perspective as we evolve our stack for operational use cases.
What is 'Observability'?
We certainly did not invent the term 'observability'. We started hearing about it from users, primarily those within the Site Reliability Engineering (SRE) community. Several sources trace back beginnings of this term to SRE organizations from Silicon Valley giants like Twitter. And even though the seminal Google SRE Book does not mention the term, it lays out many of the principles associated with 'observability' today.
'Observability' is not something that a vendor delivers in a box -- it is an attribute of a system you build, much like usability, high availability, and stability. The goal of designing and building an 'observable' system is to make sure that when it is run in production, operators responsible for it can detect undesirable behaviors (e.g. service downtime, errors, slow responses) and have actionable information to pin down root cause in an effective manner (e.g. detailed event logs, granular resource usage information, and application traces). Common challenges preventing organizations from achieving this seemingly obvious goals include not collecting enough information, collecting too much information, but not making it actionable, and fragmenting access to this information.
The first aspect — detection of undesirable behaviors — usually starts with setting of Service Level Indicators (SLIs) and Objectives (SLOs). These are internal measures of success by which production systems are judged in observability-minded organizations. If there is a contractual obligation to fulfill these objectives, an SLI/SLO may also translate to a Service Level Agreements (SLAs). The most common example of an SLI is system uptime, for which you may set an SLO of 99.9999%. System uptime is also the most common SLA exposed to external customers. However, your SLI/SLOs internally may be a lot more granular, and monitoring and alerting on these most important factors of production system behavior is the basis of any observability initiative. This aspect of observability is also known by the term "monitoring".
The second aspect — providing operators with granular information to debug production issues quickly and efficiently — is an area where we see a lot of movement and innovation. There is quite a bit of talk about the "three pillars of observability" — metrics, logs, and application traces. There is also recognition that simply collecting all this granular data using a patchwork of tools is not necessarily actionable and often not cost effective.
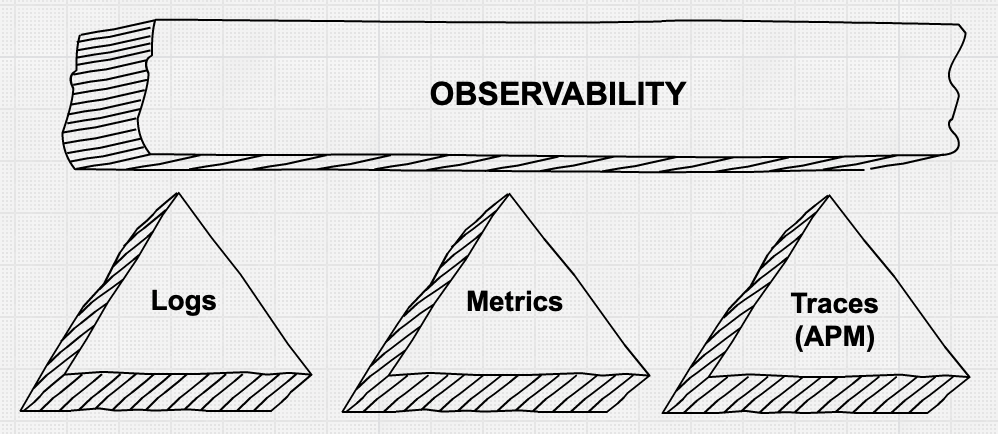
'Pillars' of Observability
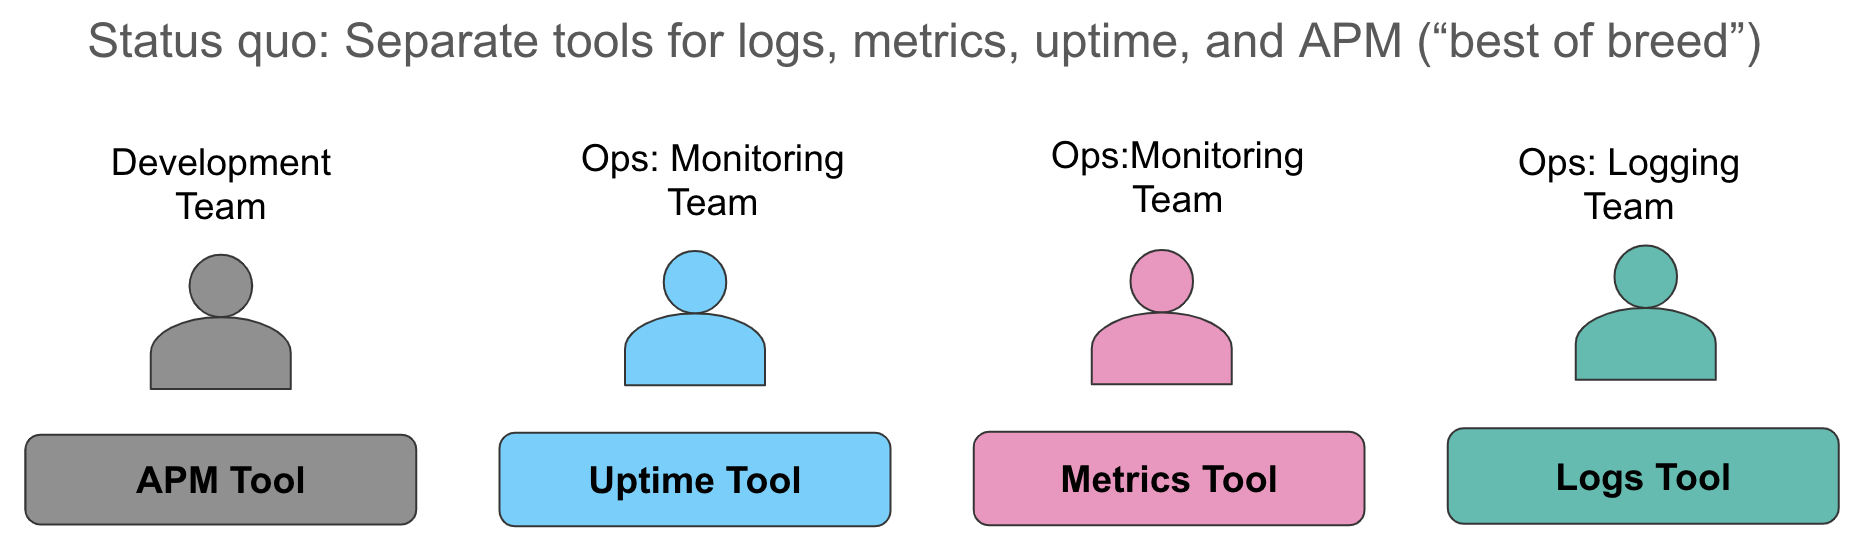
Let's examine these data collection aspects in more detail. The status quo we typically encounter today is to collect metrics into one system (usually a time series database or a SaaS service for resource monitoring), collect logs into a second system (unsurprisingly, often the ELK stack in our conversations), and to use yet a third tool to instrument applications to provide request level tracing. When an alert fires, indicating a breach in a service level, operators madly dart over to their systems and perform the best "swivel chair integration" they can -- looking at metrics in one browser window, manually correlating it to logs in another window, and pulling up traces (if relevant) in yet a third window.
This approach has several drawbacks. First, manual correlation of different data sources all telling the same story wastes valuable time during service degradation or outage. Second, operational costs of maintaining three different operational data stores are onerous — licensing costs, separate headcount for administrators of disparate operational tools, inconsistent machine learning capabilities in each datastore, "headspace" for thinking through different semantics for alerting — every organization I speak with struggles with all of these challenges.
There is an increasing recognition of how important it is to have all this information in a single operational store with the ability to automatically correlate this data in an intuitive user interface. Nirvana for the users we talk to is to expose their operators to every piece of data relevant to the service they are supporting in a unified way, whether it be a log line emitted by the application, trace data resulting from instrumentation, or resource utilization represented by metrics in a time series. Requirements we hear about stress uniform, ad-hoc access to this data regardless of the source, from search and filtering, to aggregations, to visualizations. Starting with metrics and drilling into logs and traces in a few clicks without switching context accelerates investigations. Similarly, extracting numerical values from structured logs looks surprisingly like metrics and visualizing both side-by-side has tremendous value from an operational perspective.
As mentioned before, simply collecting the data may result in too much information on disk and not enough actionable intelligence when an incident occurs. Increasingly, there is an expectation that the system collecting operational data provides automatic detection of "interesting" events, traces, and anomalies in the patterns of time series. This helps operators investigating a problem zero in on the root cause faster. These anomaly detection capabilities are sometimes referred to as the "fourth pillar of observability". Detecting anomalies across uptime data, resource utilization, anomalies in logging patterns, and most relevant traces is an emerging requirement observability teams put forth.
Observability... and the ELK Stack?
So what does observability have to do with the Elastic Stack (or ELK Stack, as it's lovingly referred to in operational circles)?
ELK Stack is widely known as the de facto way to centralize logs from operational systems. The assumption is that Elasticsearch (a "search engine") is a good place to put text-based logs for the purposes of free-text search. And indeed, simply searching text-based logs for the word "error" or filtering logs based on a set of a well-known tags is extremely powerful, and is often where most users start.
However, as most ELK Stack users know, Elasticsearch as a datastore offers a lot more than an inverted index for efficient full-text search and simple filtering abilities. It also contains a columnar store optimized for storing and operating on dense numerical time series. This columnar store is used to store structure data extracted from parsed logs, both string and numerical. In fact, the use case of converting logs to metrics is what initially drove us to optimize Elasticsearch for efficient storage and retrieval of numbers.
Over time, users started putting numerical time series directly into Elasticsearch, replacing legacy time series databases. Driven by this need, Elastic recently introduced Metricbeat for automated collection of metrics, the concept of automatic rollups, and other metrics-specific functionality both in the datastore and the UI. As a result, increasingly more users that have adopted the ELK Stack for logs, have also started putting metric data, such as resource utilization, into the Elastic Stack. In addition to operational savings already mentioned above, one attractive reason for this was lack of restrictions Elasticsearch places on cardinality of fields eligible for numerical aggregations (a common gripe brought up when discussing many existing time series databases).
Similar to metrics, uptime data has been a highly valued type of data alongside logs, representing an important source of SLO/SLI alerts from an active monitor. Uptime data can provide information about degradation of services, APIs, and websites, oftentimes before the users feel the impact. The bonus is that uptime data is tiny in terms of storage requirements, so a lot of value for very little additional cost.
Within the past year Elastic has also introduced Elastic APM, adding application tracing and distributed tracing capabilities to the stack. This was a natural evolution for us, as several open-source projects and prominent APM vendors were already using Elasticsearch to store and search trace data. Status quo in traditional APM tools is to keep APM trace data separate from logs and metrics, perpetuating operational data silos. Elastic APM offers a set of agents for collecting trace data from supported languages and frameworks as well as supporting OpenTracing, and this trace data is automatically correlated with the metrics and logs.
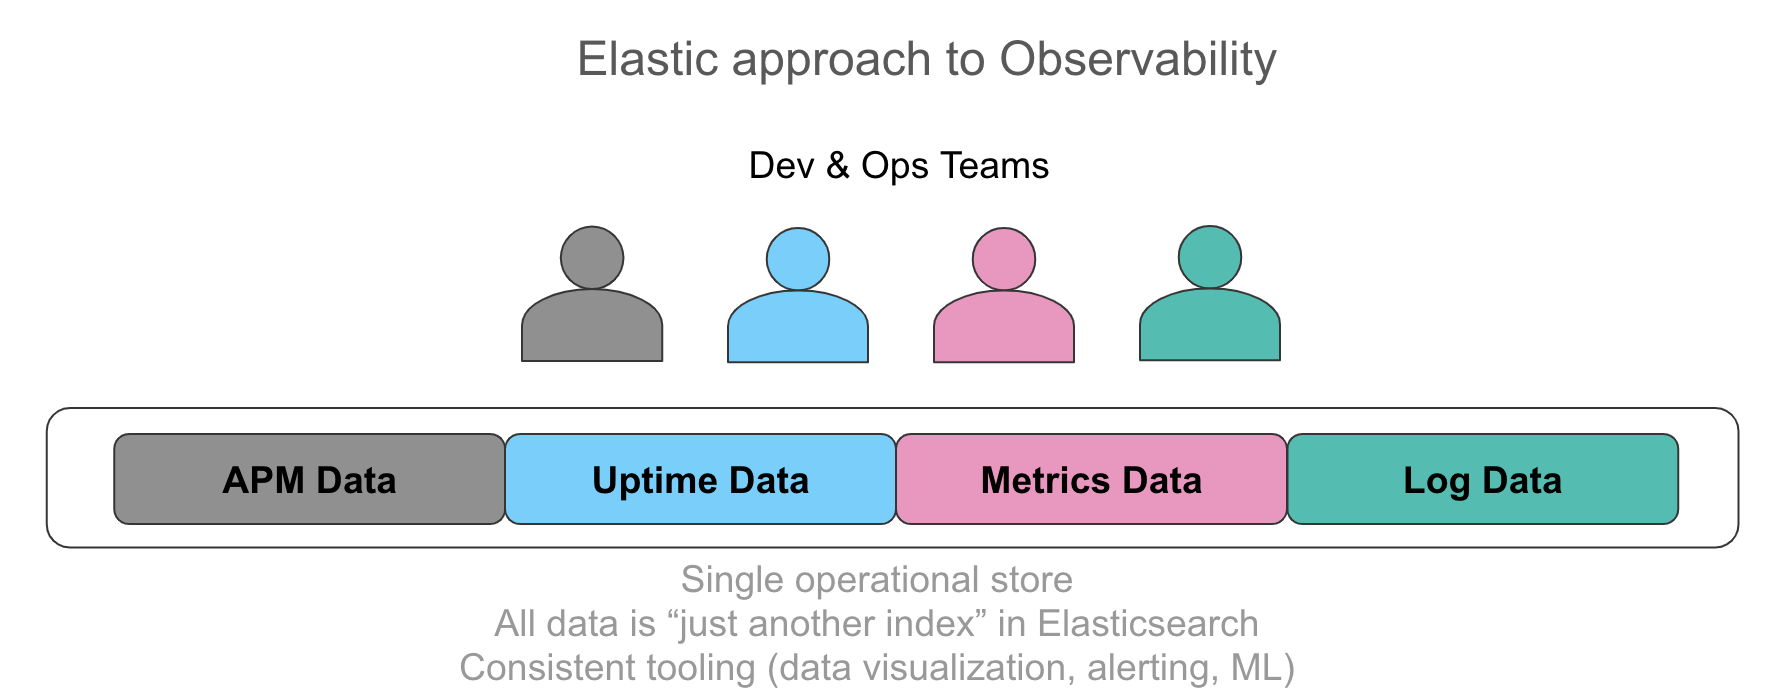
A common thread across all these data inputs is that each of them is just another index in Elasticsearch. There are no restrictions on aggregations you run on all this data, how you visualize it in Kibana, and how alerting and machine learning applies to each data source. To see this in action, check out this video.
Observable Kubernetes and the Elastic Stack
One community where the concept of observability is a very active topic of conversation is the set of users adopting Kubernetes for container orchestration. These "cloud native" users, a term popularized by the Cloud Native Computing Foundation (or CNCF), face unique challenges. They face a massive centralization of applications and services built on or migrated to a Kubernetes-powered container orchestration platform, coupled with the trend to split up monolithic apps into "microservices". Tools and methods that worked before to provide necessary visibility into applications running on top of this infrastructure no longer work.
Kubernetes observability deserves a separate post all on its own, so for now I will refer you to the Observable Kubernetes webinar and the Distributed Tracing with Elastic APM blog post for more information.
What's next?
In a post like this, it seems appropriate to leave the reader with a few resources to explore.
To learn more about observability best practices, I recommend starting with the above-mentioned Google SRE Book. Blog posts from companies whose livelihood depends on flawless operation of their critical apps in production are also typically very thought-provoking. For example, I find this recent post by Salesforce engineering to be a pragmatic and practical guide to iteratively improving the state of observability.
To try out Elastic Stack capabilities for your observability initiatives, spin up the latest version of our stack on the Elasticsearch Service on Elastic Cloud (great sandbox even if ultimately you deploy self-managed), or download and install Elastic Stack components locally. Make sure to check out the new Logs, Infrastructure monitoring, APM, and Uptime (coming soon in 6.7) UIs in Kibana, purpose-built for common observability workflows. And feel free to ping us with questions on Discuss forums — we're there to help!