Distributed Tracing, OpenTracing and Elastic APM
The World of Microservices
Enterprises are increasingly adopting microservice architectures. They are developing and deploying more microservices everyday. Often, these services are developed in different programming languages, deployed into separate runtime containers, and managed by different teams and organizations. Large enterprises like Twitter can have tens of thousands of microservices, all working together to achieve their business goals. As they discussed in this Twitter blog post, visibility into the health and performance of the diverse service topology is extremely important for them to be able to quickly determine the root cause of issues, as well as increasing Twitter’s overall reliability and efficiency.
This is where Distributed Tracing can really help. Distributed Tracing helps with two fundamental challenges faced by microservices:
- Latency tracking
One user request or transaction can travel through many different services in different runtime environments. Understanding the latency of each of these services for a particular request is critical to the understanding of the overall performance characteristics of the system as a whole, and provides valuable insight for possible improvements. - Root cause analysis
Root cause analysis is even more challenging for applications that build on top of large ecosystems of microservices. Anything can go wrong with any of the services at any time. Distributed tracing is of crucial importance when debugging issues in such a system.
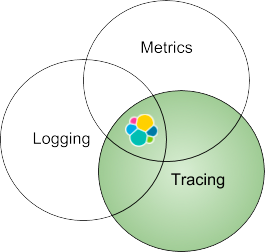
Take a step back, tracing is only one piece of the puzzles of the Three Pillars of Observability - Logging, Metrics and Tracing. As we will discuss briefly, Elastic Stack is a unified platform for all three pillars of observability. When logs, metrics, and APM data are stored in the same repository, analyzed, and correlated together, you gain the most context-rich insight into your business applications and systems. In this blog, we will solely focus on the tracing aspect.
Distributed Tracing with Elastic APM
Elastic APM is an application performance monitoring system built on the Elastic Stack. It allows you to monitor software services and applications in real time, collecting detailed performance information on response time for incoming requests, database queries, calls to caches, external HTTP requests, etc. Elastic APM agents offer rich auto-instrumentation out of the box (e.g. timing db queries, etc.) for supported frameworks and technologies. You can also use custom instrumentation for custom purposes. This makes it much easier to pinpoint and fix performance problems quickly.
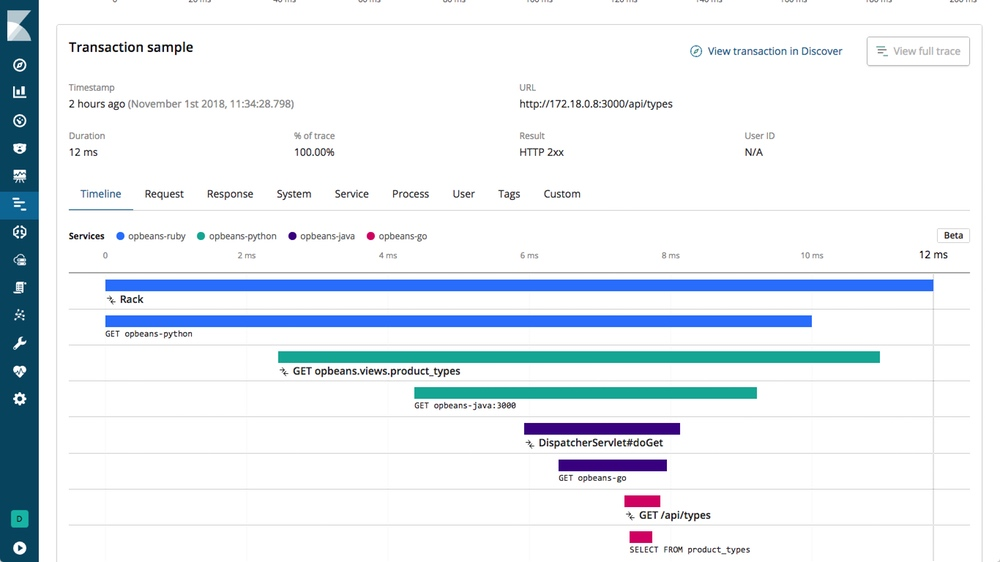
Elastic APM supports distributed tracing and is OpenTracing compliant. It enables you to analyze performance throughout your microservice architecture all in one view. Elastic APM accomplishes this by tracing all of the requests, from the initial web request to your front-end service, to queries made to your back-end services. This makes finding possible bottlenecks throughout your application much easier and faster. The Timeline visualization in APM UI shows a waterfall view of all of the transactions from individual services that are connected in a trace:
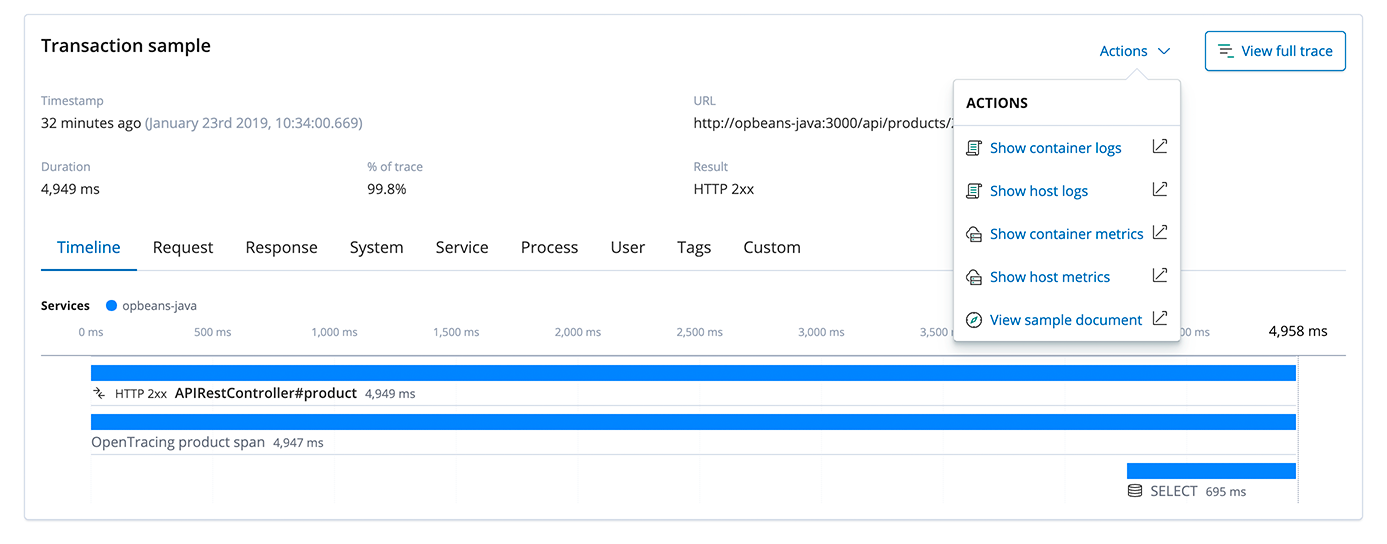
Elastic Stack is also a great platform for log aggregation and metrics analytics. Having logs, metrics, and APM traces all stored and indexed in Elasticsearch is super powerful. Being able to quickly correlate data sources like infrastructure metrics, logs and traces enables you to debug the root cause much faster. In the APM UI, when looking at a trace, you can quickly jump to the host or container metrics and logs by clicking the Actions menu, if these metrics and logs are also collected.
It would be wonderful if everybody was using Elastic APM to instrument their applications and services. However, Elastic APM is not the only distributed tracing solution available today. There are other popular open source tracers like Zipkin and Jaeger. Concepts like polyglot programming and polyglot persistence are well known and well accepted in the world of microservices. Similarly, “polyglot tracing” is going to be more common than not. Because of the independent and decoupled nature of microservices, people responsible for different services will likely use different tracing systems.
Challenges for Developers
With many different tracing systems available, developers are faced with real challenges. At the end of the day, tracers live inside the application code. Some common challenges are:
- Which tracing system to use?
- What if I want to change my tracer? I don’t want to change my entire source code.
- What do I do with shared libraries that might be using different tracers?
- What if my third-party services use different tracers?
Not surprisingly, we need standardization to address these concerns. Before discussing where we are with the standardization, let’s take a step back and look at distributed tracing from an architectural perspective in a holistic manner and understand what’s required to achieve the distributed tracing “nirvana”.
Architectural Components of Distributed Tracing
Modern software systems can be broken down into a few high-level components, typically designed and developed by different organizations and run in different runtime environments.
- Your own application code and services
- Shared libraries and services
- External services
To monitor such a system in a holistic and integrated fashion with distributed tracing, we need four architectural components:
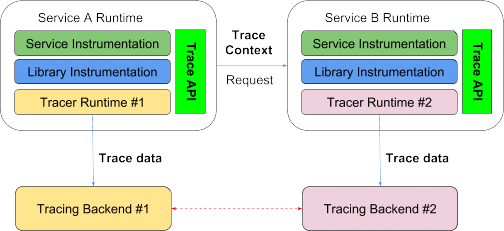
- Standardized distributed tracing API. A standardized vendor-neutral tracing API allows developers to instrument their code in a standardized way, does not matter what tracer they might choose to use later during the runtime. This is the first step towards anything.
- Standardized tracing context definition and propagation. For a trace to go across from one runtime to another, the tracing context has to be understood by both parties, and there has to be a standard way of propagating that context. At the minimum, the context carries a trace ID.
- Standardized tracing data definition. For trace data from one tracer to be understood and consumed by another tracer there has to be a standardized and extensible format for it.
- Interoperable tracers. Finally, to achieve 100% runtime compatibility, different tracers have to provide mechanisms for them to both export and import trace data from other tracers in an open way. Ideally, a shared library or service instrumented by a tracer like Jaeger should be able to have it’s tracing data sent directly to Elastic APM or another tracer via the Jaeger agent through a configuration change.
Now, enter OpenTracing.
The OpenTracing Specification
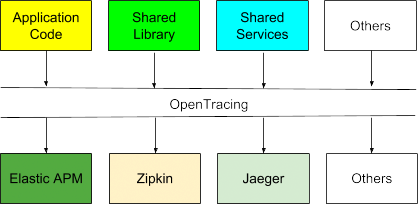
The OpenTracing specification defines an open, vendor-neutral API for distributed tracing. It enables users to avoid vendor lock-in by allowing them to switch the OpenTracing implementer at any time. It also enables developers of frameworks and shared libraries to provide tracing functionality out of the box, in a standard fashion to enable better insights into the frameworks and libraries. Web-scale companies like Uber and Yelp are using OpenTracing to get deeper visibility into their highly distributed and dynamic applications.
The OpenTracing Data Model
Basic concepts of OpenTracing and the fundamental data model came from Google’s Dapper paper. Key concepts include trace and span.
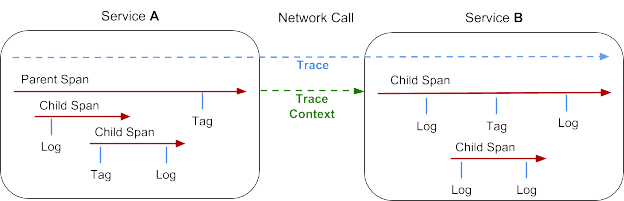
- A trace represents a transaction as it moves through a distributed system. It can be thought of as a directed acyclic graph of Spans.
- A span represents a logical unit of work that has a name, start time, and duration. Spans may be nested and ordered to model relationships. Spans accept key:value tags as well as fine-grained, time-stamped, structured logs attached to the particular span instance.
- Trace context is the trace information that accompanies the distributed transaction, including when it passes the service to service over the network or through a message bus. The context contains the trace identifier, span identifier, and any other data that the tracing system needs to propagate to the downstream service.
How does it all fit in?
Ideally, with standardization, tracing information from custom application code, shared libraries, and shared services developed and run by different organizations are exchangeable and runtime compatible, does not matter what tracer each of these components chose to use.
However, OpenTracing only addresses the first of the four architectural components we discussed before. So, where are we today with other components and what the future holds for us?
Where are We Today?
As we discussed, OpenTracing defines a standard set of tracing APIs for different tracers to implement, which is a great start and very encouraging. However, we still need tracing context standardization and tracing data standardization for them to be compatible and exchangeable with each other.
- OpenTracing API provides a standard set of APIs. This is pretty much the only standardization we have as of today. There is limitation to the specification too. For example, it does not cover all the programming languages. Nevertheless, it’s a wonderful effort and gaining great traction.
- No standardized tracing context definition yet. The W3C Distributed Tracing Work Group is in the process of standardizing the tracing context definition - the W3C Trace Context specification. The specification defines a unified approach to context and event correlation within distributed systems, and will enable end-to-end transaction tracing within distributed applications across different monitoring tools. Elastic APM supports the W3C Trace Context working group's effort to standardize the HTTP header format for distributed tracing. Our agent implementations closely follow the Trace Context draft specification, and we intend to fully support the final specification.
As an example of the incompatibility of the tracing context today, here is an example of the HTTP header used by Elastic APM and Jaeger for trace ID. As you can see, both the name and encoding of the ID are different. When different tracing headers are used, traces will break when they cross the boundaries of the respective tracing tools.
Jaeger:
uber-trace-id: 118c6c15301b9b3b3:56e66177e6e55a91:18c6c15301b9b3b3:1
Elastic APM:
elastic-apm-traceparent: 00-f109f092a7d869fb4615784bacefcfd7-5bf936f4fcde3af0-01
There are other challenges too, other than the definition itself. For example, not all HTTP headers are automatically forwarded by service infrastructure and routers etc. Whenever headers are dropped, the trace will break. - No standardized tracing data definition yet. As stated by the W3C Distributed Tracing Work Group, the second piece of the puzzle for trace interoperability is “a standardized and extensible format to share trace data -- full traces or fragments of traces -- across tools for further interpretation”. As you can imagine, with many open source and commercial players involved, agreeing on a standard format is not an easy thing. Hopefully we will get there soon.
- Tracers are not runtime-compatible. Because of everything we discussed above, plus mixed motivation of making their system open and compatible with the rest of the world, tracers are simply not compatible with each other during the runtime today. I can confidently say that it will probably be that way for the foreseeable future.
How Elastic APM Works with Other Tracers Today
Even though we are not even close to 100% compatibility among tracers yet today, there is no need to be discouraged. Elastic Stack can still work with other tracers in a couple of different ways.
- Elasticsearch as the scalable backend data store for other tracers.
Not surprisingly, Elasticsearch has been used as the backend data store for other tracers like Zipkin and Jaeger, due to its massive scalability and rich analytics capabilities. Shipping Zipkin or Jaeger tracing data into Elasticsearch is a simple configuration for both of them. Once the tracing data is inside Elasticsearch, you can use the powerful analytic and visualization capability of Kibana to analyze your tracing information and create eye-catching visualizations that provide deep insight into your application performance. - Elastic OpenTracing Bridge
The Elastic APM OpenTracing bridge allows you to create Elastic APM Transactions and Spans, using the OpenTracing API. In other words, it translates the calls to the OpenTracing API to Elastic APM and thus allows for reusing existing instrumentation. For example, an existing instrumentation done by Jaeger can be simply replaced with Elastic APM by changing a couple of lines of code.
Original instrumentation by Jaeger:import io.opentracing.Scope;
Replace Jaeger with Elastic OpenTracing bridge:
import io.opentracing.Tracer;
import io.jaegertracing.Configuration;
import io.jaegertracing.internal.JaegerTracer;
...
private void sayHello(String helloTo) {
Configuration config = ...
Tracer tracer = config.getTracer();
try (Scope scope = tracer.buildSpan("say-hello").startActive(true)) {
scope.span().setTag("hello-to", helloTo);
}
...
}import io.opentracing.Scope;
import io.opentracing.Tracer;
import co.elastic.apm.opentracing.ElasticApmTracer;
...
private void sayHello(String helloTo) {
Tracer tracer = new ElasticApmTracer();
try (Scope scope = tracer.buildSpan("say-hello").startActive(true)) {
scope.span().setTag("hello-to", helloTo);
}
...
}
With this simple change, the tracing data will be happily flowing into Elastic APM, without you having to modify other tracing code. That’s the power of OpenTracing!
Elastic APM Real User Monitoring
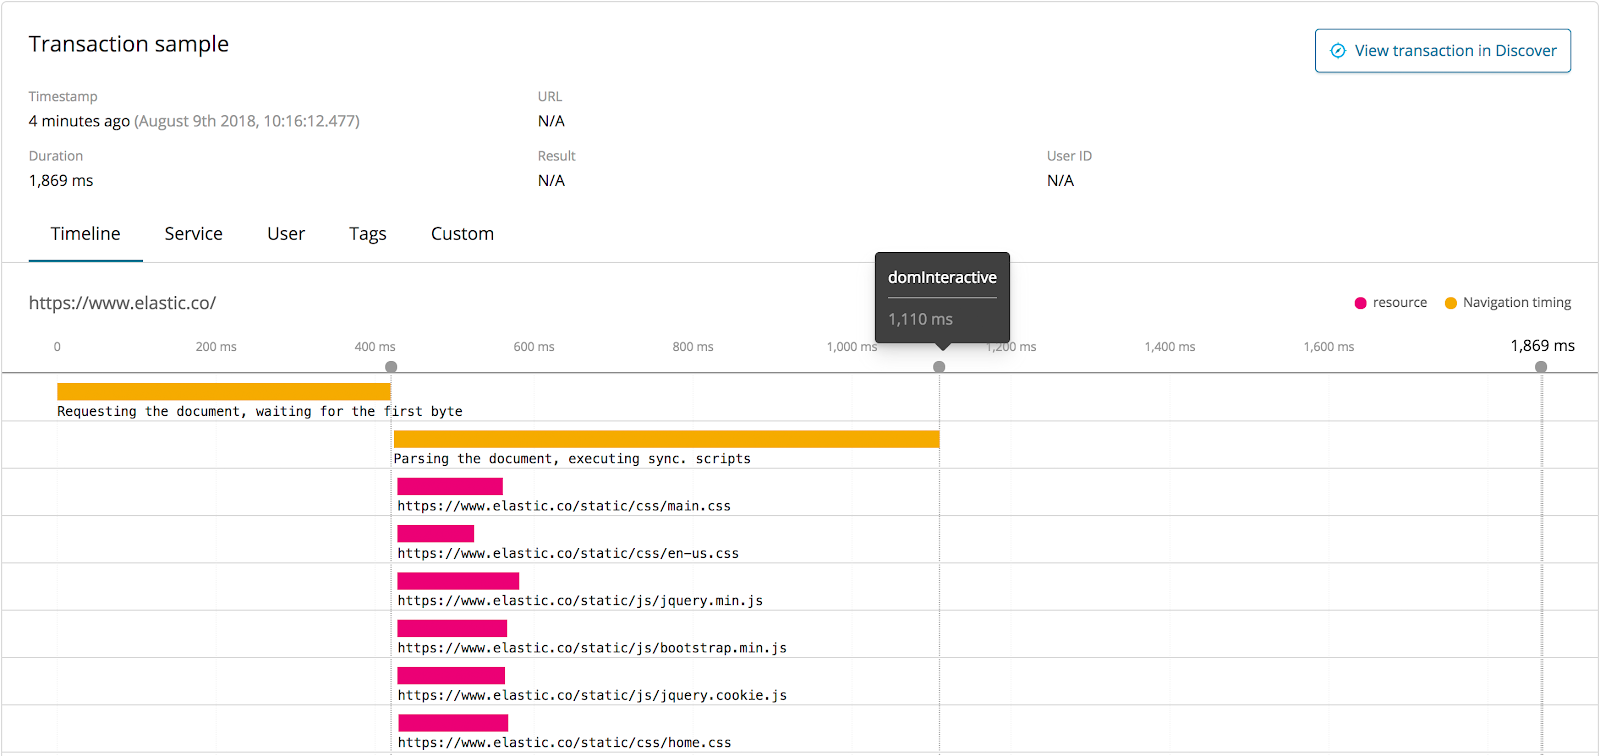
While we mostly focus on the backend services when discussing tracing and context propagation etc., there is great value to start the trace on the client side in the browser. When doing so, you get trace information the moment a user clicks on something in the browser. That trace information represents the “real user experience” of your applications from performance aspect. Unfortunately again, there is no standardized way of forwarding that information today. The W3C group does intend to extend the trace context all the way to the browser in the future.
Elastic APM Real User Monitoring (RUM) provides exactly that functionality today. The RUM JS agent monitors the real user experience within your client-side application. You will be able to measure metrics such as "Time to First Byte", domInteractive, and domComplete which helps you discover performance issues within your client-side application as well as issues that relate to the latency of your server-side application. Our RUM JS agent is framework-agnostic which means that it can be used with any JavaScript-based frontend application.
Summary
Hopefully, this blog helped you understand the landscape of Distributed Tracing a bit better and clarified some of the confusions about where we are with OpenTracing today. Let’s call it a wrap with a brief summary:
- Distributed tracing provides invaluable performance insight for microservices.
- OpenTracing is the industry’s first step towards standardization for distributed tracing. We still have a long way to go for full compatibility.
- Elastic APM is OpenTracing compliant.
- Elastic OpenTracing bridge allows instrumentation reuse.
- Elastic Stack is a great scalable long-term storage for other tracers like Zipkin and Jaeger, even without full runtime compatibility today.
- Elastic provides rich analytics for tracing data Elastic or not. Shipping Zipkin or Jaeger tracing data into Elasticsearch is a simple configuration.
- Elastic APM Real User Monitoring (RUM) monitors the real user experience within your client-side application.
- All-in-all, Elastic is a massively scalable, feature-rich, and unified analytics platform for all three pillars of observability - logging, metrics & tracing.
As always, reach out on the Elastic APM forum if you want to open up a discussion or have any questions. Happy tracing!