IMPORTANT: No additional bug fixes or documentation updates
will be released for this version. For the latest information, see the
current release documentation.
Prometheus module
edit
IMPORTANT: This documentation is no longer updated. Refer to Elastic's version policy and the latest documentation.
Prometheus module
editThis module periodically scrapes metrics from Prometheus exporters.
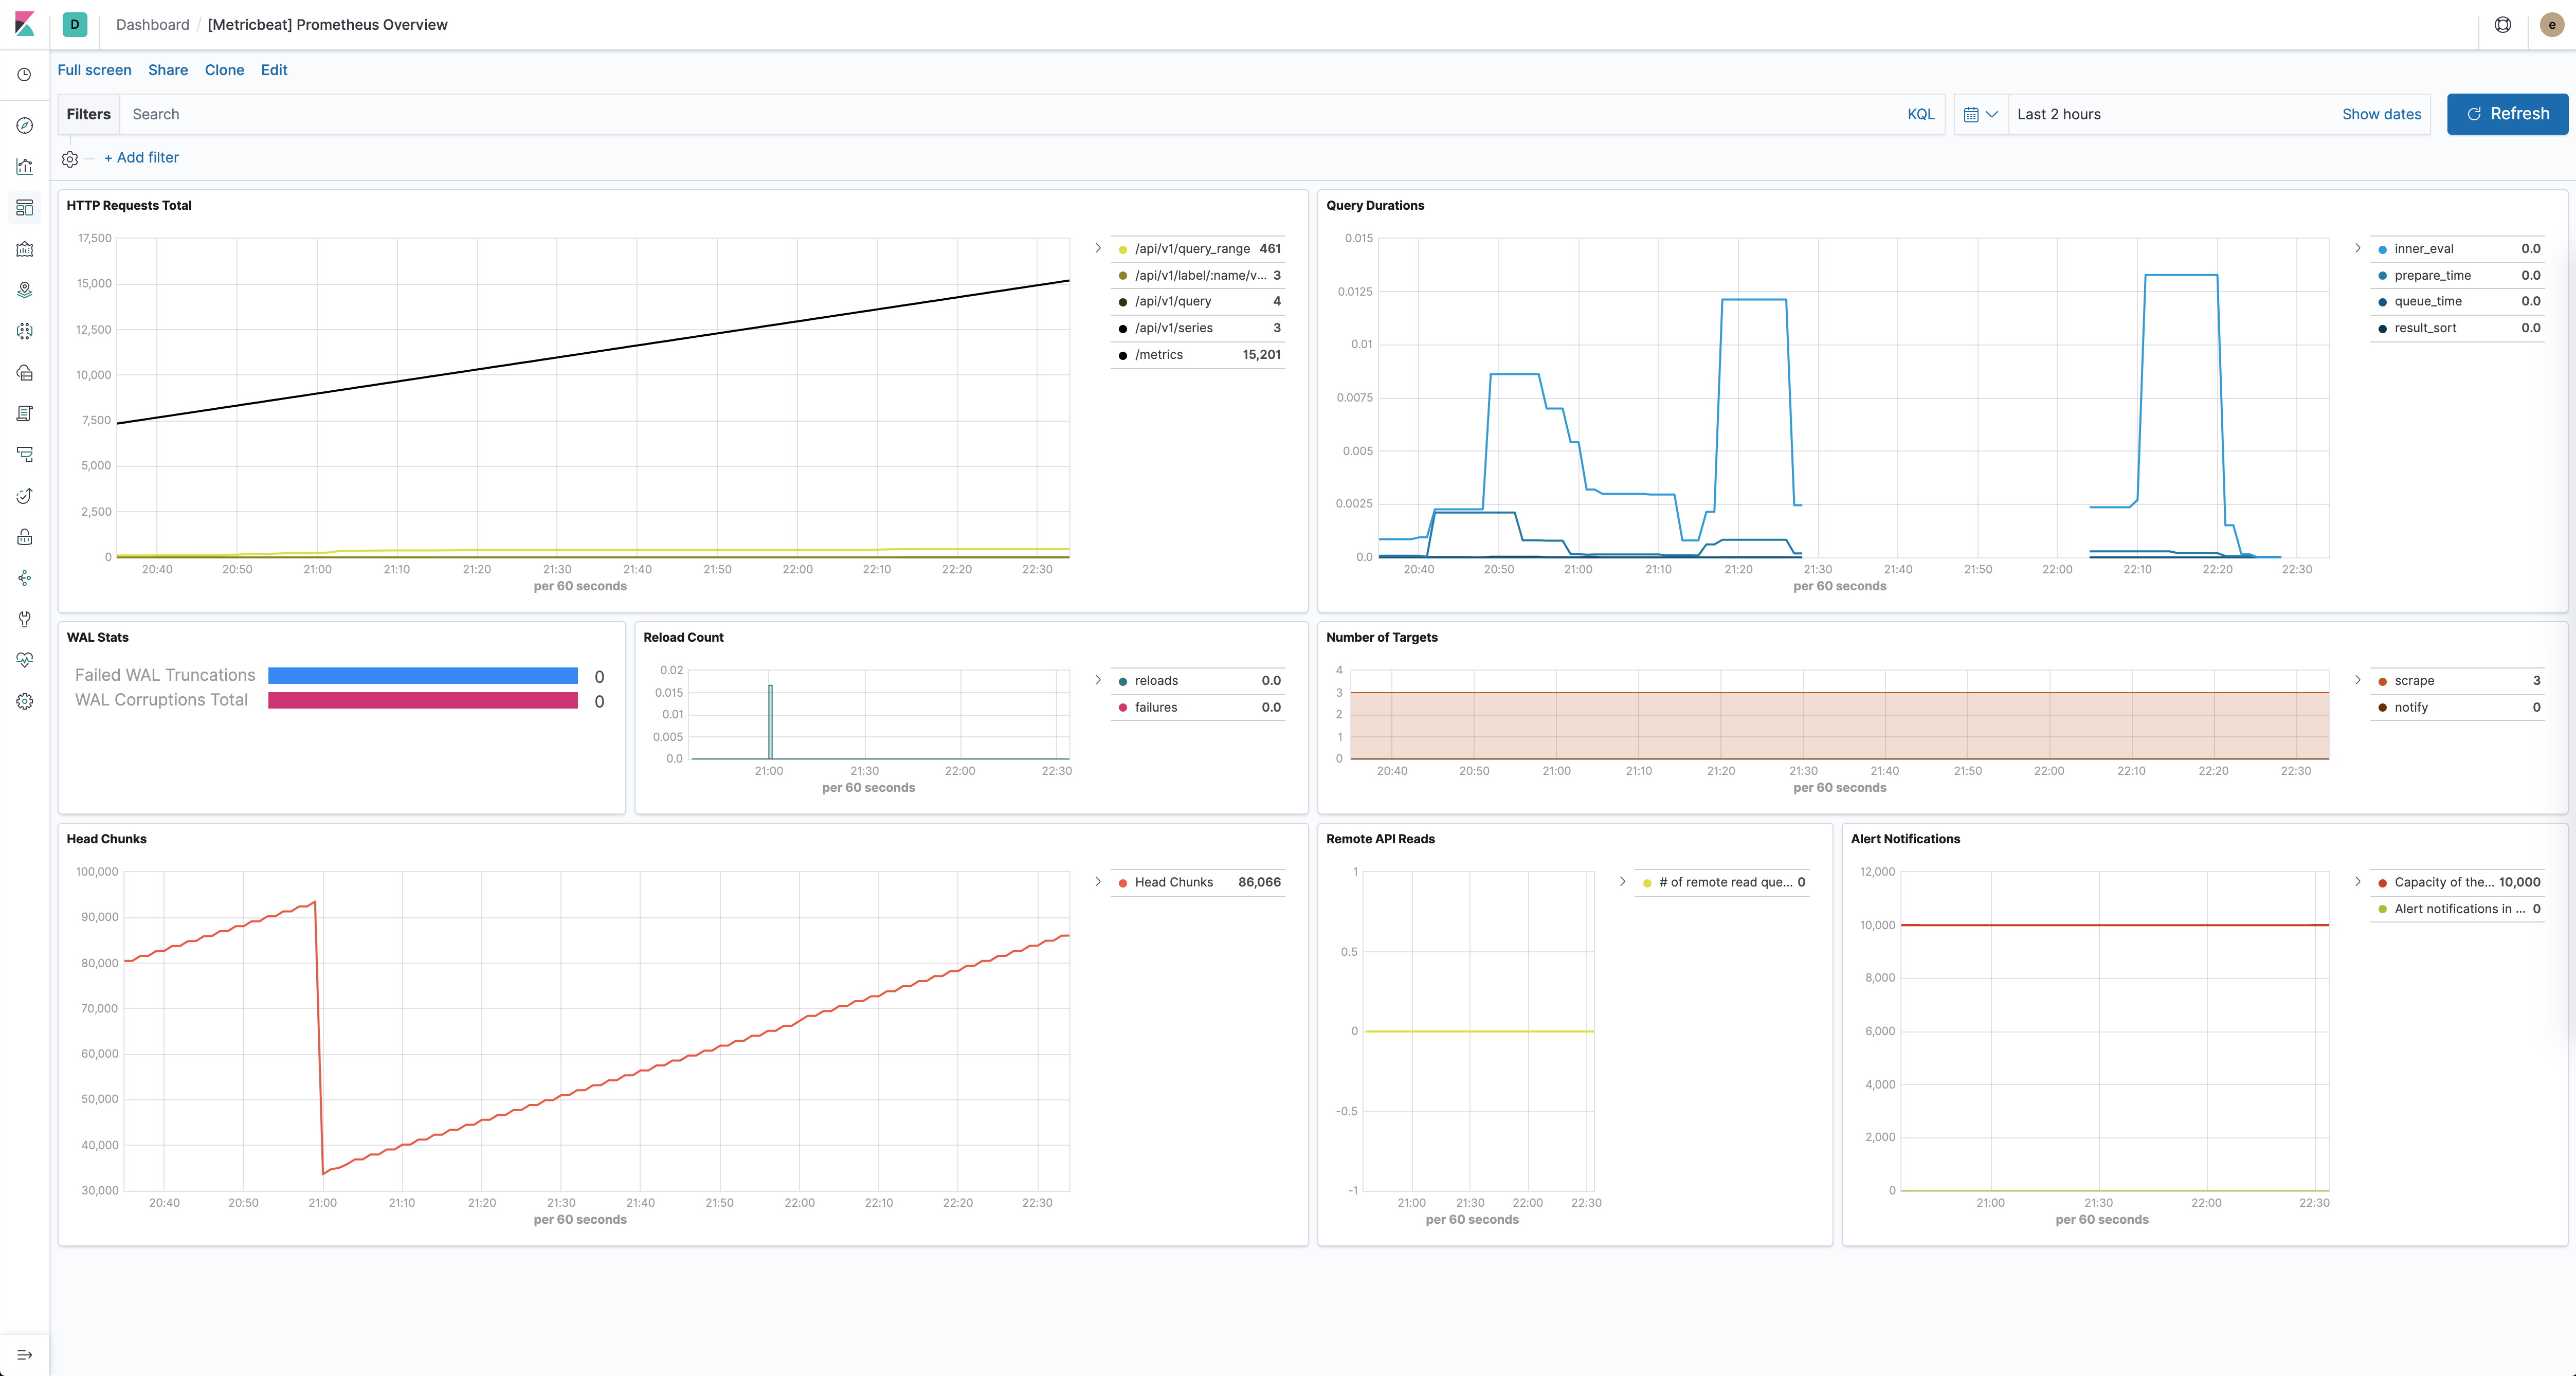
Dashboard
editThe Prometheus module comes with a predefined dashboard for Prometheus specific stats. For example:
Example configuration
editThe Prometheus module supports the standard configuration options that are described in Specify which modules to run. Here is an example configuration:
metricbeat.modules:
- module: prometheus
  period: 10s
  hosts: ["localhost:9090"]
  metrics_path: /metrics
  #username: "user"
  #password: "secret"

  # This can be used for service account based authorization:
  #bearer_token_file: /var/run/secrets/kubernetes.io/serviceaccount/token
  #ssl.certificate_authorities:
  #  - /var/run/secrets/kubernetes.io/serviceaccount/service-ca.crt
This module supports TLS connections when using ssl config field, as described in Specify SSL settings.
It also supports the options described in Standard HTTP config options.
Metricsets
editThe following metricsets are available: