Elastic Metrics
Already using the Elastic Stack for logs? Add infrastructure metrics in just a few steps. Elasticsearch takes what you love about its log search superpowers and applies them to metrics from multiple sources, across your entire infrastructure.

Get started with tracking your infrastructure logs and metrics in the Elastic Stack.
Watch videoSee how to get your observability initiative up and running quickly with Elasticsearch Service.
Watch videoLearn the fundamentals for working with metric data and the Elastic Stack.
View trainingNew
In 7.10, you can add anomaly detection for pods and hosts in a few clicks. Plus, it introduces a new Google Cloud billing module.
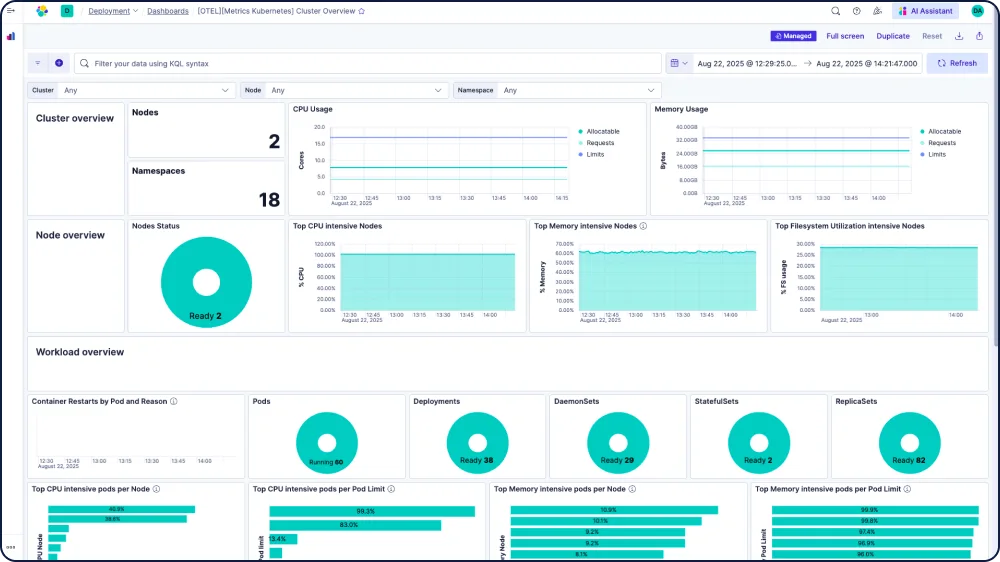
Whether you are monitoring servers, Docker containers, Kubernetes orchestration, Prometheus-style metrics, or application telemetry, there is a Metricbeat module that will get you started in minutes. And the best part is that data is natively correlated with your logs. Explore all the out-of-the-box metrics integrations.


Run wild with dimensions, tags, cardinality, and fields. Elastic doesn’t limit or dictate how you explore your data. Instead, you can continuously and quickly explore attributes — host name, IP address, tags — at scale in any way you like, in any order you like, in the visualization you like. Plus, Beats and their modules do the collecting, parsing, and tagging for you. They can also create dashboards and machine learning jobs.

We went beyond the inverted index. We created new data types, implemented BKD trees, and added a columnar store — all of which leads to more efficiently structured data for faster searches, less memory use, and less disk use. In other words: you can access fields and values across petabyte-scale data at remarkable speeds.


Consolidate data from hundreds of Prometheus instances and achieve a global view across geographically dispersed endpoints. Unify your metrics from Prometheus with your logs and APM data in Elasticsearch and analyze them all in Kibana. You can connect Metricbeat to the Prometheus server or directly to the Prometheus exporters.
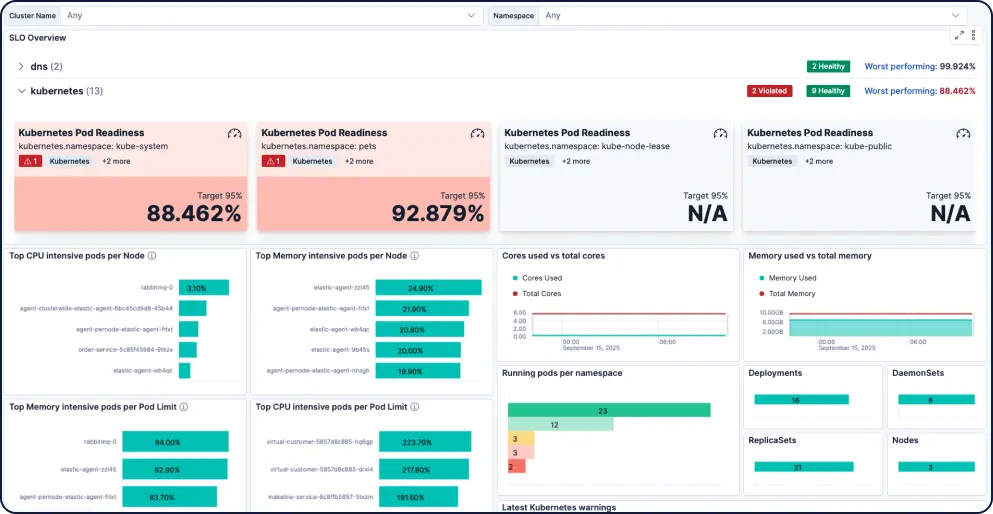
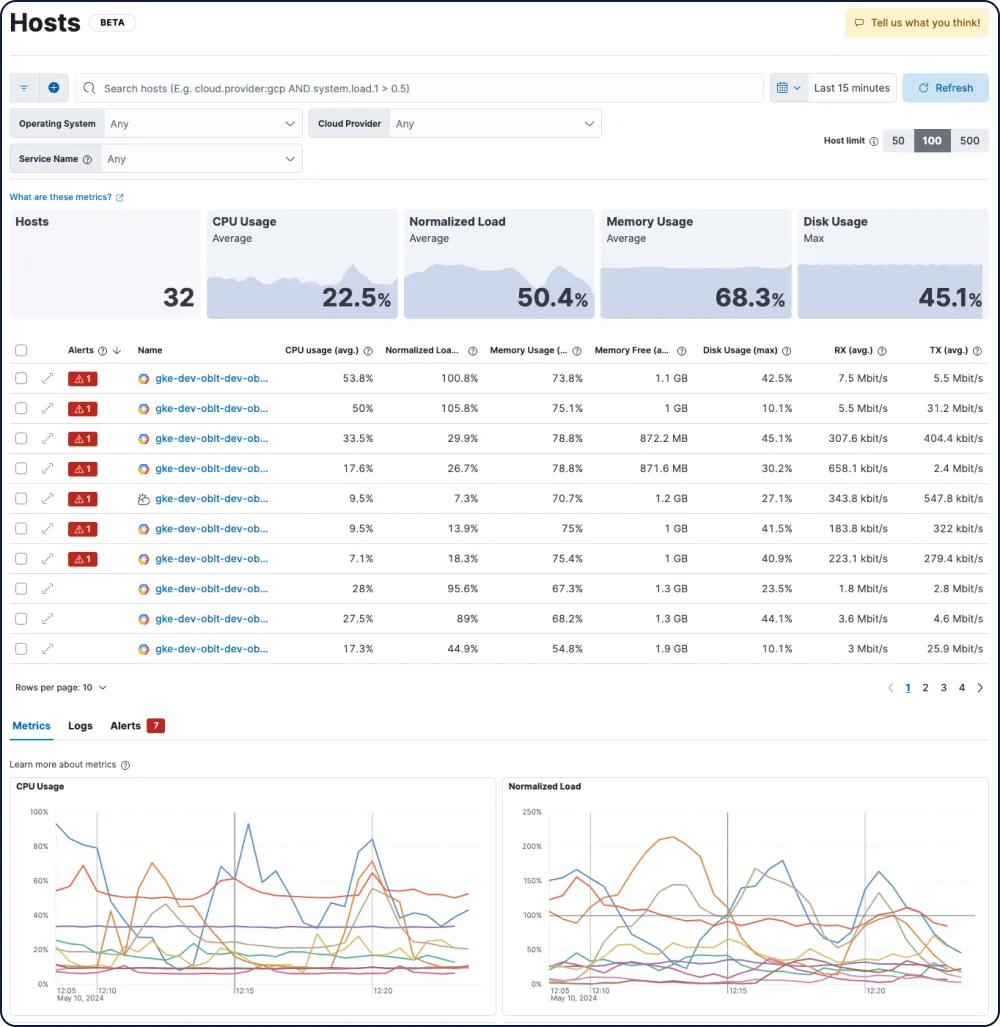
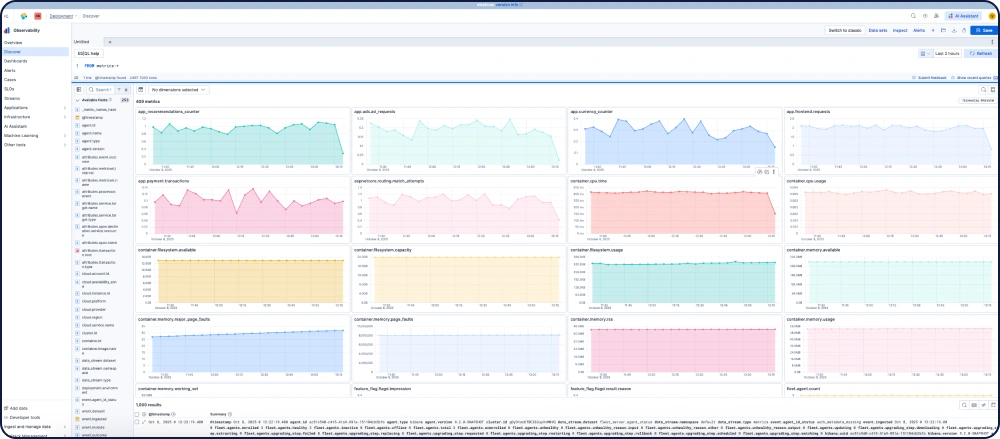
Get a different view of your infrastructure with perspectives aligned with your topology. Dig into current and historical performance by CPU, memory, or network traffic. Then get granular in the Metrics Explorer and create time series charts based on the aggregation of your choice. Select the fields you’d like to plot, slice and dice your data into sub-graphs, add optional filters, then enhance your visualizations in Time Series Visual Builder.
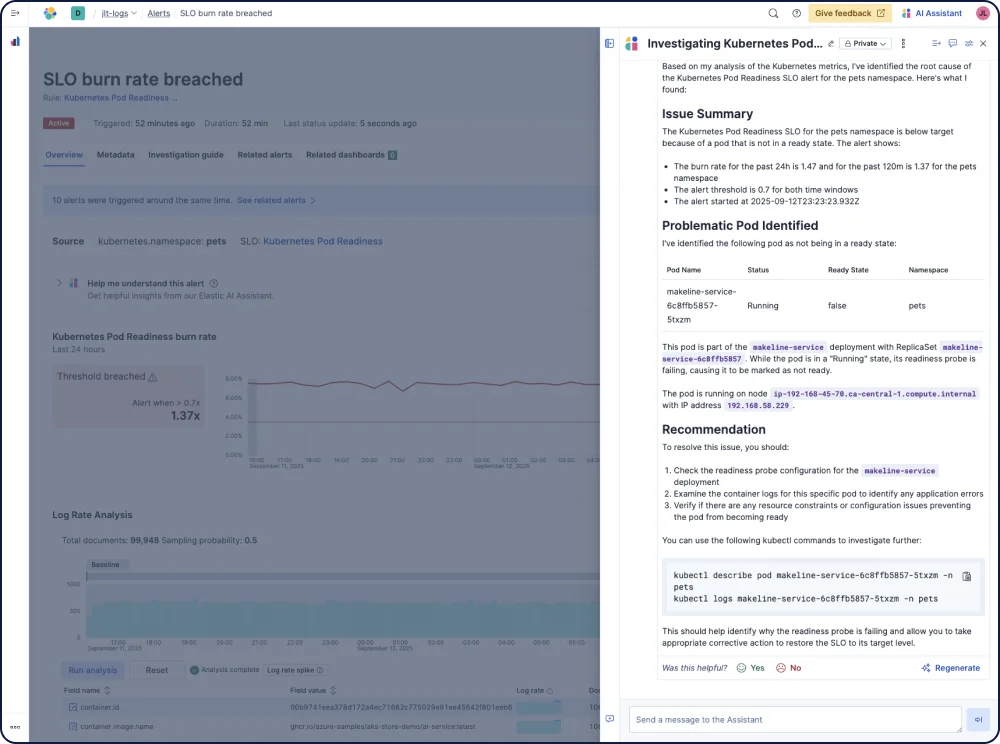
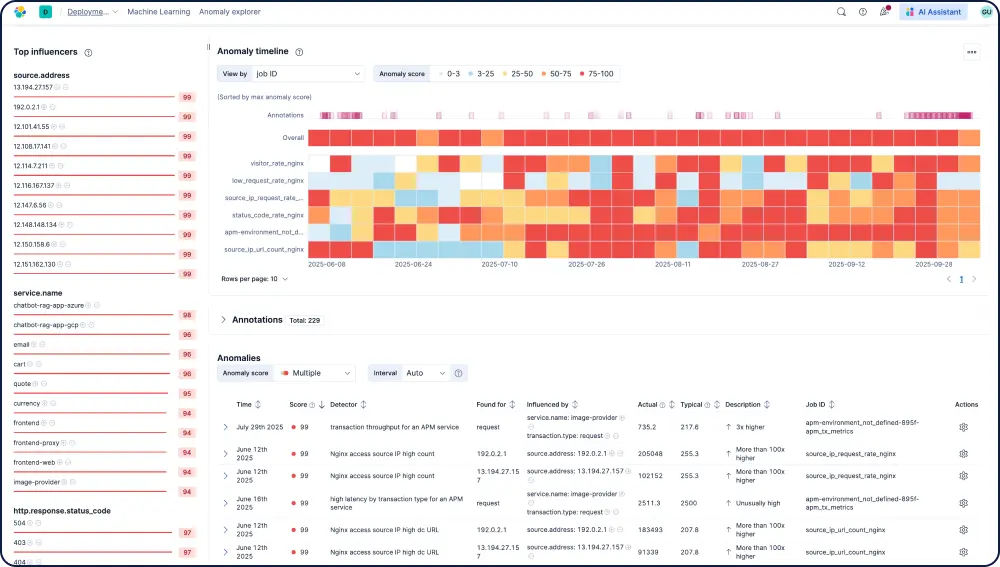
As data scales, it’s easy to lose errant data points among the streaming averages, measurements, and totals. Define machine learning jobs in a few clicks to start detecting anomalies in your data. Then create alerts so you’re ready to take action when something is awry.


SignUpCTA
We're here to help at every phase — from technical migration assistance to analyst training directly from Elastic experts.
Grab a fresh installation and get started. Have questions? Visit the Elastic Metrics documentation or join us on the Elastic Metrics forum.
- Hosted
- Download
- System
- Apache
- MongoDB
- Docker
- Kubernetes
Metricbeat created an index pattern in Kibana with defined fields, searches, visualizations, and dashboards. In a matter of minutes you can start viewing CPU and memory utilization, and process-level statistics.
Metricbeat modules have defaults and configurations for each system they connect to. See the documentation for supported versions and configuration options.
Have network data? Infrastructure logs? APM traces? Ingest and model all of it alongside your metrics and use free and open Elastic Observability to enrich your analyses, streamline your workflows, and simplify your architecture.