Modern observability and security on Kubernetes with Elastic and OpenTelemetry

 Share on Twitter
Share on Twitter

 Share on LinkedIn
Share on LinkedIn

 Share on Facebook
Share on Facebook

 Share by Email
Share by Email

 Print this page
Print
The structured nature of Kubernetes enables a repeatable and scalable means of deploying and managing services and applications. This has led to widespread adoption across market verticals for both on-premises and cloud deployment models. The autonomous nature of Kubernetes operation, however, demands comprehensive, fully-converged observability and security. This is uniquely possible today using the Elastic platform.
In this article, we discuss best practices for observing and securing application and service workflows on Kubernetes using Elasticsearch® and OpenTelemetry. You will learn how to:
- Deploy and configure Elastic Agent in your Kubernetes cluster
- Ingest OpenTelemetry application traces, metrics, and events using Elastic Agent
- Ingest Kubernetes container logs, cluster metrics, and network traffic patterns using Elastic Agent
- Use Elastic Defend to add security-centric monitoring and threat protection to your Kubernetes cluster
- Become familiar with Elastic's out-of-the-box dashboards to observe, correlate, and perform root cause analysis of operational issues
Data silos pose a challenge to troubleshooting Kubernetes deployments
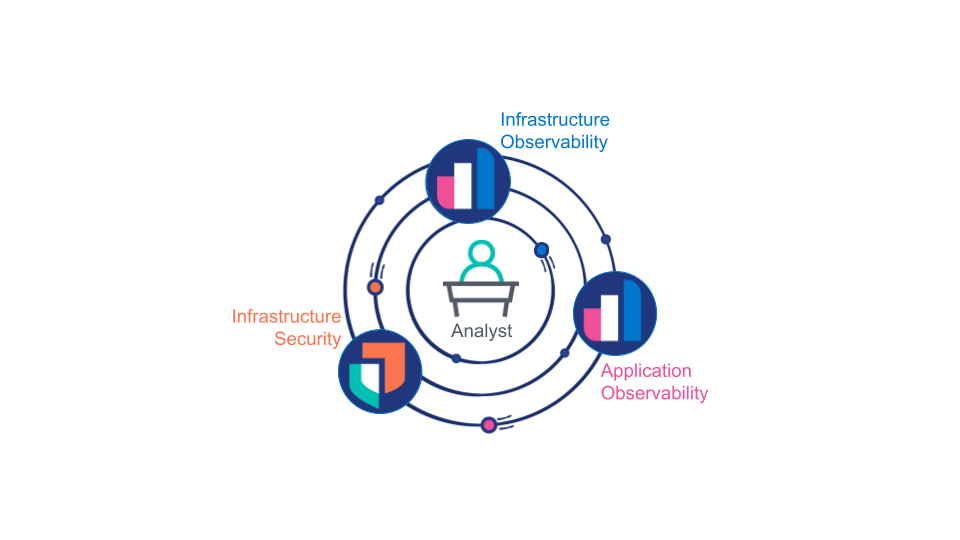
Historically the industry has considered application observability, infrastructure observability, and infrastructure security as distinct domains, each handled by separate tools managed by separate teams. This model, while often organizationally convenient, quickly exposes a common pain point and glass ceiling:
Analysts (human or machine) need to draw upon data collected across application observability, infrastructure observability, and infrastructure security to determine if a given operational issue is a problem with the infrastructure, a defect in an application, or a security breach. Further, specialists will also need access to full-fidelity data from all three of these sources to root cause a given issue.
As a workaround, customers often find themselves duplicating select observability data across multiple data platforms. At best, this doubles or triples the cost of data storage, support, and training. At worst, analysts are missing crucial data needed to properly root cause an issue. This is further exacerbated by the dynamic and scalable nature of Kubernetes. Arguably, separating observability and security platforms is an anti-pattern to the otherwise integrated model of service deployment Kubernetes affords.
An opportune time for observability
Ultimately, developers, operators, and security analysts alike need a unified end-to-end view of their system spanning across applications and infrastructure. Infrastructure deployment teams need a unified, Kubernetes-native deployment pattern to provide this visibility and secure their clusters.
This requires three enablers:
- All observability and security data, inclusive of application, service, and infrastructure logs, traces, events, and metrics must be stored in a unified data platform in a manner which is optimized for both search (correlation and latency) and storage (cost).
- The unified data platform must also be capable of correlating data and presenting it in role-based fashion: for example, if an analyst is trying to root cause an issue, the platform should guide the analyst toward the likely issue, and allow them to seamlessly interact with the data without caring about its underlying form or source.
- Instrumenting applications and infrastructure should align with the Kubernetes mantra: repeatable, scalable deployments without bespoke configuration.
Elastic: You know, for Kubernetes
A nexus of technology driven by Elastic, OpenTelemetry, Kubernetes, and modern compute hardware has made full-scale Kubernetes-native observability and security available today:
- OpenTelemetry is a catalyst for developers (both in-house and third-party) to fully instrument all of their applications and services by decoupling APM vendor selection from APM implementation
- Modern compute hardware with plentiful CPU and RAM makes “always-on” tracing practical without performance impact, even for real-time applications
- The latest Elastic architecture, inclusive of searchable snapshots and the new time series data stream, coupled with Elastic APM’s intelligent tail-based sampling, makes multi-year, on-line storage of comprehensive observability and security data practical and affordable
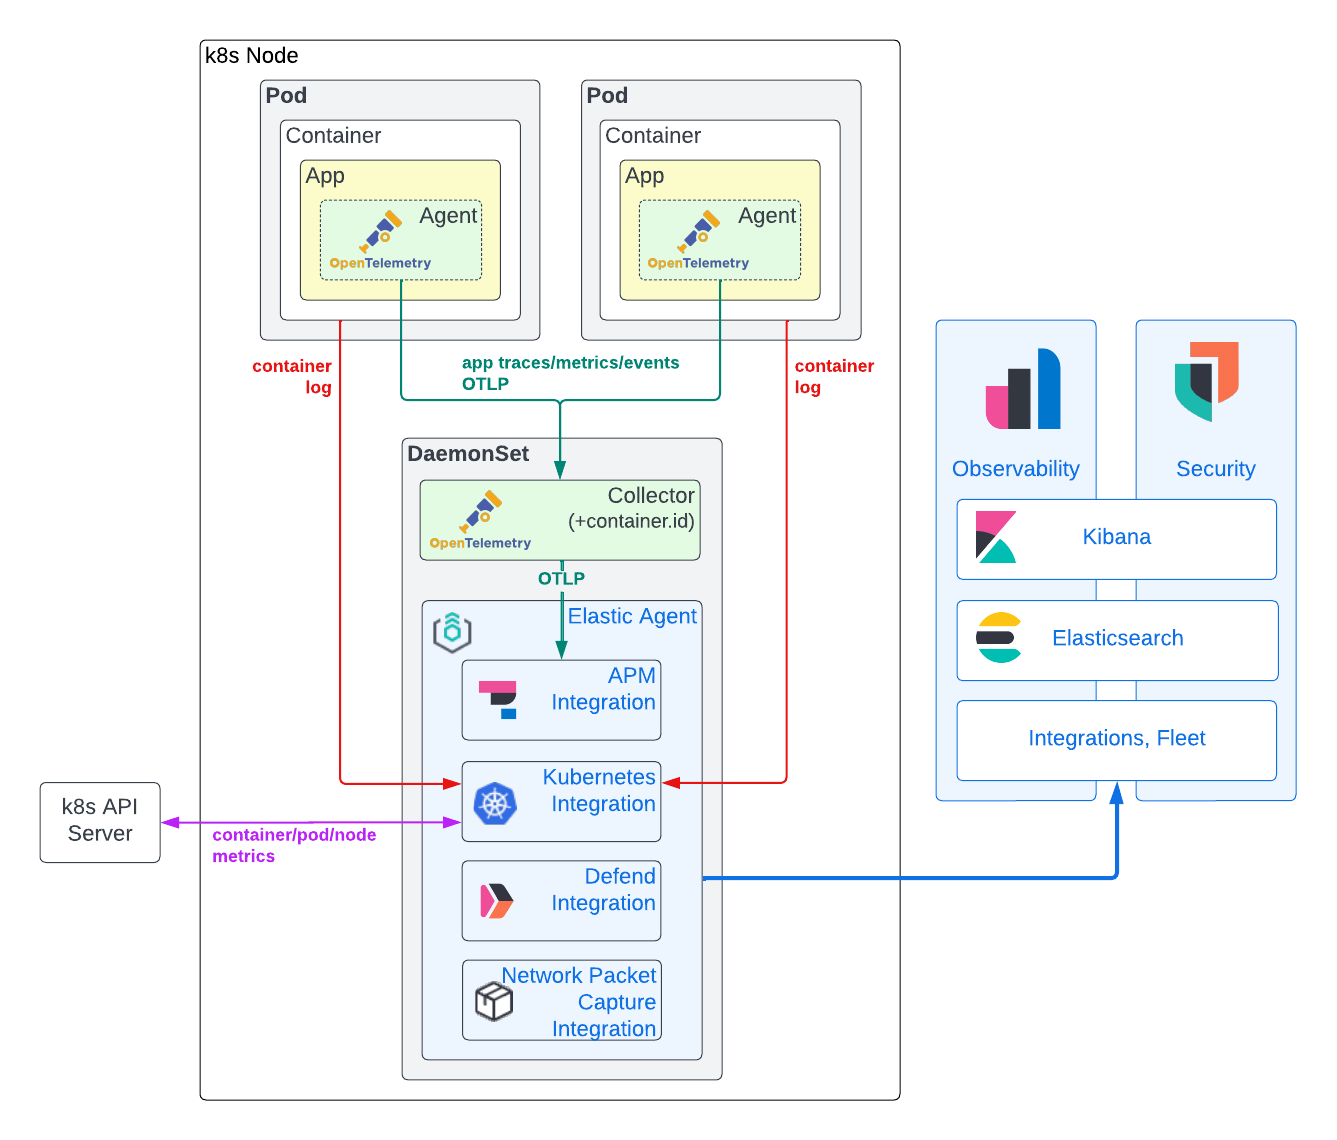
- Deployment of Elastic Agent into the DaemonSet on each Kubernetes node enables the repeatable and scalable deployment of a remotely-controlled unified data collector. Once deployed, Elastic Agents can be managed as a fleet to trivially add, configure, or remove data integrations.
- The Elastic platform provides a fully-integrated Kubernetes security solution, spanning protection, observation, and posture management
- Elasticsearch enables correlation and guidance across all collected data sources using out-of-the-box dashboards, anomaly detection, and alerts
Data collection model
As you can see in the following diagram, we are recommending a hybrid model for observability and security data collection, relying on the Elastic Agent to obtain Kubernetes infrastructure metrics and application container logs in tandem with the OpenTelemetry APM agent to obtain application traces, trace events, and metrics. The rationale for this approach is described in some detail below.
Application trace, event, and metric data
Generating application traces and metrics generally requires the direct infusion of an APM library into application code. We can remove vendor lock-in as a barrier to APM adoption, however, by making use of OpenTelemetry APM agents. To date, OpenTelemetry has put the bulk of its efforts toward robust and standardized agent implementations to capture application traces and trace events, with emerging support for application metrics. Reasonably mature agents exist today for nearly every popular programming language. In many cases, you can use auto-instrumentation to instrument your applications with little to no coding effort. If your applications are written in .NET, Java, NodeJS, or Python and make use of typical frameworks, you can even inject APM libraries at run time using the OpenTelemetry Kubernetes operator!
Root cause analysis requires APM data to be correlated against application logs and infrastructure metrics. To enable this correlation, we need certain identifying metadata, or resource attributes, to be common across application tracing and logs and infrastructure metrics. The Elastic platform uses service.name, pod.uid and container.id to link together observability data from applications running in Kubernetes. Historically, APM libraries would "peek" outside their walls to obtain this metadata. Some of the OpenTelemetry APM libraries currently support this functionality (for example, Java), while others do not (Rust). While simplifying deployment, this approach is admittedly far from ideal: APM agents (running in the context of an application) need to not only determine their runtime environment (docker, Kubernetes, etc.), but also require sufficient permission to access these identifiers (for example, access to /proc/self/cgroup or the Kubernetes APIs). The latter is obviously a potential security concern. As such, we ideally want to rely on external entities to either pass in such metadata (as environment variables), or to append such metadata after the trace data is created. To reliably append container.id to trace data regardless of the OpenTelemetry APM library in use, we deploy an OpenTelemetry Collector configured with the k8sattribute processor running in the node's DaemonSet.
After the APM data has been tagged with correlating Kubernetes metadata, it is forwarded from the OpenTelemetry Collector to an Elastic Agent also running in the node's DaemonSet. The Elastic Agent has been configured via Fleet with the APM integration. Distributing the APM integration into each node DaemonSet helps distribute APM ingest load and more closely ties its availability to the applications it supports. Additionally, it keeps GRPC/HTTP2 traffic local to the DaemonSet itself, side stepping GRPC/HTTP2 load balancing complexities. Finally, security is simplified: OTLP can be left insecure on the node, with Fleet-managed Elastic Agent TLS security employed between the node and the Elasticsearch cluster. The Elastic APM integration converts the OpenTelemetry trace, metric, and event data to the Elasticsearch Common Schema (ECS). The resulting documents are then sent to Elasticsearch to be ingested and indexed.
Container logs and Kubernetes infrastructure metrics
While the OpenTelemetry standard supports logging, the implementations are still being drafted. As such, many of the available agents do not yet support an ability to hook logging frameworks. In practice, ingesting container log files is the only practical means of capturing application log data. While this is possible with the OpenTelemetry Collector filelogreceiver, it is currently of alpha quality and not yet recommended for production use cases. The same argument is applicable to the k8sclusterreceiver intended to capture Kubernetes infrastructure metrics.
By comparison, the Elastic Kubernetes integration is robust, proven, and provides full-fidelity collection of application logs and Kubernetes infrastructure metrics. Furthermore, our Kubernetes integration can be remotely managed at a fleet level from Kibana, vastly simplifying configuration. Unlike application traces and metrics, the Elastic Kubernetes integration operates outside of your application code, thus mitigating concern of vendor lock-in.
Additionally, the presence of an Elastic Agent in each node's DaemonSet has value far beyond Kubernetes integration. As you will see later in this article, we will leverage this same Elastic Agent instance to deploy Elastic Defend to monitor and secure our Kubernetes nodes.
Security events and host data
Modern Kubernetes observability and security workflows need to go hand-in-hand to enable analysts to root cause a given issue. Elastic’s security solutions provide fully-integrated, full-featured, Kubernetes-aware SIEM, SOAR, and XDR solutions, including endpoint protection.
Notably, Elastic's Defend integration inherently provides vastly increased Kubernetes observability. Our Kubernetes Security Posture Management integration can alert your development, DevOps, and DevSecOps teams to potential configuration issues with applications before they are identified by your security team. Our Kubernetes security dashboard allows analysts to understand exactly what processes have executed on your Kubernetes nodes, when, with what runtime parameters, and under what account! This unprecedented level of runtime visibility makes it possible to detect unforeseen security threats introduced into container layers used as dependencies in your containerized applications.
Like Elastic's APM integration, these security integrations are added, configured, and removed via Fleet and run inside the Elastic Agent in the DaemonSet on each node of your Kubernetes cluster.
Let's get to work!
Requirements
You will need a Kubernetes cluster on which to deploy your apps, the Elastic Agent, and the OpenTelemetry Collector. I like using kOps to easily create, manage, and delete test clusters in the hyperscalers. For reference, a single AWS EC2 t3.xlarge is sufficient to deploy the OpenTelemetry demo and our Elastic Agent. The examples here should work with any self-managed or managed (for example, EKS, GKE) Kubernetes clusters in any of the major hyperscalers or on-premises (for example, OpenShift). They should also theoretically work with desktop Kubernetes clusters (such as MicroK8s or Docker's built-in Kubernetes engine), assuming you grant these environments sufficient RAM and CPU (for example, 4 vCPUs and 16GB RAM). You will also need basic Kubernetes administrative knowledge (for example, deploying yaml, checking pod status, and viewing pod log files). Before starting, make sure your Kubernetes context is pointed to the correct cluster.
You will also, of course, need applications or services that you can instrument with OpenTelemetry. To get started, you can use our fork of the OpenTelemetry Demo. From there, you can follow our best practices to instrument your own applications and services.
Finally, you will need access to a modern (8.5 or greater) Elasticsearch deployment you can play with (you can create one for free in our cloud!), reachable from your Kubernetes applications cluster.
Tools
This tutorial assumes you are using a Linux or MacOS based host to configure your Kubernetes cluster. You will need to ensure the following tools are installed:
Create your Elasticsearch cluster
If you already have a modern Elasticsearch deployment you can play with, great! If not, let's set one up by creating a free trial cluster at cloud.elastic.co!
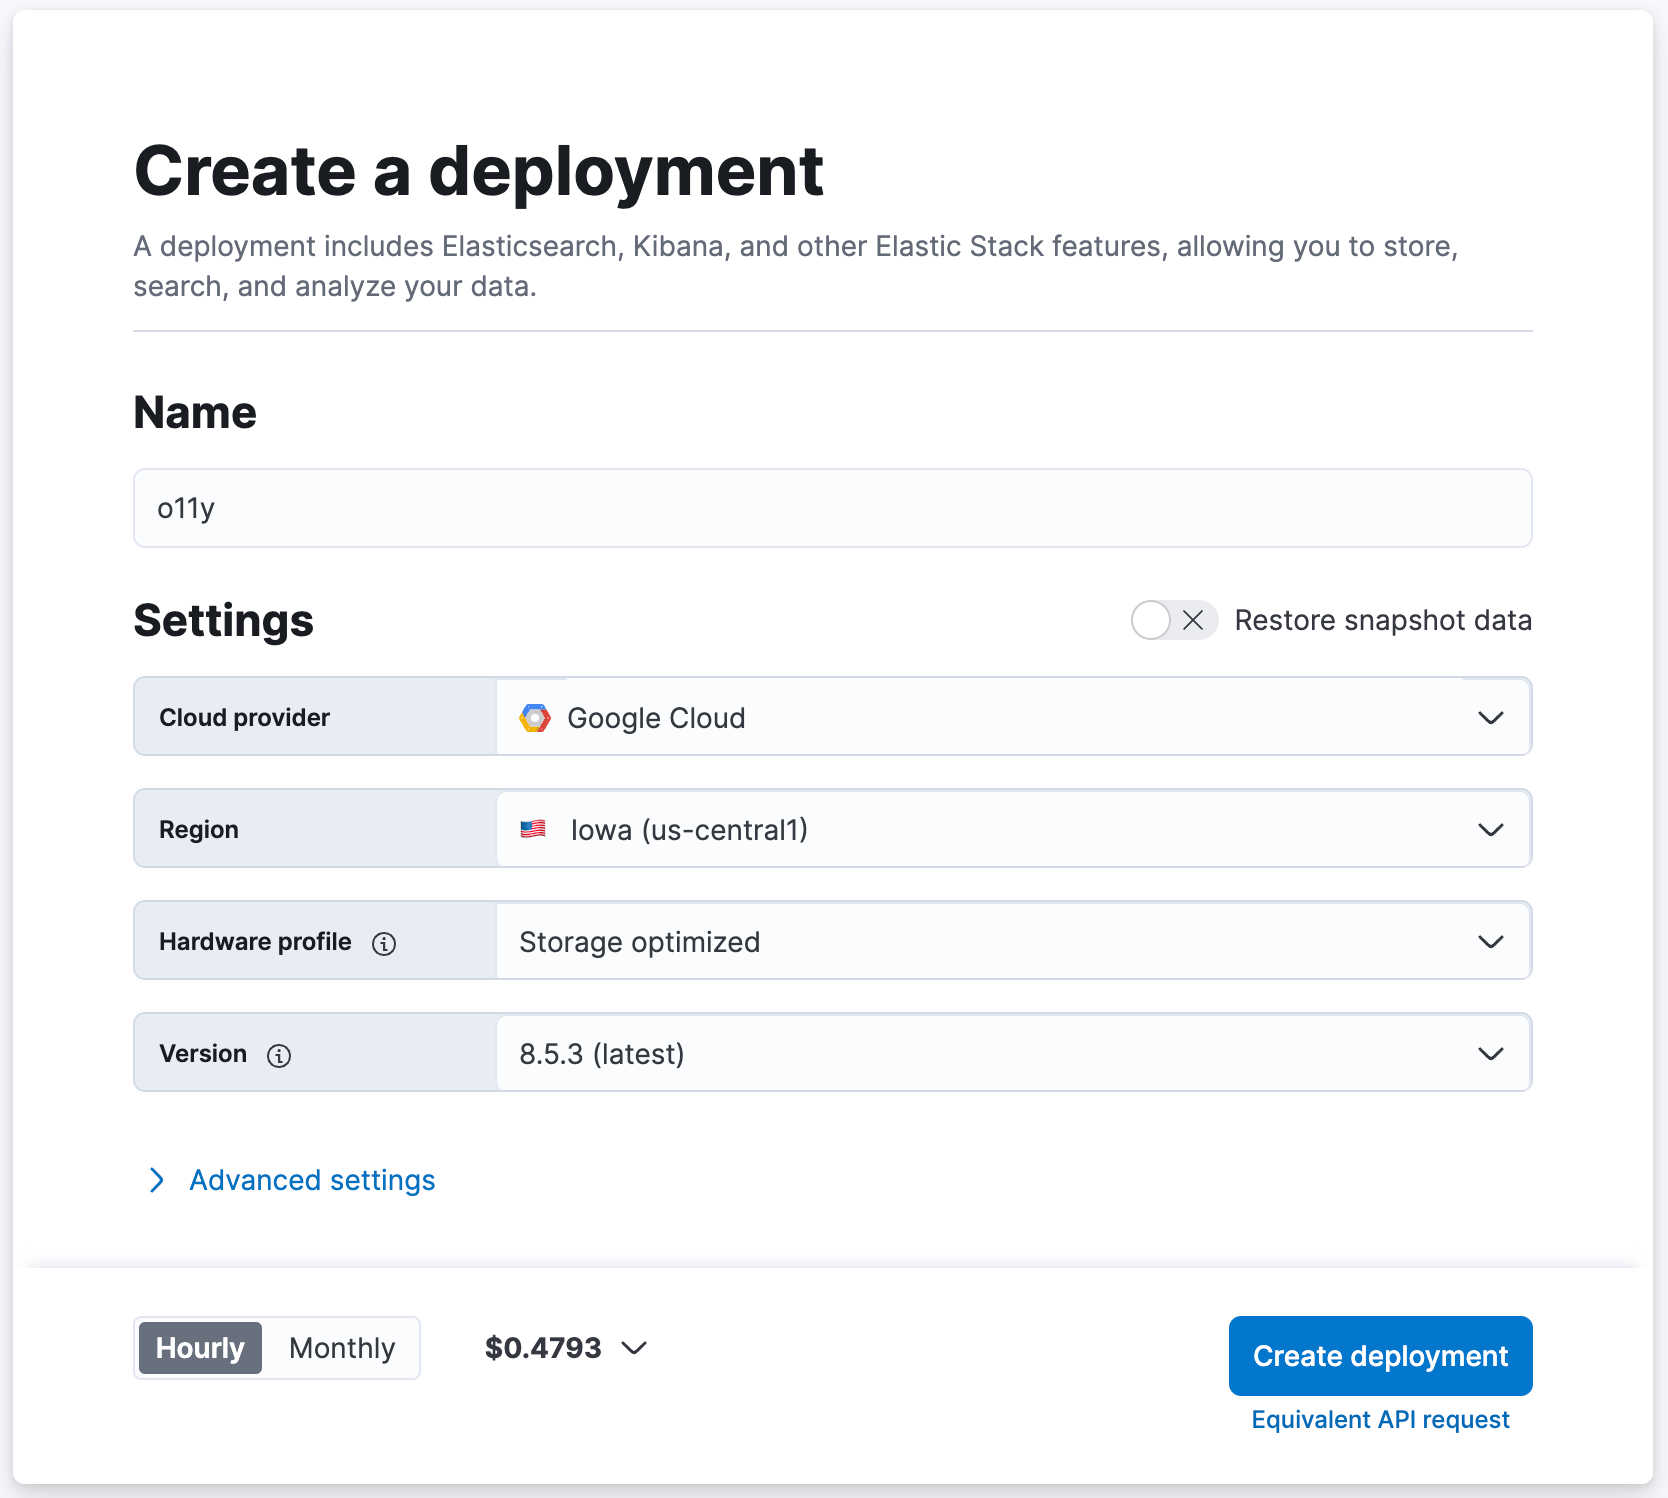
- Navigate to cloud.elastic.co to sign up for a free trial (no credit card required)
- Name your Elasticsearch cluster "o11y", for example, and keep the other settings at their default values
- Click [ Create Deployment ]
- Wait for Elasticsearch Cloud to report that "Your deployment is ready!"
- Click [ Continue ] to log into Kibana
Deploy Elastic Agent to the DaemonSet
We will be using Elastic Agent (with integrations) installed into the DaemonSet on each node of your Kubernetes cluster to ingest data into Elasticsearch.
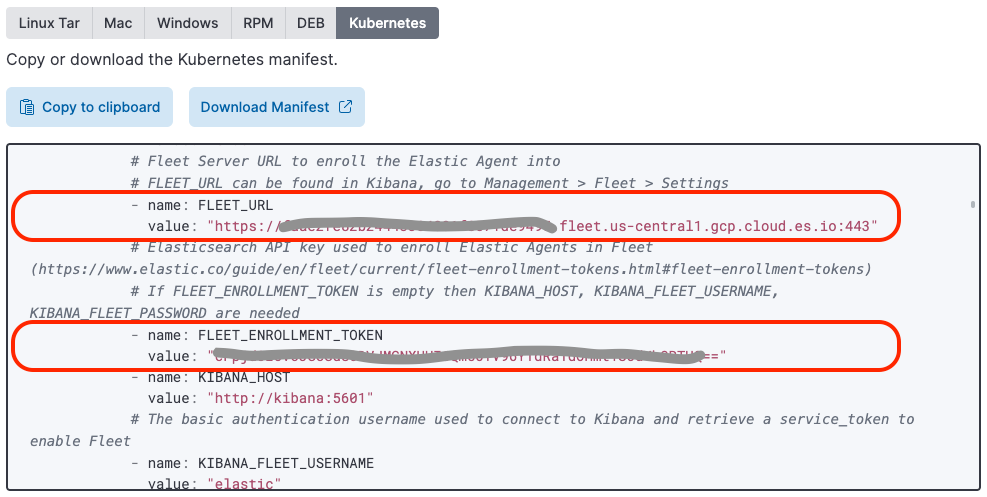
1. Download the following YAML (referenced here) to your local machine. We will use this YAML to deploy Elastic Agent (with Elastic Defend) into the DaemonSet of your Kubernetes nodes.
curl -L -O https://raw.githubusercontent.com/elastic/endpoint/main/releases/8.5.0/kubernetes/deploy/elastic-defend.yaml2. Download the following patch to your local machine. This patch raises the default Elastic Agent container RAM and CPU allocations to comfortably accommodate all of the integrations we will install. In production, you may decide to only deploy a subset of the integrations below which may render this modification moot.
curl -L -O https://raw.githubusercontent.com/ty-elastic/elastic-otel-k8s/main/agent/8.5.0/elastic-defend.yaml.patch3. Apply the patch in-place
patch elastic-defend.yaml elastic-defend.yaml.patch4. Ensure you are logged into Kibana on your Elasticsearch cluster
5. Navigate to [ Management / Fleet ]
6. Click on [ Add agent ]
7. Name the new policy "k8s-apps", for example
- The "k8s-apps" policy will be used herein to deploy integrations to the DaemonSet of nodes in your application Kubernetes cluster
8. Under [ Advanced options ], Set [ Unenrollment timeout ] to "3600" seconds
- Kubernetes can dynamically create and delete nodes; this setting will ensure that Elastic Agents deployed on deleted nodes are automatically pruned
9. Click [ Create policy ]
10. Under [ Install Elastic Agent on your host ], select "Kubernetes"
11. Find the value of the "FLEET_URL" variable and copy it to the value of "FLEET_URL" in the "elastic-defend.yaml" file you previously downloaded and patched
12. Find the value of the "FLEET_ENROLLMENT_TOKEN" variable and copy it to the value of "FLEET_ENROLLMENT_TOKEN" in the "elastic-defend.yaml" file you previously downloaded and patched
13. Apply elastic-defend.yaml to your cluster via:
kubectl apply -f elastic-defend.yaml14. Wait for [ Confirm agent enrollment ] to show that "1 agent has been enrolled"
15. Wait for [ Incoming data confirmed ] to show that "Incoming data received from 1 of 1 recently enrolled agent"
16. Click "Close"
You may have noticed that Elastic provides pre-configured Elastic Agent deployment YAML when you select the Kubernetes host option. This deployment YAML does not yet include the Elastic Defend image.
Setup Elastic Agent integrations
Now comes the easy part! With a Fleet-managed Elastic Agent deployed into your DaemonSet, it is trivial to remotely add/configure/delete integrations using the Kibana integrations interface.
APM
The Elastic APM integration is used to import OpenTelemetry APM data into Elastic.
- Navigate in Kibana to [ Management / Integrations ]
- Search for "APM"
- Click [ APM ]
- Click [ Manage APM integration in Fleet ]
- Click [ Add Elastic APM ]
- Set [ General / Server configuration / Host ] to "0.0.0.0:8200" (This exposes the APM integration ingest to other pods (including the OpenTelemetry Collector, also running in the DaemonSet) on the node.)
- Disable [ Agent authorization / Anonymous Agent access ] (This simplification enables the OpenTelemetry Collector to send OTEL data to the Elastic APM integration without an authorization token (notably, the APM integration is not exposed outside of the node).)
- Optionally enable [ Tail-based sampling ] (This enables intelligent sub-sampling of trace data to capture anomalies and overall performance while reducing storage requirements.)
- Set [ Where to add this integration ] to "Existing hosts" and set [ Agent policy ] to "k8s-apps"
- Click [ Save and continue ]
- Click [ Save and deploy changes ]
Kubernetes
Deploy Kube State Metrics
The Kubernetes integration requires kube-state-metrics to be available in your Kubernetes cluster to enable the out-of-the-box Kubernetes dashboards.
1. Add the kube-state-metrics helm repo
helm repo add prometheus-community https://prometheus-community.github.io/helm-charts helm repo update2. Install kube-state-metrics to your Kubernetes cluster into the same namespace as Elastic Agent (which, using the provided deployment yaml for Elastic Agent, defaults to “kube-system”)
helm install --set namespaceOverride=kube-system kube-state-metrics prometheus-community/kube-state-metricsInstall Kubernetes integration
The Elastic Kubernetes integration is used to import Kubernetes metrics and logs into Elasticsearch.
- Navigate in Kibana to [ Management / Integrations ]
- Search for "Kubernetes"
- Select [ Kubernetes ]
- Click [ Add Kubernetes ]
- Enable [ Collect Kubernetes metrics from kube-state-metrics ] if it isn’t already set
- Set [ Where to add this integration ] to "Existing hosts" and set [ Agent policy ] to "k8s-apps"
- Click [ Save and continue ]
- Click [ Save and deploy changes ]
Elastic Defend
The Elastic Defend integration is used to protect your Kubernetes nodes and to collect additional security-centric observability data.
- Navigate in Kibana to [ Management / Integrations ]
- Search for "Elastic Defend"
- Select [ Elastic Defend ]
- Click [ Add Elastic Defend ]
- Set the [ Integration name ] to be "defend-1"
- Navigate to [ Select configuration settings ], set [ Select the type of environment you want to protect ] to "Cloud Workloads (Linux servers or Kubernetes environments)", and set [ To reduce data ingestion volume, select Interactive only ] to "All events"
- Set [ Where to add this integration ] to "Existing hosts" and set [ Agent policy ] to "k8s-apps"
- If your Kubernetes cluster is not running on GKE or EKS, under [ Advanced options ] set [ Namespace ] to "k8sapps", for example, where "k8sapps" identifies your application Kubernetes cluster (This is necessary to tag Elastic Defend telemetry with the name of the Kubernetes cluster to which it applies.)
- Click [ Save and continue ]
- Select [ Settings ]
- Navigate to [ Elastic Defend version ] and enable "Keep integration policies up to date automatically"
- Select [ Integration policies ] and click on [ defend-1 ]
- Navigate to [ Type: Operating system / Event Collection: Linux ] and enable [ Capture terminal output ]
- Click [ Save and continue ]
- Click [ Save and deploy changes ]
Certain Elasticsearch Kubernetes dashboards require knowledge of your Kubernetes cluster name and ID. If your cluster is running on GKE or EKS, Elastic Agent will automatically obtain this metadata. If you are running a self-managed Kubernetes cluster, you can create an ingest pipeline to adorn security events with orchestrator.cluster.name and orchestrator.cluster.id fields automatically set from the policy namespace you defined earlier.
- Navigate to [ Management / Dev Tools ]
- Execute the following:
PUT _ingest/pipeline/logs-endpoint.events.process@custom
{
  "processors": [
    {
      "set": {
        "field": "orchestrator.cluster.name",
        "copy_from": "data_stream.namespace",
        "ignore_empty_value": true,
        "ignore_failure": true
      }
    },
    {
      "set": {
        "field": "orchestrator.cluster.id",
        "copy_from": "data_stream.namespace",
        "ignore_empty_value": true,
        "ignore_failure": true
      }
    }
  ]
}Kubernetes Security Posture Management
The Elastic Kubernetes Security Posture Management integration is used to validate your Kubernetes cluster and applications against best practices for secure Kubernetes configuration, as defined by the Center for Internet Security (CIS). This allows your development and deployment teams to catch misconfigurations before they result in a security breach.
- Navigate in Kibana to [ Management / Integrations ]
- Search for "Kubernetes Security Posture Management"
- Select [ Kubernetes Security Posture Management ]
- Click [ Add Kubernetes Security Posture Management ]
- Set [ Kubernetes Deployment ] to "Unmanaged Kubernetes" (for self-managed Kubernetes) or "EKS (Elastic Kubernetes Service)" if your Kubernetes application cluster is specifically running on AWS EKS
- Set [ Where to add this integration ] to "Existing hosts" and set [ Agent policy ] to "k8s-apps"
- Click [ Save and continue ]
- Click [ Save and deploy changes ]
Network Packet Capture
The Elastic Network Packet Capture integration is used to gain insight into the network traffic into and out of your Kubernetes nodes.
- Navigate in Kibana to [ Management / Integrations ]
- Search for "Network Packet Capture"
- Select [ Network Packet Capture ]
- Click [ Add Network Packet Capture ]
- Set [ Where to add this integration ] to "Existing hosts" and set [ Agent policy ] to "k8s-apps"
- Click [ Save and continue ]
- Click [ Save and deploy changes ]
Instrumenting with OpenTelemetry
I've optimized the OpenTelemetry Demo and OpenTelemetry Helm Charts for Elastic observability (see Instrument your own applications to understand what was changed and why). If you'd like to just use the applications in the OpenTelemetry Demo to understand the value Elastic brings to Kubernetes observability and security, start with Setup the OpenTelemetry demo. Otherwise, if you'd like to observe your own applications and services, start with the guidance outlined in Instrument your own applications.
Setup the OpenTelemetry demo
This section assumes you'd like to deploy and observe the applications already instrumented in the OpenTelemetry demo. We will be using a modified OpenTelemetry Helm chart which deploys both the demo applications and an OpenTelemetry Collector instance.
1. Add our helm repo
helm repo add elastic-open-telemetry https://ty-elastic.github.io/opentelemetry-helm-chartshelm repo update2. Install the demo apps and Collector into your Kubernetes cluster
helm install elastic-otel elastic-open-telemetry/opentelemetry-demo3. Verify installation by listing the running pods
kubectl get podsYou should see all of the OpenTelemetry demo pods in addition to an instance of the OpenTelemetry Collector:
> kubectl get pods
NAME                                                  READY   STATUS    RESTARTS   AGE
elastic-otel-adservice-86b5b4f779-8lsgf               1/1     Running   0          3h28m
elastic-otel-cartservice-55659bd5f4-lvtjx             1/1     Running   0          3h28m
elastic-otel-checkoutservice-88bfcf745-42nvt          1/1     Running   0          3h28m
elastic-otel-currencyservice-659dd55fc8-pcrrx         1/1     Running   0          3h28m
elastic-otel-emailservice-64df788455-mkb56            1/1     Running   0          3h28m
elastic-otel-featureflagservice-6dcf49d84c-n5jtk      1/1     Running   0          3h28m
elastic-otel-ffspostgres-67dcd7596d-htbpm             1/1     Running   0          3h28m
elastic-otel-frontend-674c8fdc74-zmv8r                1/1     Running   0          3h28m
elastic-otel-frontendproxy-5bd757dc89-r2728           1/1     Running   0          3h28m
elastic-otel-loadgenerator-5b98bd9656-8z8hz           1/1     Running   0          3h28m
elastic-otel-otelcol-agent-kbb54                      1/1     Running   0          3h28m
elastic-otel-paymentservice-5c4b5c57bd-wkbqj          1/1     Running   0          3h28m
elastic-otel-productcatalogservice-6995496975-7wm46   1/1     Running   0          3h28m
elastic-otel-quoteservice-849797dfdd-bkj29            1/1     Running   0          3h28m
elastic-otel-recommendationservice-6cb4476f-zpqqv     1/1     Running   0          3h28m
elastic-otel-redis-5698bf675b-dl2xv                   1/1     Running   0          3h28m
elastic-otel-shippingservice-6b9fdcc467-knlxb 1/1 Running 0 3h28m4. Skip ahead to Validation and observation to validate that your application traces, metrics, and events are flowing into Elasticsearch
Instrument your own applications with OpenTelemetry
This section assumes you will be instrumenting your own applications with OpenTelemetry. To make your applications work with the deployment model presented in this article, they will need to:
- Be instrumented with a stable OpenTelemetry APM Agent release
- Be instantiated with specific OpenTelemetry environment variables
- If using manual instrumentation, have certain span properties set appropriately
- Optionally add certain metadata to log lines
- Emit log data to stdout and stderr to be captured by the Elastic Kubernetes integration
Container environment variables
To enable Elastic's out of the box APM dashboards, we need to ensure application traces, metrics, and events carry appropriate contextual metadata. We can obtain this metadata from the Kubernetes Downward API, passing it into the application via the OTEL_RESOURCE_ATTRIBUTES environment variable.
We also need to set the OTEL_EXPORTER_OTLP_ENDPOINT to direct applications to send their OpenTelemetry data via OTLP to the OpenTelemetry Collector instance we will later deploy into the node's DaemonSet.
The following Kubernetes container configuration snippet sets up the environment variables you will need to apply to your applications in their deployment YAML.
---
apiVersion: apps/v1
kind: Deployment
...
spec:
  ...
  template:
    ...
    spec:
      containers:
        ...
        env:
          - name: OTEL_K8S_CONTAINER_NAME
            valueFrom:
              fieldRef:
                apiVersion: v1
                fieldPath: "metadata.labels['app.kubernetes.io/component']"
          - name: OTEL_K8S_NODE_IP
            valueFrom:
              fieldRef:
                fieldPath: status.hostIP
          - name: OTEL_K8S_POD_UID
            valueFrom:
              fieldRef:
                apiVersion: v1
                fieldPath: metadata.uid
          - name: OTEL_K8S_POD_IP
            valueFrom:
              fieldRef:
                apiVersion: v1
                fieldPath: status.podIP
          - name: OTEL_SERVICE_NAME
            valueFrom:
              fieldRef:
                apiVersion: v1
                fieldPath: "metadata.labels['app.kubernetes.io/component']"
          - name: OTEL_K8S_NAMESPACE
            valueFrom:
              fieldRef:
                apiVersion: v1
                fieldPath: metadata.namespace
          - name: OTEL_K8S_NODE_NAME
            valueFrom:
              fieldRef:
                apiVersion: v1
                fieldPath: spec.nodeName
          - name: OTEL_K8S_POD_NAME
            valueFrom:
              fieldRef:
                apiVersion: v1
                fieldPath: metadata.name
          - name: OTEL_EXPORTER_OTLP_ENDPOINT
            value: '$(OTEL_K8S_NODE_IP):4317'
          - name: OTEL_RESOURCE_ATTRIBUTES
value: service.name=$(OTEL_SERVICE_NAME),k8s.namespace.name=$(OTEL_K8S_NAMESPACE),k8s.node.name=$(OTEL_K8S_NODE_NAME),k8s.pod.name=$(OTEL_K8S_POD_NAME),k8s.pod.uid=$(OTEL_K8S_POD_UID),k8s.pod.ip=$(OTEL_K8S_POD_IP),k8s.container.name=$(OTEL_K8S_CONTAINER_NAME),k8s.container.restart_count=0You might be wondering why we are setting k8s.container.restart_count=0 as a resource attribute. The current OpenTelemetry Collector k8sattrribute processor requires this hint to match a container (via k8s.container.name) to a running instance of a container to obtain a container.id. Setting k8s.container.restart_count=0 is a simplification: keeping track of how many times a given container has been restarted by Kubernetes in a pod and somehow getting that into an environment variable would be tricky. Under typical scenarios, a container is generally only started once for a given pod lifetime. If a container is restarted by the pod, however, this simplification will fail.
Span properties
Elastic APM needs certain span properties to be explicitly set in order to properly characterize, classify, and visualize span data. Most of the OpenTelemetry APM auto-instrumentation libraries will set these fields for you. If you are manually instrumenting your application, however, you will need to explicitly set the following properties:SpanKind: In order for Elastic APM to properly classify spans, it needs to know the SpanKind (for example, INTERNAL, SERVER, CLIENT). Most of the OpenTelemetry APM auto-instrumentation libraries will set this field for you. If you are manually instrumenting your application, however, you must set SpanKind to SERVER for spans which accept RPC or REST calls, CLIENT for spans which initiate RPC or REST or database calls, and INTERNAL (default) for function calls within a service. In Java, for example, you would set SpanKind to SERVER for a span receiving a gRPC call using something like:
Span span = tracer.spanBuilder("testsystem.TestService/TestFunction").setSpanKind(SpanKind.SERVER).startSpan();RpcSystem / DbSystem: In order for Elastic APM to properly classify spans, it needs to know if the span represents a RPC transaction or a database transaction, and further what type of RPC or DB system is in use. Most of the OpenTelemetry APM auto-instrumentation libraries will set this field for you. If you are manually instrumenting your application, you should set the RpcSystem or DbSystem span attribute. In Rust, for example, you would set RpcSystem to 'grpc' for a span receiving a gRPC call using something like:
span.set_attribute(semcov::trace::RPC_SYSTEM.string("grpc"));NetPeerHost & NetPeerPort: In order for Elastic APM to properly map dependencies between services, when SpanKind is set to CLIENT (i.e., an outgoing gRPC or database call), the NetPeerName and NetPeerPort span attributes must be set to indicate the intended recipient of the call. Some of the OpenTelemetry APM auto-instrumentation libraries will set this field for you. If you are manually instrumenting your application, you must explicitly set these attributes. In JavaScript, for example, you would set NetPeerName and NetPeerPort for a span sending a gRPC call using something like:
// this => grpcJs.Client, this.getChannel().getTarget() => "dns:elastic-otel-productcatalogservice:8080"
const URI_REGEX = /(?:([A-Za-z0-9+.-]+):(?:\/\/)?)?(?<name>[A-Za-z0-9+.-]+):(?<port>[0-9+.-]+)$/;
const parsedUri = URI_REGEX.exec(this.getChannel().getTarget());
if (parsedUri != null && parsedUri.groups != null) {
    span.setAttribute(SemanticAttributes.NET_PEER_NAME, parsedUri.groups['name']);
    span.setAttribute(SemanticAttributes.NET_PEER_PORT, parseInt(parsedUri.groups['port']));
}Log attributes
Elastic APM can correlate specific log lines to specific traces. To enable this functionality, the log lines emanating from your application need to be tagged with span.id and trace.id key/value pairs where applicable. Some of the Elastic APM Agents (for example, the Java agent) will automatically modify your logging template to add this contextual metadata.
Deploy OpenTelemetry Collector to the DaemonSet
If you are working with the OpenTelemetry Demo and our modified OpenTelemetry Helm Charts, an optimized OpenTelemetry Collector was already installed into the DaemonSet on each node for you.
If you are instrumenting your own applications, you can use the following YAML as a basis to configure and deploy the OpenTelemetry Collector into the DaemonSet on the nodes in your cluster. The exemplary configuration (deployed using a ConfigMap) ingests OTLP trace, metric, and event data from applications on TCP port 4317 (grpc) and 4318 (http). Because the Collector is running in the DaemonSet, that port is reachable from other pods running on the same node via the node's IP. Incoming OTLP data is run through the k8sattributes processor to append container.id. We discard any log data that might be coming in (recall that we are obtaining this data via the Elastic Kubernetes integration), and pass through tracing, events, and metrics to the Elastic APM integration also running in the DaemonSet. The Elastic APM integration is listening on port 8200, also reachable via the node's IP (passed here as an environment variable obtained from the Kubernetes Downward API).
1. Download this exemplary OpenTelemetry Collector deployment YAML
curl -L -O https://raw.githubusercontent.com/ty-elastic/elastic-otel-k8s/main/collector/otel-collector.yaml2. Edit as appropriate for your deployment
3. Apply it to your Kubernetes cluster
kubectl apply -f otel-collector.yamlValidation and observation
In this section, we will validate that the observability and security data we configured above is coming into our Elasticsearch cluster as expected. This exercise will also serve as a brief overview of some of the out of the box observability and security dashboards available to you within Elasticsearch. We encourage you to use this as a springboard to explore our rich visualization and analytics offerings.
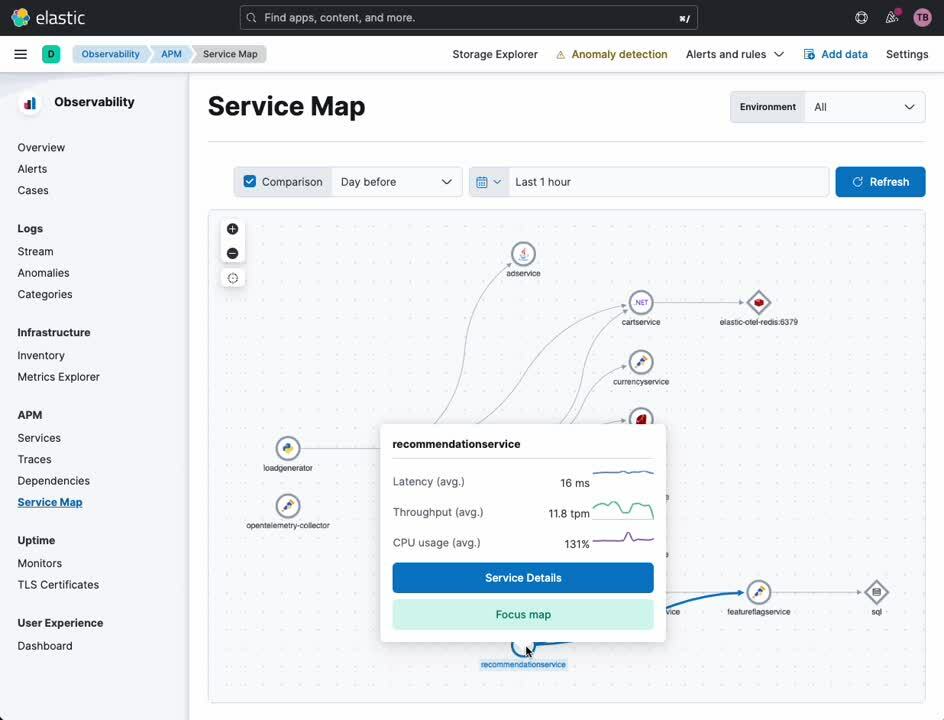
APM Service Map
The APM Service Map provides a visualization of your services and their relationship to one another. Certain types of service errors and alerts will be highlighted on this map as appropriate. From this map, you can pivot to a detailed view of any service instrumented with OpenTelemetry (or Elastic’s own APM agent).
- In the navigation sidebar of Kibana, select [ APM ] under [ Observability ]
- Select [ Service Map ] under [ APM ]
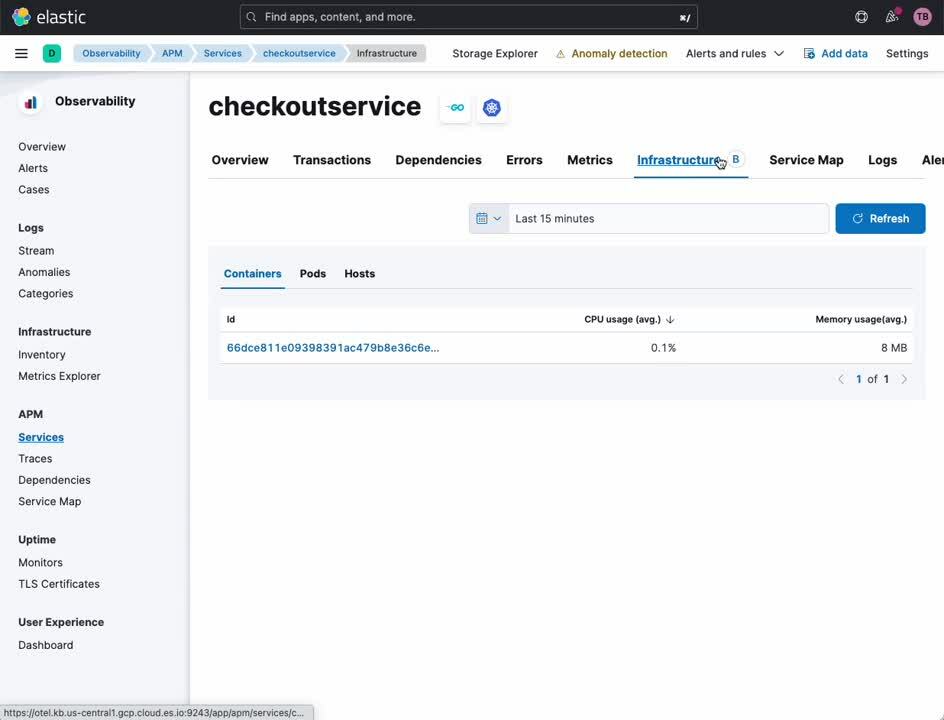
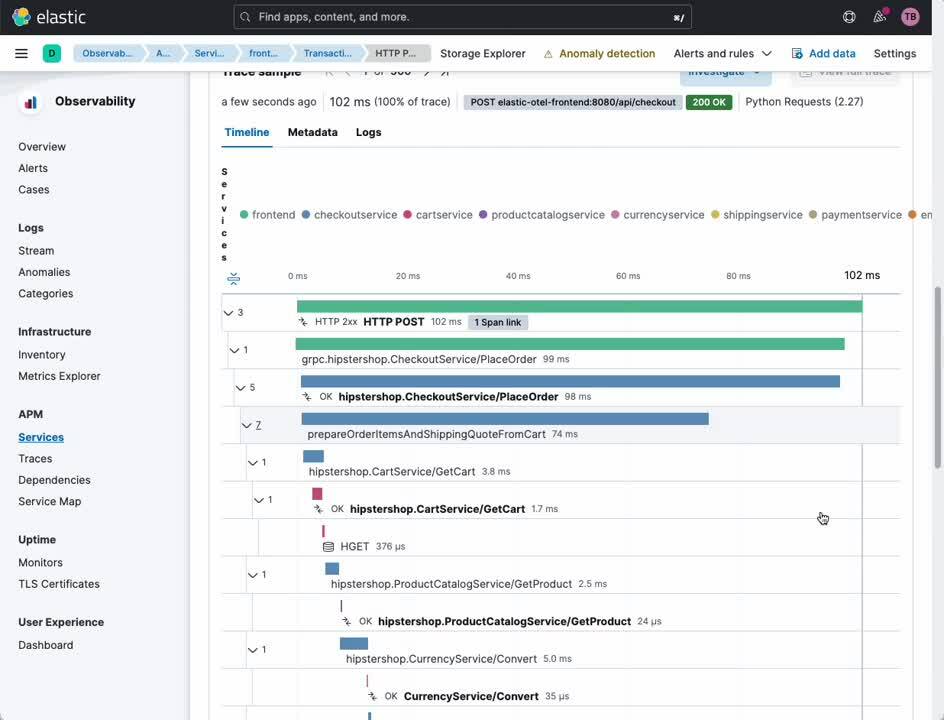
APM Service
The APM Service view provides an overview of a given service. From this dashboard, you can easily drill down into traces, logs, and related infrastructure metrics. Historically, a crude correlation between these data sources would require manual translation of timestamps and service identifiers across siloed observability platforms. With Elastic and OpenTelemetry, this correlation happens automatically, letting analysts, operators, and developers focus on root cause analysis rather than the nuances of observability tooling.
- In the navigation sidebar of Kibana, select [ APM ] under [ Observability ]
- Select [ Service Map ] under [ APM ]
- Right click on any service in the map
- Select [ Service Details ]
From this same view, you can easily pivot to examination of the transactions and spans which connect your users to your services, and the services to one another.
- Select [ Transactions ] from the header
- Select a transaction of interest from the [ Transactions ] subsection
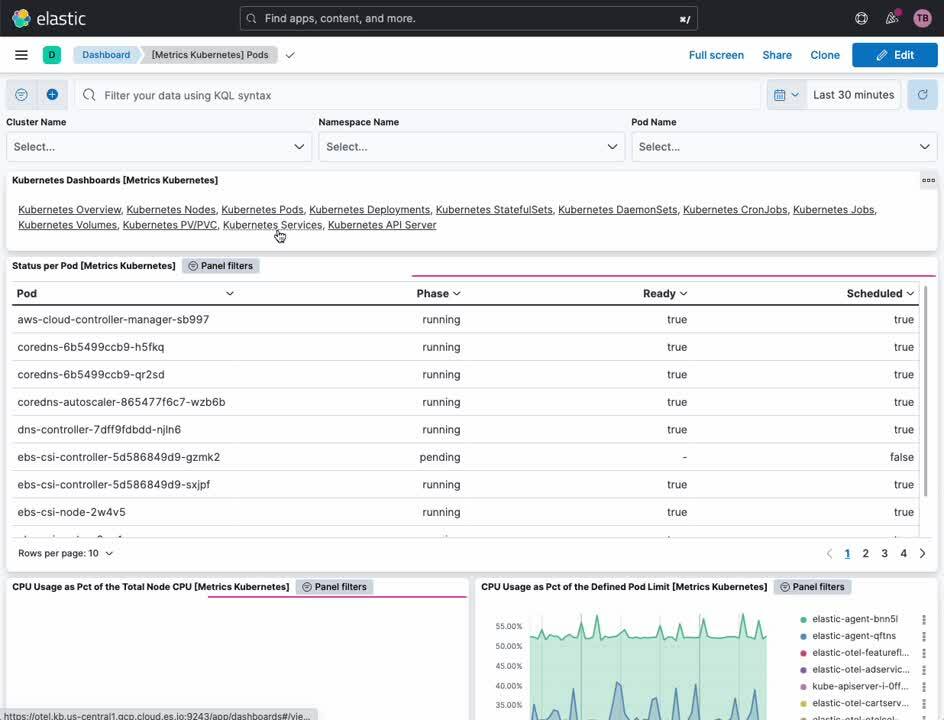
Kubernetes cluster metrics
The Elastic Kubernetes dashboards provide both an overview and detailed look at the operations of your Kubernetes cluster. From within, you can monitor metrics across clusters, nodes, pods, DaemonSets, services, and more.
- In the navigation sidebar of Kibana, select [ Dashboard ] under [ Analytics ]
- Select [ Kubernetes ] from the [ Tags ] menu
- Select the [ Cluster Overview ] dashboard
Kubernetes process monitoring
The Elastic Defend integration provides security-centric observability across your Kubernetes resources. The Kubernetes security dashboard allows analysts to understand exactly what processes have executed on your Kubernetes nodes, when, with what runtime parameters, and under what account.
- In the navigation sidebar of Kibana, select [ Dashboards ] under [ Security ]
- Select [ Kubernetes ]

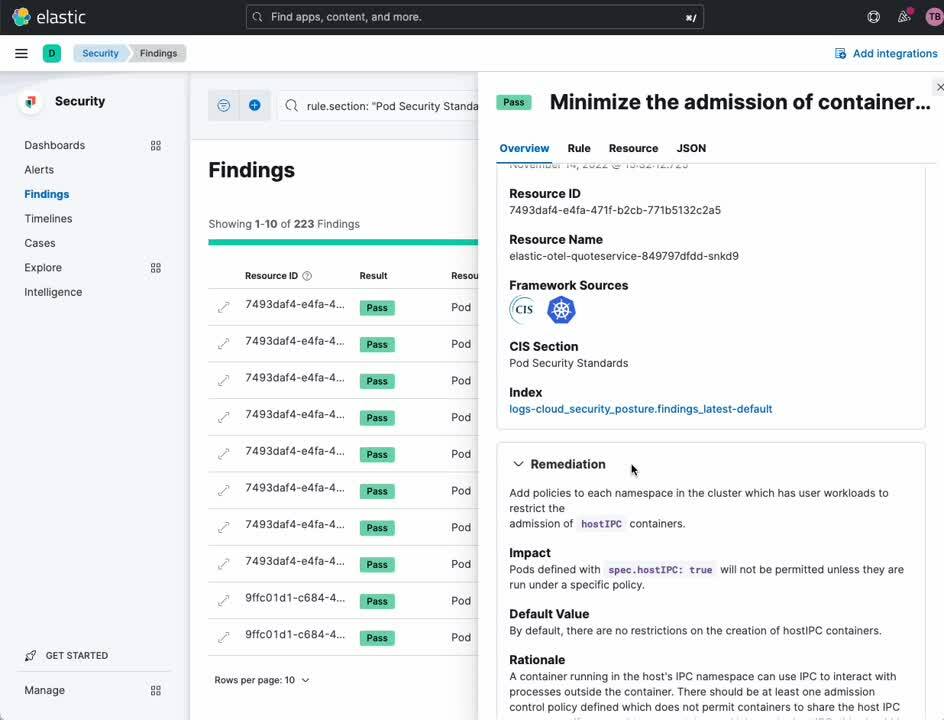
Kubernetes Security Posture Management
The Kubernetes Security Posture Management (KSPM) dashboard provides automated analysis and remediation recommendations across a gamut of Kubernetes best practices for secure deployment. For developers and DevOps personnel, this dashboard can provide invaluable notice of potential configuration issues before they are a problem in production.
- In the navigation sidebar of Kibana, select [ Dashboards ] under [ Security ]\
- Select [ Cloud Posture ]
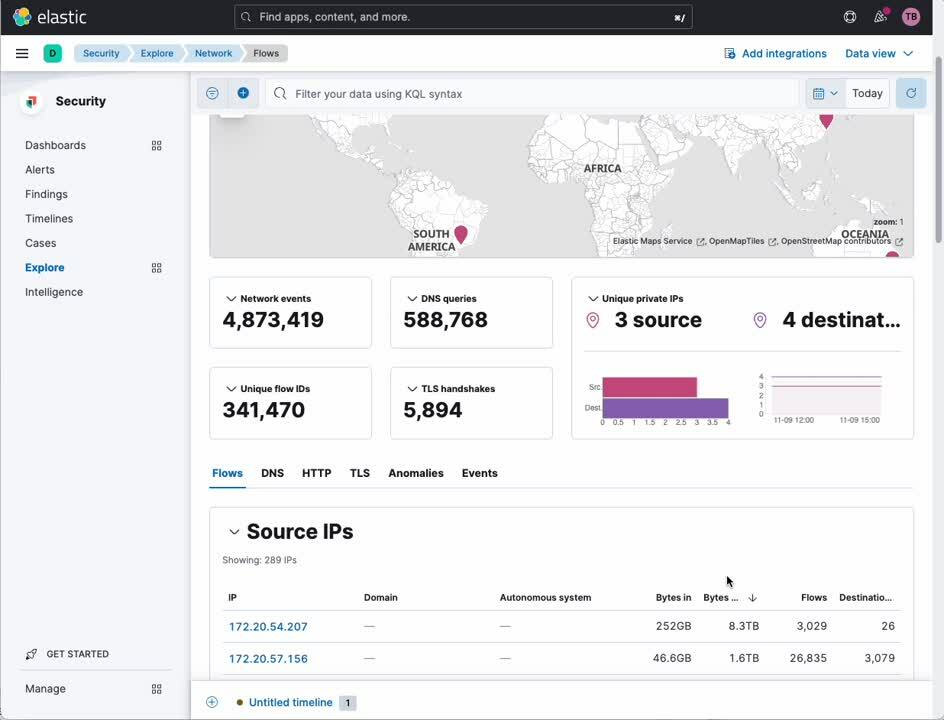
Network traffic analysis
The Network Packet Capture integration lets you deep dive into the IP traffic into and out of your Kubernetes nodes looking for badly behaving services or a security breach.
- In the navigation sidebar of Kibana, select [ Explore ] under [ Security ]
- Select [ Network ]
Elastic: Observability and Security built for Kubernetes!
Kubernetes represents a greenfield application deployment model for many enterprises. A greenfield deployment model requires an equally open-minded, modern, and holistic approach to observability and security. As shown here, the Elastic platform is uniquely poised in the industry to provide fully integrated, fully featured, and full fidelity observability and security for Kubernetes.
Interested? Reach out to our pre-sales team to get started building with Elastic!
Share
- Share on Twitter
Share on Twitter
- Share on LinkedIn
Share on LinkedIn
- Share on Facebook
Share on Facebook
- Share by Email
Share by Email
- Print this page
Print